Common Causes of Site Performance Issues
The following sections describe common issues that can negatively affect the performance of your Commerce website. Review the following information to learn how to identify and resolve common causes of poor website performance.
Content Delivery Network (CDN)
NetSuite provides CDN and caching services, which must be enabled in NetSuite. Third-party CDN and caching services aren't supported and must not be used because they can cause operational issues.
You can optimize your website and decrease page-loading time by caching data and site assets on the content delivery network (CDN) available with Commerce websites. A CDN replicates and stores (caches) files from an origin server (for example, NetSuite) and makes them available around the world. The main benefit of a CDN is that it makes server response times faster. CDNs improve performance because they are:
-
More likely to be geographically closer to the user than the origin server (lower latency).
-
Less likely to be as busy as the origin servers (load-balanced).
-
Set up to store and serve copies of files and data that have already been generated (significantly lower computational costs).
If you don't use a CDN, you could experience bottlenecks. Bottlenecks occur when numerous users try to access application resources simultaneously. Without a CDN, all users try to access a single, central resource instead of many distributed resources.
If you're using a CDN and your site experiences performance issues, check for issues like these:
-
If a particular node is down, your users might be routed to a server that is further away than normal.
-
An issue commonly referred to as cache misses, which means that the CDN does not have a copy of a requested resource.
-
When a copy isn't available, resource requests go straight to the application, which can take more time.
-
If you've recently cleared your site's cache or added new items or features to your site, cache misses will occur until the application generates and stores copies of all resources on the CDN.
-
Cache misses can also occur when cached resources are out of date. Cached resources are only stored for a set period of time.
-
-
You're using a third-party CDN instead of the built-in NetSuite feature. Third-party CDN setup isn't supported.
-
Other common causes of slow site performance are related to DNS issues. To learn more about DNS issues and how to resolve them, see Troubleshoot DNS Issues with the CDN.
Test if the CDN is Working
The most common cause of site performance issues is that the CDN isn't working at all. When you first set up a site, it's common to turn off caching because you're making frequent updates and want to avoid serving old files or constantly clearing the cache. After, it's easy to forget to turn caching back on when the site goes live. To check if you've enabled the CDN, see Enable CDN Caching for instructions.
If CDN caching is enabled but still appears to be malfunctioning, you can test it using these command-line tools:
-
digon Unix systems -
nslookupon Windows sytems
This example shows how to run dig:
dig IN A www.example.com
This example shows how to run nslookup:
nslookup -class=IN -querytype=A www.example.com
When testing, make sure you're looking up the correct domain for your website. For example, example.com and www.example.com are completely different domains, and you can only use one for your Commerce website.
When you run one of these commands, you should see your site's domain resolve to the CDN provider, for example, Akamai:
              ;QUESTION
webstore.example.com. IN A
;ANSWER
webstore.example.com. 14399 IN CNAME webstore.example.com.hosting.netsuite.com.
webstore.example.com.hosting.netsuite.com. 299 IN CNAME webstore.example.com.e87389.ctstdrv1234567.hosting.netsuite.com.edgekey.net.
webstore.example.com.e87389.ctstdrv1234567.hosting.netsuite.com.edgekey.net. 21599 IN CNAME e35026.x.akamaiedge.net. e35026.x.akamaiedge.net. 19 IN A 2.22.31.144
If the CDN isn't enabled, the A record resolves straight to a NetSuite server IP address:
              ;QUESTION
webstore.example.com. IN A
;ANSWER
webstore.example.com. 299 IN A 212.25.248.17
SEO Page Generator and Time To First Byte (TTFB)
Part of your site's frontend architecture is the SEO page generator. One of its main uses is to generate static, fully-rendered versions of your site's pages so search engines that can't process JavaScript can crawl them.
Time to First Byte (TTFB) measures the delta between when a browser requests content and when it starts to receive it. In simple terms, the web browser goes through the following process:
-
Looks up domains using DNS
-
Makes a TCP connection
-
Negotiates security via TLS/SSL
-
Sends a request for content
-
Waits for content (while timing TTFB)
-
Begins receiving content
You can use your browser's developer tools to measure TTFB, as shown in the following example:
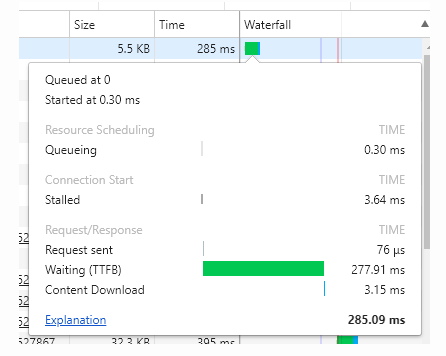
Refer to your browser's developer tool documentation for detailed instructions on troubleshooting TTFB issues.
You can also use the SEO page generator to troubleshoot TTFB issues. Its detailed logging lets you break big resource requests into smaller ones, giving you more detail than browser tools. For more information, see SEO Page Generator Debug Log.
If you're using the SEO page generator's debug log, look for these types of entries:
-
Sub-requests that are measured in 1000s of milliseconds rather than 100s
-
Any unusual status codes, in particular 301s and 302s (redirects), 404s (not found errors), and 500s, 502s and 503s (server errors)
-
Unnecessary service calls
If any of these entries show up in the log, they can help you figure out where to look for performance problems.
Image Optimization
Images are often the biggest reason for large page size and slow performance. There are several ways to optimize images, like increasing compression to shrink each image's size and using fewer images on a page. For more information, see Manage and Maintain Images.
Page Rendering
Page rendering performance refers to a different kind of performance-perceived performance. If you improve a page's perceived performance, you're giving users the impression that the page is loaded and ready to use. Often, how fast a page feels is as important as how fast it actually loads.
Several tools are available for testing perceived performance. These tools take screenshots at set intervals (like every 100 ms) to create a film strip you can review to see how long it takes to get a meaningful paint. Check your browser's developer tools for more information, or use a service such as WebPageTest.
Some common causes of perceived performance issues are:
-
Custom fonts
-
Slow, blocking (synchronous) requests
-
Calls to third-party scripts
Be cautious when adding tracking tags for analytics or ads. Tracking tags can really slow down perceived performance, especially if they're not set up right. Google Tag Manager can help make sure tracking tags are set up and maintained correctly. For more information, see Google Tag Manager.
To test how tracking tags affect performance, you can use your browser's developer tools to block requests to certain domains. For example, in Chrome, you can right-click a request in the Network tab and choose Block request domain - after you refresh, all attempts to reach that domain are blocked. If your site loads much faster after this, you've probably found an issue.
Item Search API
Almost all item data on your site is requested through the Item Search API. When a query is made, the NetSuite search service goes through your site's index, finds the right items, and then runs a database query to return those items. There's a performance cost when the query is processed and the data returned.
If you think there might be performance issues with the Item Search API, you can get the request URL (for example, in the Network tab of your browser's developer tools) and then add ssdebug=T as a parameter to the end of the URL. This parameter gives you additional JSON data at the bottom of the request, like:
-
searchrequest- provides an abstraction of the request that was processed -
sessioninfo- provides information about your site -
perftiming- provides details about how quickly the response was generated
The following example shows how this additional data is displayed:
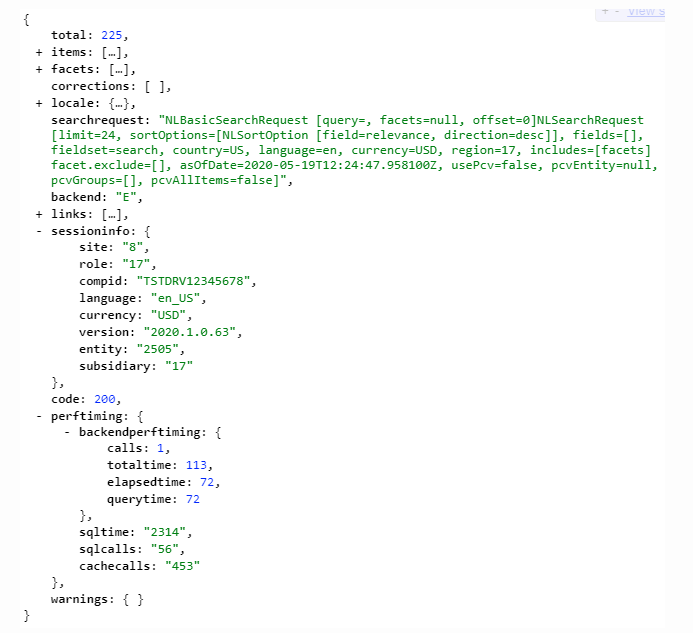
In the preceding example, you can see the perftiming:sqltiming value is 2314, which means the SQL query to the database took 2.314 seconds to complete. Figuring out if you should worry about this value can be tricky. But if it's much higher than in this example and is causing slowdowns, you might need to change the queries you're submitting.
If your searches are taking too long, it's usually because you're requesting too much data. Every field in a response adds overhead, so keep your fields and field sets to the minimum you need.
When working with field sets, keep these things in mind:
-
Where you're using them - Don't reuse field sets when you should make new ones for specific use cases. If you use an existing field set for something unique, you're more likely to request extra data you don't need, which can slow things down.
-
How you're using them - Don't create new fields if a system-generated one is available. For example, the
isinstockfield is lightweight and returns a boolean value, so there's no need to create your own field to show if items are in stock. Also, be sure to use default field sets.Default field sets cover a lot of use cases, so you should trim them down for your site. For example, if you use the default search field set for product list pages, follow best practices and pick only the needed fields. Don't add more fields, but use more suitable ones if necessary. Remember, search results and commerce category pages make the API pull a lot of data for each item, and the more items per page, the higher the performance cost.
For more information, see Field Set and Facet Field Performance.
Commerce Categories
Generating category data can be resource-intensive, so make sure you plan your commerce categories with performance in mind by following these guidelines:
-
Use current Commerce Categories functionality; don't use legacy SiteBuilder categories
-
Don't go deeper than three levels in your taxonomy
-
Try to assign each product to only one category
A lot of people think more categories are better, but ideally, it's the opposite. Categories should be organized and easy to navigate. If shoppers keep seeing the same products in different categories, they might get frustrated and shop somewhere else. Categories are meant to segment your catalog, and repetition undermines that.
For more information, see Commerce Categories.
Scriptable Cart
Scriptable cart scripts run on both Commerce websites and back office sales transactions, and they're often used for extra actions or to connect to third-party services. These actions are often blocking, which means the application has to wait for the script to finish before continuing. If the application is waiting, your users are waiting too.
You might run into performance issues with Scriptable Cart. For example, if your script listens for changes to line items in an order, you might notice performance issues when adding items to the cart. It's also common to see performance issues with the checkout wizard because of Scriptable Cart.
If you notice a performance issue, you can go to Customization > Scripting > Scripted Records > Sales Order to review all running scripts.
Sometimes, Scriptable Cart causes performance issues when a script runs on the website but only needs to run in the back office. If that's the case, you can go to its deployment record and toggle the All Roles and All Employees checkboxes:
-
If you check All Roles and uncheck All Employees, the script runs on the website.
-
If you uncheck All Roles and check All Employees, the script runs only in the backend.
This is a temporary workaround. Long-term, you need to refine your script to run more efficiently.
User Event Scripts
If you notice performance issues while placing an order, you might need to check your user event scripts and think about changing some of their settings.
-
There's an option called Execute in Commerce Context on a script's deployment record. This decides if the script runs on websites - if you turn it off and things improve, that's probably where your problem is.
-
There's also a feature called Asynchronous afterSubmit Sales Order Processing that might help performance if your script listens for the
afterSubmitevent. When you turn this feature on,afterSubmituser events are triggered asynchronously when a sales order is created during checkout, so the events run in the background. When anafterSubmituser event runs asynchronously, the next page loads while theafterSubmituser event is still processing.