Script Debugger Metering and Permissions
The debugger adheres to the following metering and permission restrictions for all SuiteScript 1.0, 2.0, and 2.1 script types:
-
You can only debug one script at a time. Attempting to debug multiple scripts simultaneously (for example, by opening two different browser windows) will result in the same script/debugging session appearing in both windows.
-
You can debug only your own scripts in their current login session.
-
There is a 1000 unit usage limit on all scripts being debugged. This is important to note, particularly for script types such as scheduled scripts, which are permitted 10,000 units when running in NetSuite. If, for example, you load a 2,000 unit scheduled script into the Debugger and attempt to step through or execute your code, the Debugger will throw a usage limit error when it reaches 1000 units.
-
Email error notification is disabled for scripts being debugged.
-
Execution log details are displayed on the Execution Log subtab in the Debugger rather than in the execution log on the Script Deployment page for all SuiteScript 1.0 and 2.0 scripts. For SuiteScript 2.1 scripts, execution log details are displayed on the Console tab of the Chrome DevTools debugging window.
Also see SuiteScript Governance and Limits for governance limits on script types and API modules.
Idle Timeouts
The SuiteScript Debugger and the 2.1 Script Debugger for all script types have idle timeouts. Your debug session will end if you stop interacting with the debugger, or if you have exceeded the maximum allowed amount for a debug session.
SuiteScript Debugger Timeouts
There is a two-minute time limit on SuiteScript 1.0 and 2.0 scripts sitting idle in the debugger. If you do not perform some user action in the debugger within the two minutes, the following error is thrown:
-
You have exceeded the maximum allowable idle time for debugging scripts. To debug another script, reload the script debugger page and start a new debugging session.
If you receive this message and you are debugging a deployed SuiteScript 1.0 or 2.0 script, click Go Back. You must then reload your script by clicking Debug Existing.
If you are debugging a SuiteScript 1.0 or 2.0 script in on-demand mode, click Go Back, click in the Debugger text area, and re-type (or copy and paste) your code snippet. See Debugging SuiteScript 1.0 and SuiteScript 2.0 Scripts for information about deployed and on-demand debugging modes for SuiteScript 1.0 and 2.0 scripts.
There is also a ten-minute global timeout on all scripts being debugged. This means that even if you are performing user actions within the debugger every two minutes, the debugger will still timeout after ten minutes.
SuiteScript 2.1 Debugger Timeouts
A timeout can occur in two ways when using the 2.1 Script Debugger:
-
There has been no user action within the debugger for 5-minutes (300 seconds). If you don't perform some user action in the debugger within five minutes, Chrome DevTools will disconnect and you will see this message:
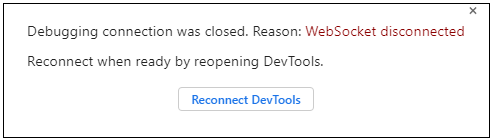
Clicking Reconnect DevTools doesn't resume your debug session. You must return to the Script Debugger tab and click the X button. Then click Switch To Editor and click Debug Script to start a new debug session. If you leave the Chrome DevTools tab open, it will be used for the new debugging session. If you close the Chrome DevTools tab, a new one will open when you start a new debugging session.
-
You have reached the overall time limit for a debugger session. This time limit is set using the IDLE_SESSION_TIMEOUT_IN_MINUTES general preference, which sets the maximum time for a 2.1 Script Debugger session, regardless of whether there is user action or not. You can set the IDLE_SESSION_TIMEOUT_IN_MINUTES by going to Setup > General Preferences. Although you can enter a value larger than 20 minutes, a 2.1 Script Debugger session is limited to a maximum of 20 minutes. Note that this preference also sets the timeout for a NetSuite user session (see Setting General Account Preferences).
There are several errors thrown when a 2.1 Script Debugger timeout occurs:
-
An error message 'You have exceeded the maximum allowable idle time for debugging scripts. To debug another script, reload the script debugger page and start a new debugging session' will be thrown.
-
DEBUGGER_SESSION_TIMEOUT error will be thrown if the timeout occurred based on the IDLE_SESSION_TIMEOUT_IN_MINUTES general preference value.
-
DEBUGGER_IDLE_TIMEOUT error will be thrown if there has been no user action for five minutes.
If any of these timeouts occur, you can return to the Script Debugger page and click the X button to stop debugging. You can then click Switch to Editor to reload the script and start a new debugging session.