Grant Management Dashboard
The Grant Management SuiteApp provides a visual workspace through a dashboard setup.
The following screenshot shows a portion of the Grant Management Dashboard:
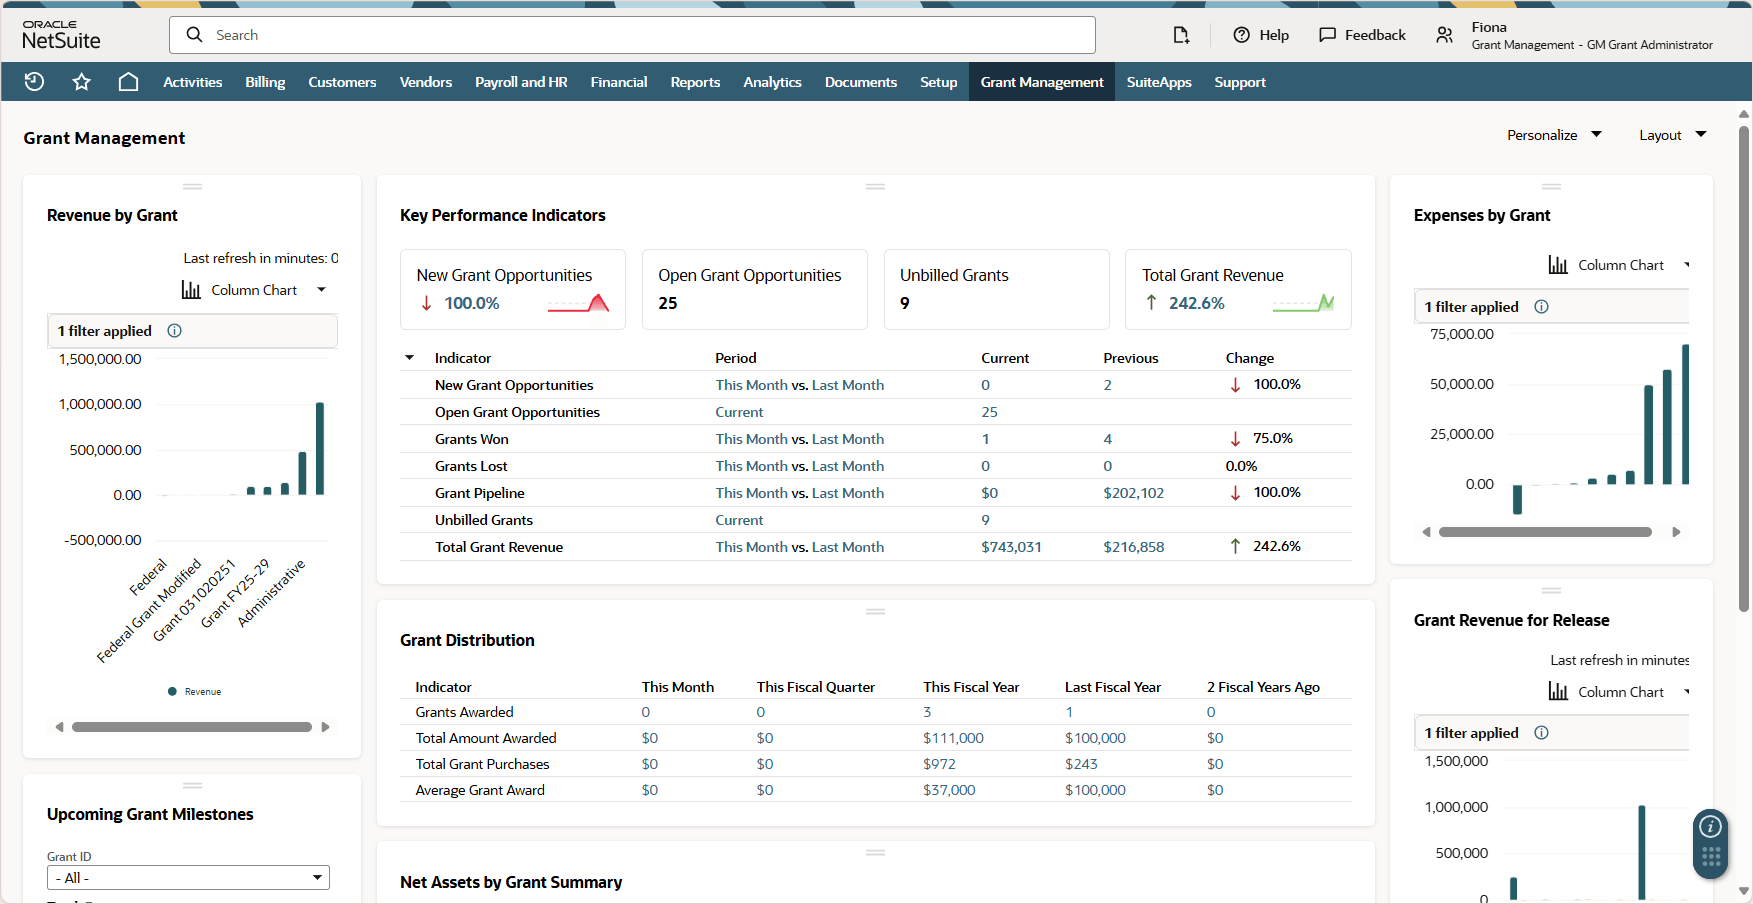
The dashboard displays the following:
Grant Management Key Performance Indicators Portlet
Key Performance Indicators (KPIs) portlet provide summaries of your grant management data right on your dashboard.
Each KPI compares data based on reports over different time ranges.
The Grant Management KPI portlet displays the following indicators by default:
|
KPI |
Description |
|---|---|
|
New Grant Opportunities |
This indicator shows the number of new opportunities that are recently added within the given time periods. Click this KPI's periods or totals to open the full search results. |
|
Open Grant Opportunities |
This indicator shows the number of open grant opportunities in the account regardless of timeline. Click this KPI's periods or totals to open the full search results. |
|
Grants Won |
This indicator shows the number of opportunities that were won in the given time periods. This count includes grant opportunities that have a status of Closed Won or Renewal. Click this KPI's periods or totals to open the full search results. |
|
Grants Lost |
This indicator shows the number of opportunities marked lost in the given time periods. This count includes grant opportunities that have a status of Closed Lost or Lost Customer. Click this KPI's periods or totals to open the full search results. |
|
Grant Pipeline |
This indicator shows the total value of open grant opportunities expected to close within the given time periods (this month and last month). Click this KPI's periods or totals to open the full search results. |
|
Unbilled Grants |
This indicator shows the total amount of sales orders that have not been billed yet. Click this KPI's period or total to open the full search results. |
|
Total Grant Revenue |
This indicator shows the total revenue received from Grants posted to income accounts for the given time periods (this month and last month.) Click this KPI's periods or totals to open the full search results. |
To customize the look and contents of the KPI portlet, see Setting Up the Key Performance Indicators Portlet. For more information about Key Performance Indicators in general, see Key Performance Indicators.
Other Grant Management Dashboard Portlets
Apart from the Key Performance Indicators portlet, the dashboard contains other portlets that help in managing grants.
The following table shows the other portlets in the dashboard:
|
Portlet Name |
Portlet Type |
Description |
|---|---|---|
|
Grant Distribution |
KPI Scorecard |
This portlet is based on the Grant Distribution KPI Scorecard and shows the comparative numbers of the following indicators within time periods:
|
|
Revenue by Grant |
Analytics |
This portlet is based on the Revenue by Grant tab from the Net Assets by Grant workbook. |
|
Expenses by Grant |
Analytics |
This portlet is based on the Expenses by Grant tab from the Net Assets by Grant workbook. |
|
Upcoming Grant Milestones |
Custom Search |
This portlet displays the results from the Upcoming Grant Milestones saved search. The results highlighted in orange marks the milestones that have deadlines that already lapsed. |
|
Net Assets by Grant Summary |
Analytics |
This portlet is based on the Net Assets by Grant Summary tab from the Net Assets by Grant Workbook. |
|
Grant Revenue for Release |
Analytics |
This portlet is based on the Grant Revenue for Release tab from the Grant Release from Restriction workbook. |
For more information about dashboard portlets in general, see Dashboard Portlets.