Monitoring Top SOAP Web Services Record Processing
The Top SOAP Web Services Record Processing portlet groups data points by record type. You can use this portlet to spot and fix issues in record processing.
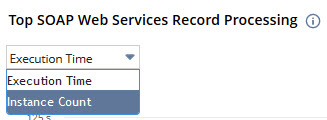
To change which data you see, click the dropdown arrow at the top left and pick either Execution Time or Instance Count. Each chart can display up to 10 record types.
Execution Time View
When you pick this view, it shows how long it took for operations in each record type to run their requests.
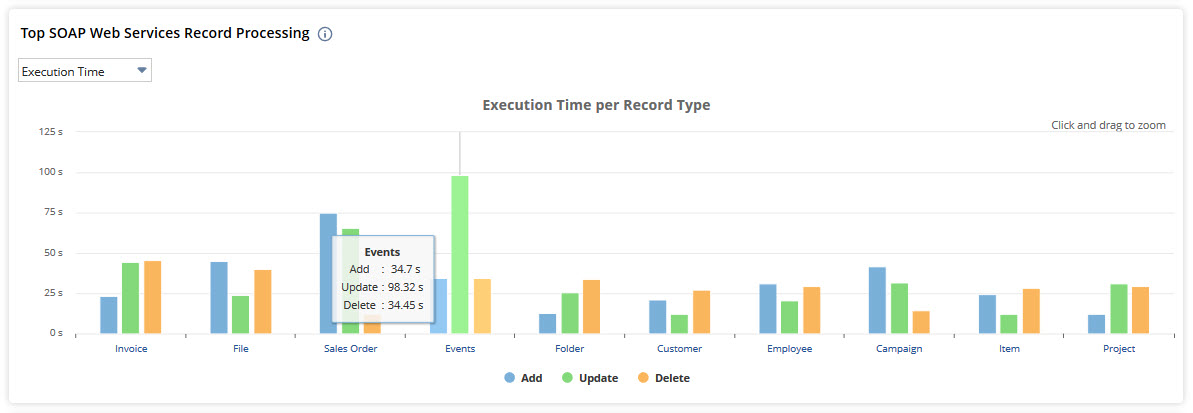
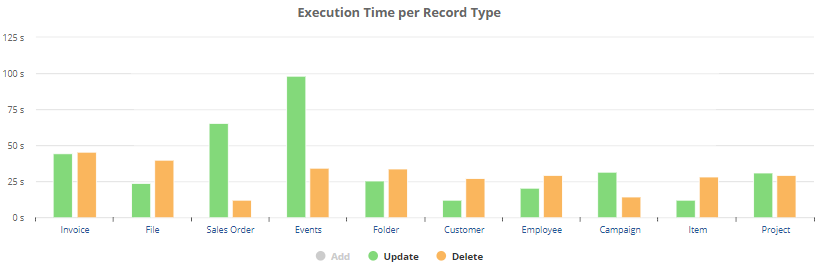
Click any operation in the legend to hide it from the chart.
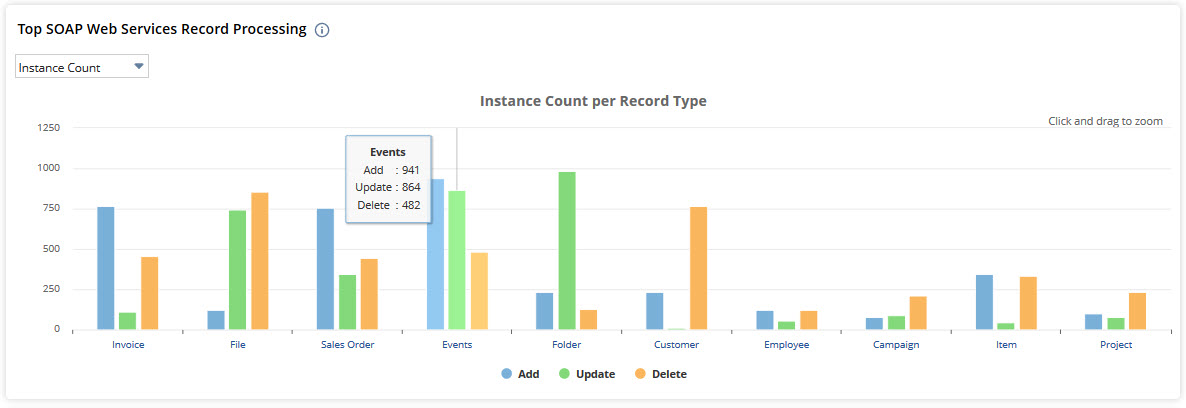
Instance Count View
If you choose this view, you'll see how many requests ran for each record type.
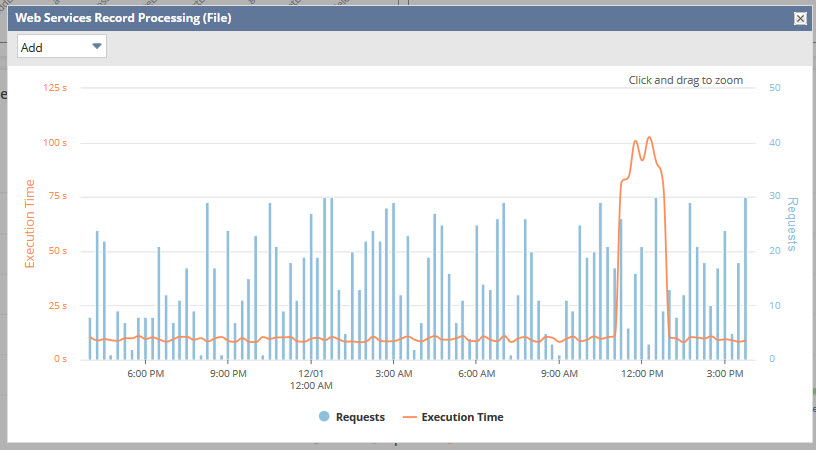
Web Services Record Processing
To learn more about a record type, click its name or bars in the chart. You'll see a pop-up chart with data about a web service operation for that record type at different times.
To see data for a specific operation, pick it from the dropdown arrow at the top left of the window.