Pivot-based Portlets
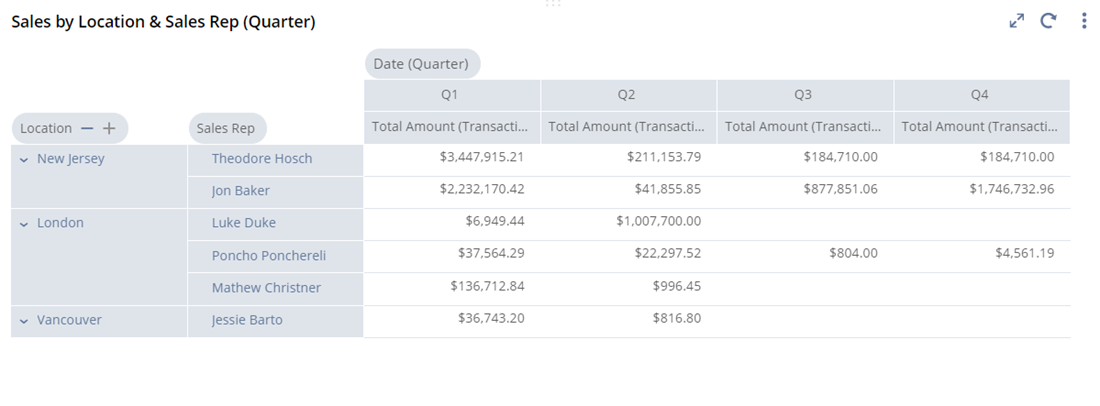
You can view your pivot-based workbook data on your home dashboard by adding the Analytics portlet. This lets you quickly see workbook data and jump right into your workbook. Having the data right on your dashboard means you'll spend more time learning from it and less time gathering it.
You can also pick how you want to see your pivot-based workbook by setting how many rows show at one time. You can give the Analytics portlet a custom title. By default, it shows the workbook and pivot table names. Conditional formatting from your pivot table also appears in the portlet.
For more information about adding and setting up the Analytics portlet, see Workbooks.