Viewing the Page Time Details Timeline
You can view the execution time of scripts and plug-ins on Page Time Details. For more information about the script and plug-in types that can appear on the timeline, see Script and Plug-in Types Supported in APM.
Page Time Details shows scripts and plug-ins that took a long time to run. They're helpful for troubleshooting issues. The page doesn't track every script or plug-in your account processes.
On the Page Time Details page, you can view a header that shows the following information about the page:
-
Operation ID
-
Page
-
Date and Time
-
Email Address
-
SuiteScript
-
Workflow
The header has a Profiler Details link that takes you there. For details, see Profiling Operations Performance.
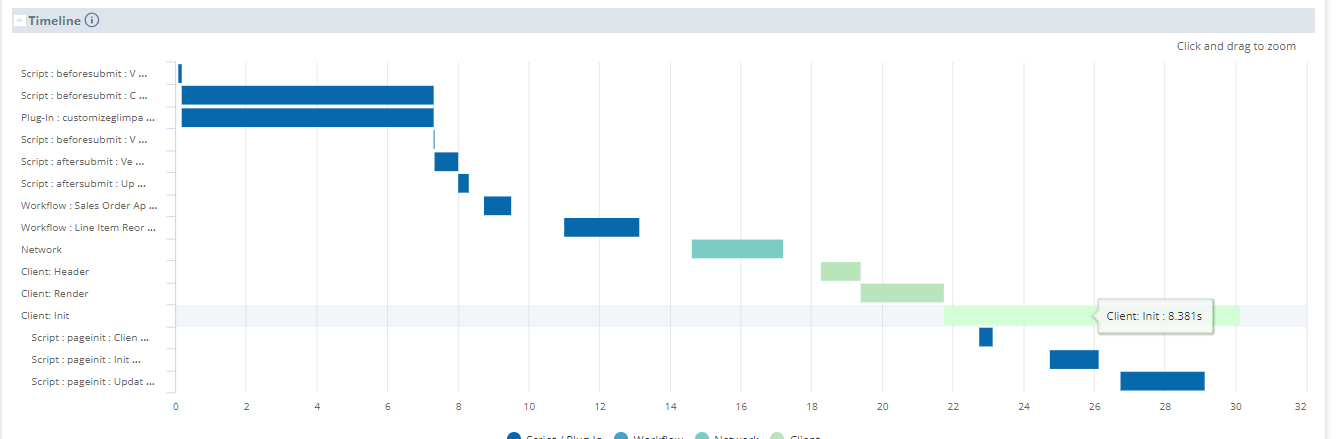
Page Time Details includes a timeline showing how long each record page takes to run. The time segments appear in order.
To view the execution time, place your cursor over a section of data on the timeline. In this example, the Client : Init function for the Calculate Discount script took the most time.
On the page details timeline, gaps between server components count toward NetSuite server time. For example, the screenshot shows a gap between Workflow Sales Order Approval and Line Item Reorder. This shows NetSuite server time, which might also include time for your customizations.
You can track the timing of the following client components on the timeline:
-
Client : Header - The time to render the page's head element. Most static assets like CSS and JavaScript load here.
Network delays can make client header times longer. To spot slow-loading assets, check your firewall and network. You can also speed things up by adjusting browser cache settings.
-
Client : Render - How long the browser takes to render after the head element, between Client : Header and Client : Page Init.
An old browser or low RAM/CPU can slow down rendering time.
-
Client : Init - The time client scripts take to run pageInit functions, including your custom scripts and standard operations. If pageInit calls other client scripts, their timing is included here.
PageInit functions run by client scripts are part of Client : Init. They're listed and indented under that line in Page Time Details.
To improve Client : Init time, review your client scripts for the page. Issues like third-party calls and script validations, plus outdated browsers or JavaScript engines, can slow things down.