On-Demand Debugging of SuiteScript 1.0 and SuiteScript 2.0 Scripts
On-demand debugging is used for testing SuiteScript 1.0 or 2.0 scripts or code samples that don't have a defined script deployment. On-demand debugging is not used for scripts that have a Script record or defined deployment parameters set on the Script Deployment page. For information about debugging deployed SuiteScript 1.0 and 2.0 scripts, see Debugging Deployed SuiteScript 1.0 and SuiteScript 2.0 Server Scripts.
To use the Script Debugger in on-demand mode:
-
Go to Customization > Scripting > Script Debugger.
Important:Any changes you make to your account when on this Debugger domain will affect the data in your production account. For example, if you execute a script in the Debugger that creates a new record, that record will appear in your production account.
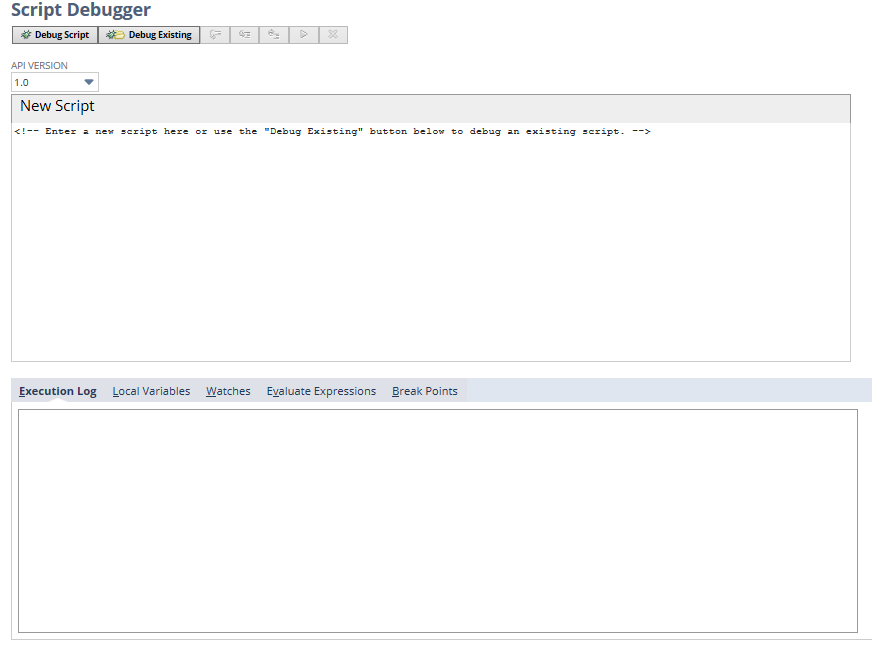
The following figure shows the Script Debugger page.

-
Select the API Version - 1.0 or 2.0. (If you want to debug a SuiteScript 2.1 script, see On-Demand Debugging of SuiteScript 2.1 Scripts).
-
Enter your code sample or script in the New Script text area. If your script is a 2.0 script and includes a
definestatement, you need to change that to arequirestatement to run the script in the debugger. For more information, see SuiteScript 2.x Global Objects.If you have written your code in an IDE, copy and paste the code into the New Script text area. If you modify your script in the debugger and you intend to save the changes, you must copy the updated script from the debugger and paste it into your IDE.
-
Click Debug Script.
The script is immediately loaded into the debugger and the program's execution stops before running the first line of executable code.
Important:Make sure you always have an executable call in your script; otherwise, the script has nothing to execute and return.
-
With the script loaded into the debugger, you can step through each line to inspect local variables and object properties. You can also add watches, evaluate expressions, and set break points. See Script Debugger Interface for information about stepping into/out of functions, adding watches, setting and removing break points, and evaluating expressions.
-
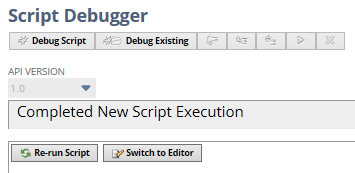
When execution of your script is complete, a Completed New Script Execution message appears. You can either re-run the script (by clicking Re-run Script), or place the script into edit mode (by clicking Switch to Editor) and continue debugging.

Script execution details are logged on the Execution Log subtab of the Script Debugger. You can also use the N/log Module within your script to access methods for logging script execution details for all scripts. See Using the Script Execution Log Subtab to learn how SuiteScript 1.0 and 2.0 script execution details are logged.