Debugging Deployed SuiteScript 1.0 and SuiteScript 2.0 Server Scripts
Deployed-mode debugging is for testing scripts or core plug-in implementations that have a defined Script Deployment or Core Plug-in Implementation record.
SuiteScript does not support read-only sublists. If you are debugging a script that loads a record with a custom child record as a sublist, make sure the Allow Child Record Editing setting is checked for the child record in Customization. If this box is not checked, the sublist is read-only and will not load in the parent record. See Creating Custom Record Types for additional information about creating custom records.
To use the Script Debugger in deployed mode:
-
Go to Customization > Scripting > Script Debugger.
Important:Any changes you make to your account when on this Debugger domain will affect the data in your production account. For example, if you execute a script in the Debugger that creates a new record, that record will appear in your production account.
-
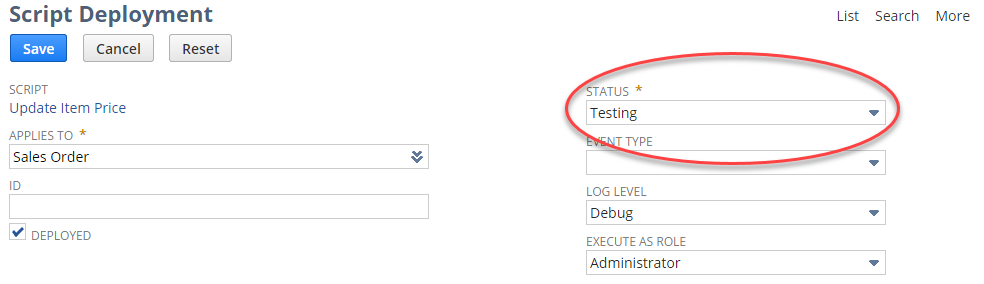
When you are on the Debugger domain, go to the applicable Script Deployment or Core Plug-in Implementation record and verify that Status is set to Testing. If you want to debug a script or core plug-in implementation that has been released into production, you must change the status from Released to Testing.
-
Verify you are the assigned owner of the script or core plug-in implementation. You can only debug a script or core plug-in implementation if you are the assigned owner.
-
To access the Script Debugger start page, use the appropriate option:
-
If you are on the Script Deployment page in View mode, click Debug.
-
If you are on the Script Deployment page in Edit mode, click Save and Debug.
-
If you are not on the Script Deployment page or you are debugging a core plug-in implementation, you can access the debugger by going to Customization > Scripting > Script Debugger.
-
-
On the Script Debugger page, select your API Version and then click Debug Existing. The list of scripts will be filtered based on the selected API version.
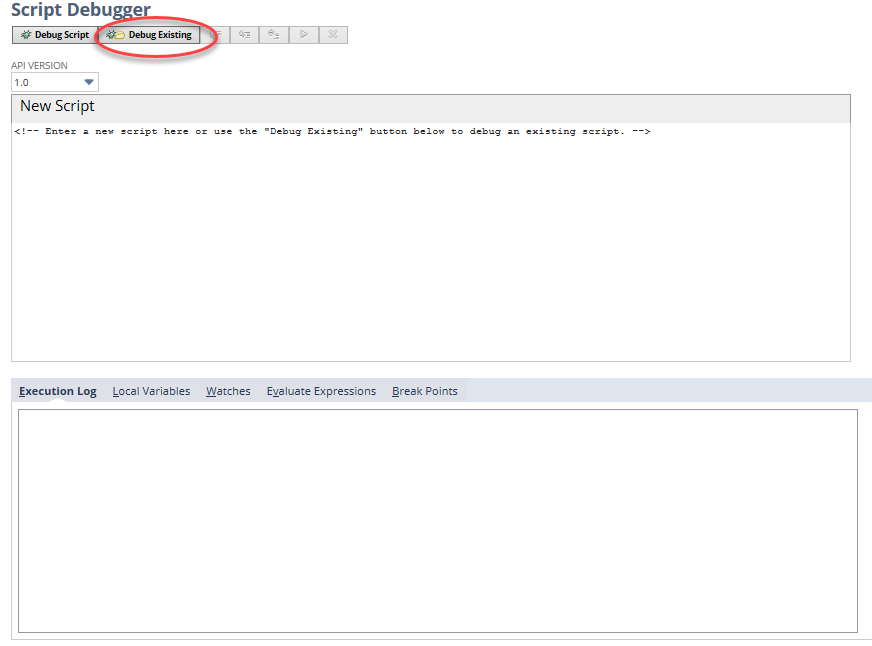
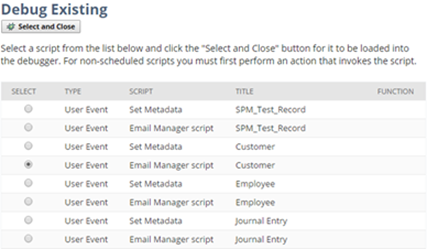
The Debug Existing popup window opens and shows all server scripts and core plug-in implementations available for debugging (see figure below) based on the selected API version. Note that only scripts and core plug-in implementations whose statuses are set to Testing are listed.
-
Select the script you want to debug and click Select and Close.
-
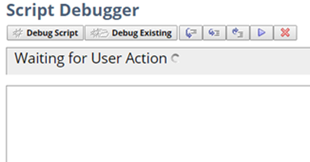
The Script Debugger page is updated with a Waiting for User Action status message. The debugger is waiting for you to perform the action that is associated with the selected script or plug-in implementation.
 Note:
Note:Adding or updating records using CSV import may not trigger the debugging of scripts because the CSV import may create or update records using a different user role or entity. Remember, that you can only debug scripts if you are the assigned owner.
Note:You do not need to perform any user actions to load scheduled scripts into the Debugger. Simply select your scheduled script from the Script Debugger popup window, and then click Save and Close. The scheduled script automatically loads.
-
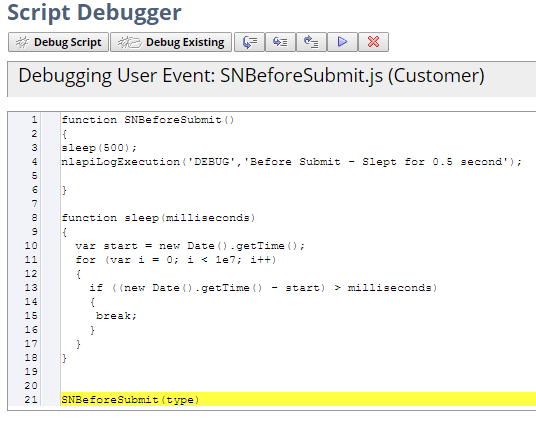
When the script is loaded into the debugger, it is shown on the Script Debugger page:
The Debugger does not caption the user action during bulk processing, but the script is executed and a log is created.
You should perform user actions in another window or another tab on your browser. This lets you keep the Script Debugger page open so that you can see the script or core plug-in implementation as it loads. To do this, right-click on the menu item (or other UI element) and select Open Link in New Tab or Open Link in New Window.
After the script is loaded into the Debugger, you can step through each line to inspect local variables and object properties. You can also add watches, evaluate expressions, and set break points. See Script Debugger Interface for details about stepping into/out of functions, adding watches, setting and removing break points, and evaluating expressions.
When a script finishes running in the Debugger, you can either re-run it (by clicking Re-run Script), or place it into edit mode (by clicking Switch to Editor) and continue debugging.
If you modify any script or core plug-in implementation in the SuiteScript Debugger and you intend to save the changes, you must copy the updated code from the Script Debugger page and paste it into your IDE (or other editor). You must then re-load the updated file back into the NetSuite File Cabinet.
Script execution details are logged on the Execution Log subtab of the Script Debugger. You can also use the N/log Module in your script to write log messages during script execution. See Using the Script Execution Log Subtab to learn how SuiteScript 1.0 and 2.0 script execution details are logged.