Monitoring REST Web Services Performance
REST Web Services Analysis uses the following portlets to help you monitor the performance of REST web services:
Overview Portlet
The Overview portlet shows summary stats and charts for REST-based web services that ran in your account.
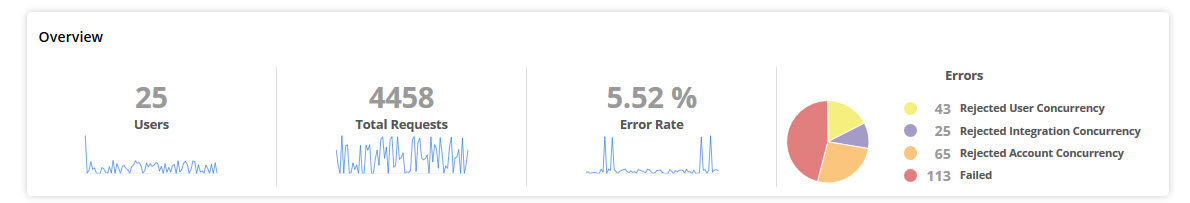
The portlet shows:
-
Users - The total number of users for these operations.
-
Total Requests - The total number of requests for these operations.
-
Error Rate - The percentage of requests that ended with errors.
-
Errors Pie Chart - Shows how errors are spread across the operations.
Top REST Web Services Operations Portlet
The Top REST Web Services Operations portlet shows info about the top five operations in separate tiles.
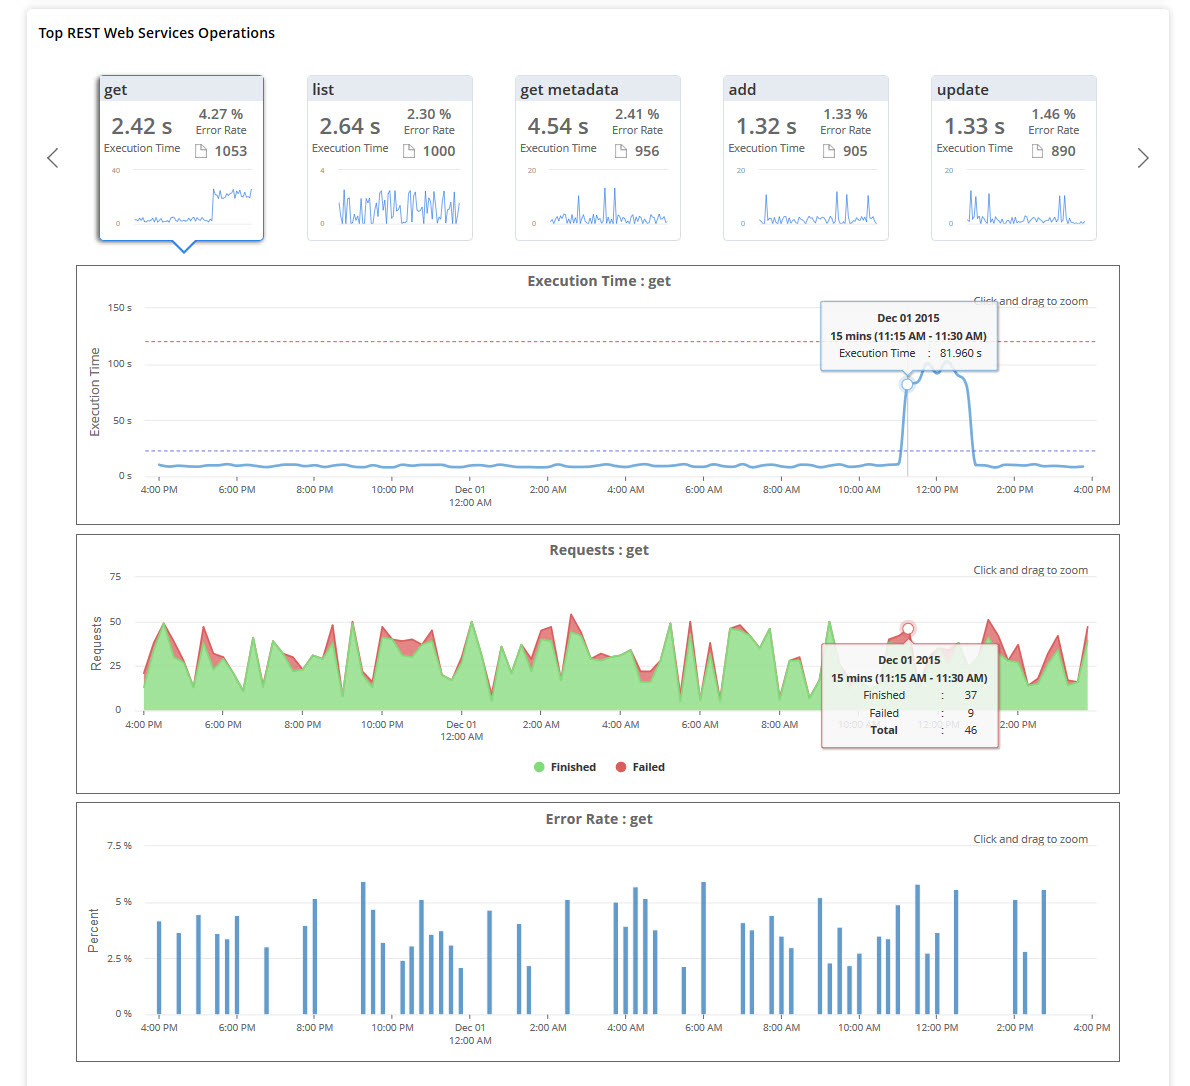
Each tile shows:
-
Execution Time - How long it took to process the operation.
-
Error Rate - The percentage of requests that had errors.
-
Total Requests Icon - The total number of requests for the operation.
-
Execution Time Chart - A small chart showing execution times for this operation over time.
To see more details and charts for an operation, click its tile.
You'll see these charts:
-
Execution Time - How long each request took for this operation over time.
-
Requests - The number of requests this operation ran over time.
-
Error Rate - The percentage of errors this operation had over time.
Click any data point in a chart to open the related Web Services Operation Logs table. For more, see Viewing REST Web Services Logs.