Budget vs. Actuals by WBS Portlet
The Budget vs. Actuals by WBS in Project 360 Dashboard shows a visual comparison of the estimated costs of the project to the expenditures of completing the project.
The data comparison lets you analyze if your costs and billings are within the budget or will exceed the projected costs as the project progresses.
The following screenshot shows the Budget vs. Actuals by WBS portlet with a graph of the budget lines and the corresponding cost:
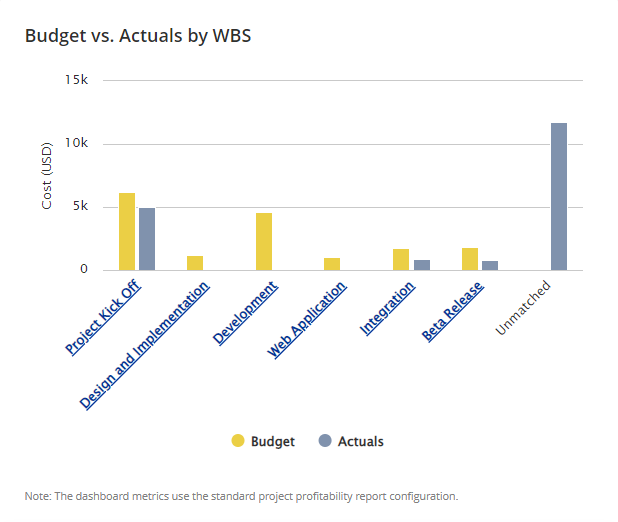
The portlet sources the budget data from the baseline budget of the WBS while the costs for Actuals are sourced from the transactions included in the profitability report.
Budget lines are shown on the x-axis while the range of costs are on the y-axis. When you hover over the individual graphs, the corresponding value for Budget or Actuals is shown.
The graphs for Actuals are shown only if transactions are associated to the budget line. An unmatched Actuals can also appear on the graph if the project task or activity code is missing from the transaction record. See Mapping Actuals to the Work Breakdown Structure.
If you create a hierarchy for a budget line by adding sublines, you can see each subline's value by clicking the budget line name from the x-axis.
If you add sublines when there are existing Actuals data on the graph, you must recalculate the values on the Profitability Report page to view the link on the main budget line. Clicking the main budget line link lets you view the cost that corresponds to the subline.
You can also zoom in on the graph by doing a click and drag using your cursor. To return to the previous view, click the Reset zoom button on the upper right side of the graph.