Setting Up and Navigating the Resource Allocation Grid
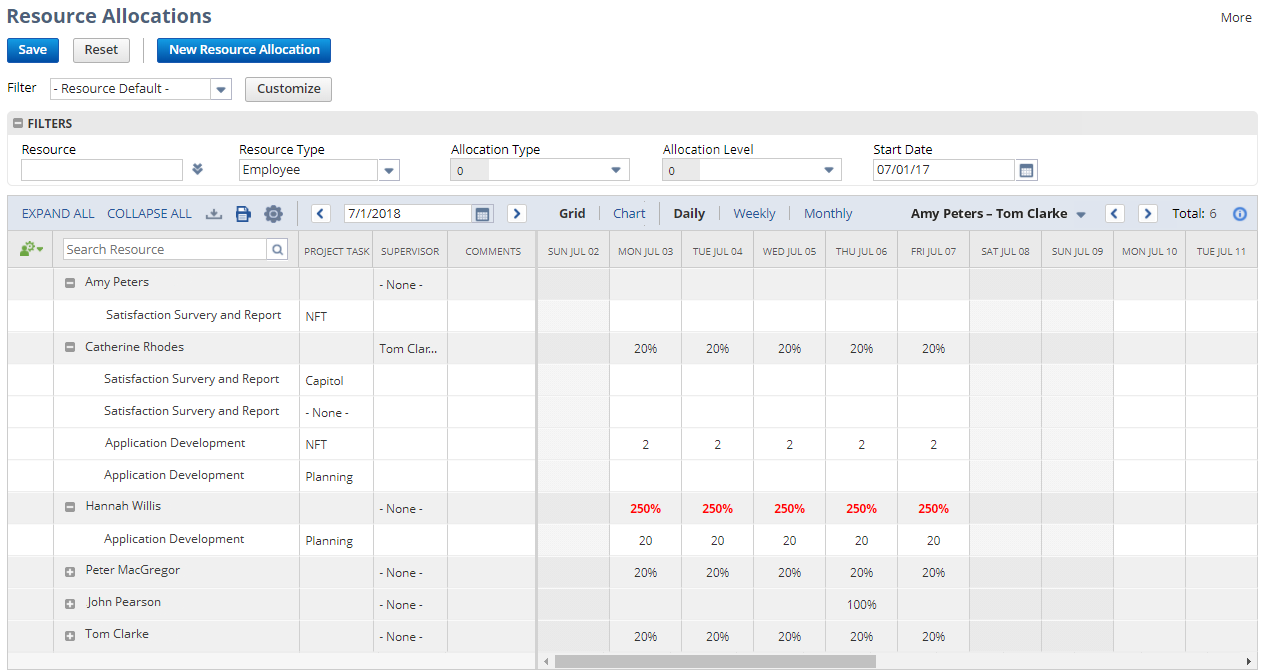
The Resource Allocation Grid offers visual management of your resource allocations in a grid format. You can edit existing allocations and create new allocations directly from the grid.
To view the grid, administrators can go to Lists > Services > Resource Allocation Chart/Grid and click Grid in the Resource Allocations page. For more information about where you can find the grid with other roles, see Navigation Path for Resource Allocation Chart/Grid.
Navigating the Resource Allocation Grid
For each resource, a summary row shows the total percentage of allocated time within each column. You can choose to view the grid by day, week, or month. The calculations are color coded so you can easily tell when a resource is overbooked. The grid considers each resource's work schedule with non-working dates (weekends, for example).
Scheduled time off doesn't show up in the Resource Allocation Grid.
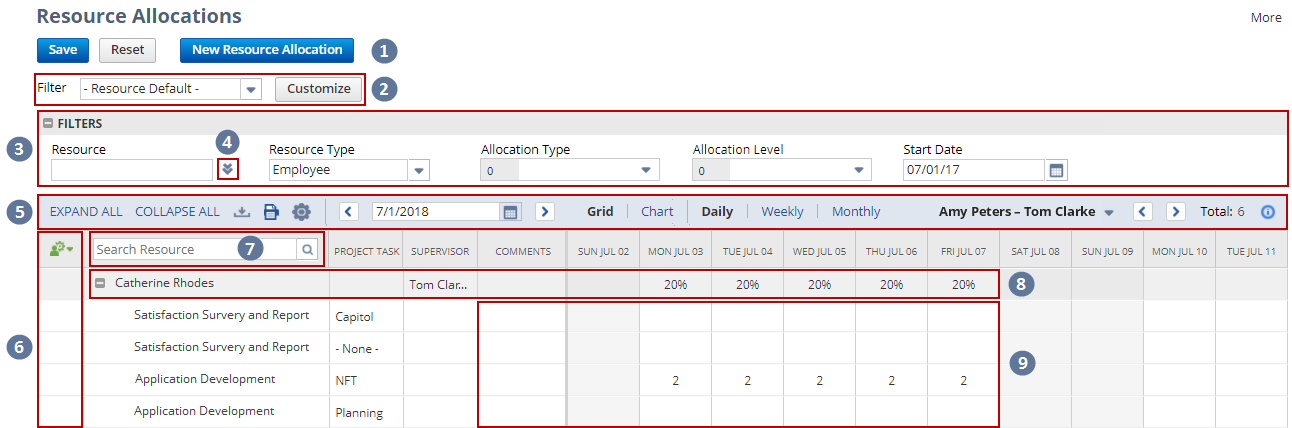
Refer to the following image and table to know more about the different parts of the Resource Allocation Grid.
|
|
Page Element |
Description |
|---|---|---|
|
1 |
New Resource Allocation |
Click this button to create a new allocation. For more information, see Creating a New Allocation from the Resource Allocation Chart or Grid. |
|
2 |
Default and Custom Filters |
Select default or custom filter to set the grid view and the fields that will appear in the filter panel. You can select from existing filters or create your own custom filter. For more information, see Using Default Filters to Change the Chart or Grid View and Customizing Resource Allocation Chart/Grid Filters. |
|
3 |
Filter Panel |
Set the values for each filter to customize the information you see on the Resource Allocation Grid. You can select multiple values for some filters. The number on the left of the filter field indicates how many values have been selected for the specific filter. Click the X icon next to this number to clear all selected values for the filter.
Note:
You can select only 1 value for the Resource Type filter. You can leave the field blank to include all three values in the Resource Type filter.
Note:
If you don't set a value for the Start Date field on the default filters, the system will automatically set it to the current date. The start date is displayed in the format specified on the Set Preferences page. |
|
4 |
Large Data Component Dropdown |
Clicking the double arrow The icon appears if there are more entries than your Maximum Entries in Dropdowns preference. To set the limit, go to Home > Set Preferences > General.
Note:
You can't type in dropdown fields with the double arrow icon |
|
5 |
Resource Allocation Menu |
|
|
6 |
Grid Action Menu |
You can access additional options by clicking the green
|
|
7 |
Search |
|
|
8 |
Summary Row |
The summary row displays the following information:
|
|
9 |
Editable Cells and Grid Context Menu |
Hover your cursor over the cell to view details about that allocation. Click the cell to edit the resource's allocation. Right click the cell to access the grid context menu. For more information, see Cell Values.
Note:
You can't edit or create new allocations for generic resources assigned to project templates from the Resource Allocation Grid.
Important:
You must click Save at the top of the page before you exit the Resource Allocation Chart/Grid. If you don't click Save, any changes you make while working with the grid won't be saved. |
 icon opens a popup window where you can select values for the dropdown fields. The data in these fields are retrieved only when you click the icon, so that the grid can load faster.
 - Click to download the data on the Resource Allocation Grid and save it as a PDF, CSV, or Excel file. Hold your cursor over the icon to see download options.
 - Click to print the data on the Resource Allocation Grid.
 - Hover your cursor over this icon to display brief information about the resource allocation chart or grid.
 icon that appears when you hover your cursor over a cell. You can also click the other cells in this column to show more options. The following options are available through the action menu:
Adjusting Resource Allocation Grid Settings
Before you begin using the grid, you can adjust the grid's appearance and available filters.
To adjust the grid settings:
-
Click the Settings icon
 at the top of the resource allocation grid.
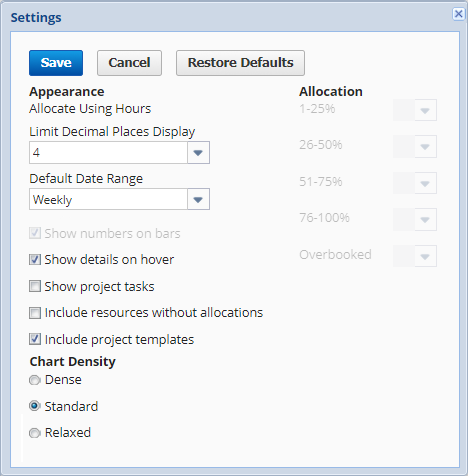 Note:
Note:Not all settings are available when using the Resource Allocation Grid.
-
Adjust the following settings as necessary:
-
Limit Decimal Places Display - Choose the maximum number of decimal places to display in the grid. You can select a number from zero to four. When you choose to limit decimal places, the number displayed will be rounded up or down to the selected number of decimal places.
-
Default Date Range - Select the default date range that will be displayed when you load the Resource Allocation Grid.
-
Show details on hover - Check this box to see allocation details when you hover your cursor over an allocation on the grid.
-
Show project tasks - Check this tbox o show project tasks for task-level allocations. Enabling this feature adds a Project Task column to the grid.
Note:This setting isn't available when you're viewing allocations by project or customer.
-
Include resources without allocations - Check this box to show active resources that don't have any current allocations.
Note:This setting isn't available when you're viewing allocations by project or customer.
-
Include project templates - Check this box to view project templates with resource allocations on the grid. When enabled, project templates will also be available in the Project dropdown on the filter panel.
Note:You can allocate a generic resource to a project template from the Project Template record. On the Project Template record, go to Resources > Resource Allocations, and then click New Resource Allocation. For more information, see Project Templates.
-
Show rejected allocations - If you also use Approval Routing for resource allocations, check the box to add values of rejected allocations to the grid.
-
-
When you're done, click Save.
After you've updated your settings, you can begin using the grid to work with your resource allocations. For more information, see Using the Resource Allocation Chart/Grid.
Cell Values
You can update single allocations by clicking the cell you want to update and changing the values directly in the grid. The hours displayed are calculated based on how you choose to view the grid.
Editing options for recurring allocations aren't available in grid view.
-
Daily: Total Hours Allocated for the Given Day
-
Weekly: (Total Allocated Work Hours / Total Working Days) * Number of Work Days in the Week
-
Monthly: (Total Allocated Work Hours / Total Working Days) * Number of Work Days in the Month
If you enter the same value in adjacent cells, NetSuite merges them into one record if the allocation percent is the same across the entire time frame. For example, entering 20 hours in two weeks creates a single allocation for 40 hours if the percent is the same. Different values create separate records.
When using the weekly or monthly views, multiple allocations are rolled-up, and the values are displayed as a link. To edit these rolled-up values, hold down the Ctrl key and click the link. The grid automatically switches from monthly to weekly or weekly to daily, so you can edit the individual allocations directly in the grid cells. After saving your edits, changes are allocated equally over the number of working days or weeks in the edited allocation.
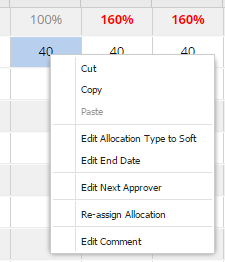
You can also right-click the grid cells to access the grid context menu, where you can choose from more options to edit the values.
You can update the Project Notes field on allocation records by typing directly in the Comments field.
You can switch between the grid and chart without losing any information. You don't need to save your changes made on the grid before switching to the chart.