Setting Up and Navigating the Resource Allocation Chart
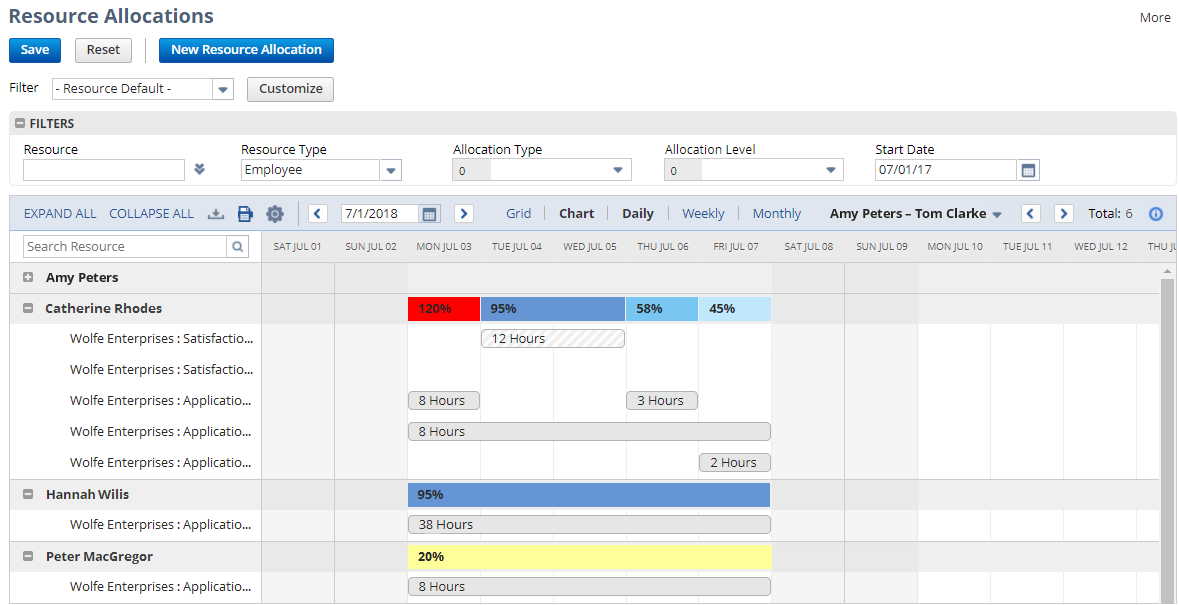
The Resource Allocation Chart lets you visually manage your resource allocations, giving you the ability to edit existing allocations and create new allocations directly from the chart. To see the chart view, administrators can go to Lists > Services > Resource Allocation Chart/Grid and click Chart under Resource Allocations. For more information about where to find the chart with other roles, see Resource Allocation Chart/Grid SuiteApp.
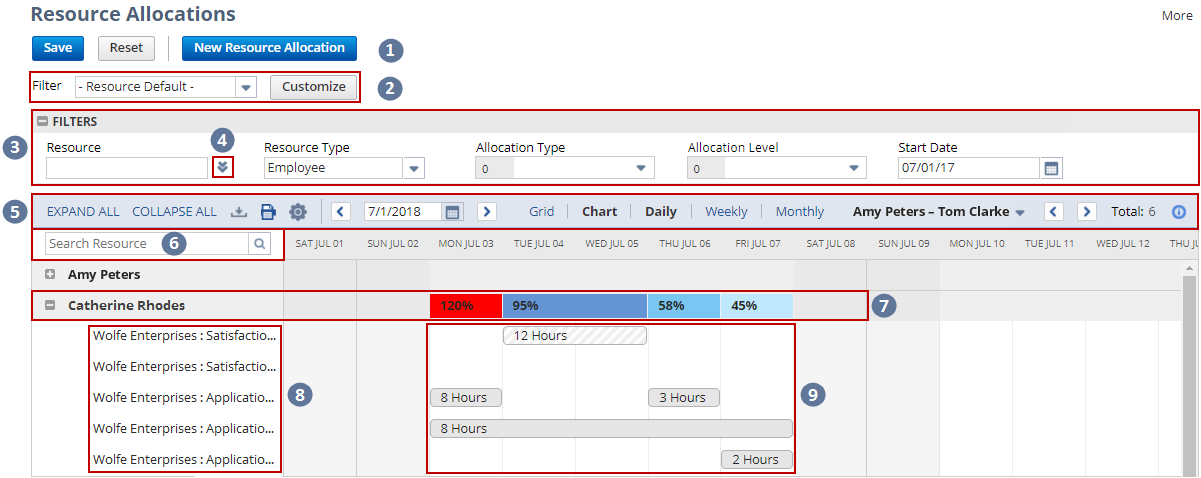
Refer to the following image and table to know more about the different parts of the Resource Allocation Chart:
Navigating the Resource Allocation Chart
For each resource, a summary bar shows the total percentage of allocated time within each column. The bars are color coded so you can easily tell when a resource is overbooked. Each color is explained in the Legend at the top of the chart. The chart considers each resource's work schedule with non-working dates (weekends, for example) which are indicated by a cross-hatched gray pattern. Individual allocation bars are also coded by allocation type.
Scheduled time off isn't displayed in the Resource Allocation Chart.
Refer to the following image and table to know more about the different parts of the Resource Allocation Chart.
|
|
Page Element |
Description |
|---|---|---|
|
1 |
New Resource Allocation |
Click this button to create a new allocation. For more information, see Creating a New Allocation from the Resource Allocation Chart or Grid. |
|
2 |
Default and Custom Filters |
Select a default or custom filter to set the grid view and fields that will appear in the filter panel. You can select from existing filters or create your own custom filter. For more information, see Using Default Filters to Change the Chart or Grid View and Customizing Resource Allocation Chart/Grid Filters. |
|
3 |
Filter Panel |
Set the values for each filter to customize the information you see on the Resource Allocation Chart. You can select multiple values for some filters. The number on the left of the filter field indicates how many values have been selected for the specific filter. Click the X icon next to this number to clear all selected values for the filter.
Note:
You can select only 1 value for the Resource Type filter. You can leave the field blank to include all three values in the Resource Type filter.
Note:
If you don't set a value for the Start Date field on the default filters, the system will automatically set it to the current date. The start date is displayed in the format specified on the Set Preferences page. |
|
4 |
Large Data Component Dropdown |
Clicking the double arrow The icon appears if there are more entries than your Maximum Entries in Dropdowns preference. To set the limit, go to Home > Set Preferences > General.
Note:
You can't type in dropdown fields with the double arrow icon |
|
5 |
Resource Allocation Menu |
|
|
6 |
Search Resource Field |
Enter a name in the field and click the search icon to filter the chart for that resource. To go back to your original view, clear the Search Resource field and click the Search icon. |
|
7 |
Summary Bar |
The summary row displays the following information:
|
|
8 |
Project Details |
Shows information about the project currently assigned to the resource. The project details pane displays the customer first, followed by the project name, and then the project task. Hover your cursor over the project to view a popup listing additional details about the project or project task. You can also click the project to open a popup that lets you reassign the resource for the chosen allocation.
Important:
When in chart mode, only the project name is displayed for each allocation. To view both the project name and customer name, you must enable Auto-Generated Numbers for projects. For more information, see Set Auto-Generated Numbers. |
|
9 |
Allocation Bar |
Hover your cursor over the allocation bars to view details about that allocation. Click the bar to edit the resource's allocation or drag and drop the bar to reassign the allocation to a different resource. You can also adjust the start or end dates by stretching or shortening the allocation bar. For more information, see Allocation Bars. |
 icon opens a popup window where you can select values for the dropdown fields. The data in these fields are retrieved only when you click the icon, so that the chart can load faster.
 - Click to download the data on the Resource Allocation Chart and save it as a PDF, CSV, or Excel file. Hold your cursor over the icon to see download options.
 - Click to print the data on the Resource Allocation Chart.
 - Hover your cursor over this icon to display brief information about the resource allocation chart or grid.
Adjusting Resource Allocation Chart Settings
Before you begin using the chart, you can adjust the chart's appearance and available filters.
To adjust the chart settings:
-
Click the Settings icon
 at the top of the resource allocation chart.
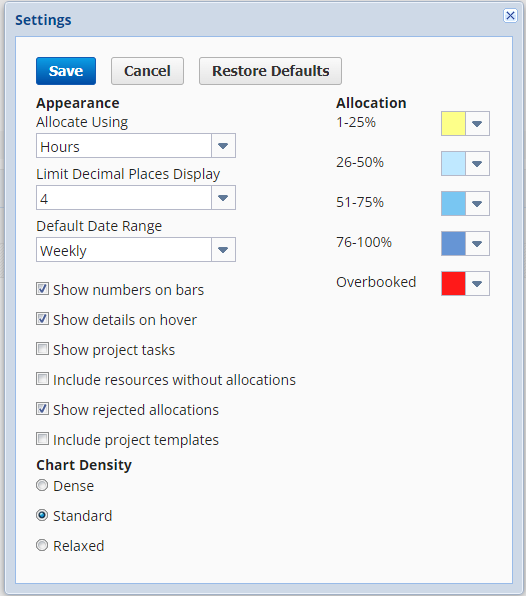
-
Adjust the following settings as necessary:
-
Allocate Using - Select Percentage or Hours to determine how allocations are displayed in the chart.
Note:When switching between Percentage and Hours, you must refresh the chart after saving your preferences for your changes to take effect.
-
Limit Decimal Places Display - Choose the maximum number of decimal places to display in the chart. You can select a number from zero to four. When you choose to limit decimal places, the number displayed will be rounded up or down to the selected number of decimal places.
-
Default Date Range - Select the date range that will be displayed by default when you load the Resource Allocation Chart.
-
Include project templates - Check this box to view project templates with resource allocations on the chart. When enabled, project templates will also be available in the Project dropdown on the filter panel.
Note:You can allocate a generic resource to a project template from the Project Template record. On the Project Template record, go to Resources > Resource Allocations, and then click New Resource Allocation. For more information, see Project Templates.
-
Show numbers on bars - Check this box to list the allocation values within the bars on the chart.
-
Show details on hover - Check this box to show the allocation details when you hover your cursor over an allocation bar.
-
Show project tasks - Check this box to show the allocations made directly to project tasks.
Note:This setting isn't available when you're viewing allocations by project or customer.
-
Include resources without allocations - Check this box to show active resources that don't have any current allocations.
Note:This setting isn't available when you're viewing allocations by project or customer.
-
Show rejected allocations - If you also use Approval Routing for resource allocations, check this box to add values of rejected allocations to the chart.
-
Chart Density - Select how compact you want your chart to appear.
-
Allocation - Customize colors to define the different allocation ranges.
Note:When you're viewing allocations by Customer or Project, color settings for the allocation bars won't be applied to the chart. The allocation bars will be displayed in white.
-
-
When you're done, click Save.
After you've updated your settings, you can begin using the chart to work with your resource allocations. For more information, see Using the Resource Allocation Chart/Grid.
Allocation Bars
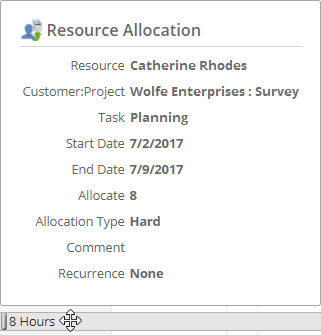
Within the Resource Allocation Chart, you can hover your cursor over an allocation bar to see details about that allocation.
You can drag and drop the bar to reassign the allocation to a different resource. When moving the bar, a small green check icon appears if the allocation can be reassigned to the current location. If the allocation can't be reassigned to the current location, a small red prohibited sign appears.
You can't reassign an allocation through drag and drop if it overlaps with another assignment, or if the start and end dates fall on non-working days. Collapsed allocations can't be reassigned with drag and drop.
You can adjust the selected dates for the allocation by stretching or shortening the allocation bar. You can also click the allocation bar to open the Edit Resource Allocation window, where you can modify the allocation details.
You can't edit or create new allocations for generic resources assigned to project templates from the Resource Allocation Chart.
Any changes made to allocations on the chart don't need to be saved before switching to the grid. You can switch between the chart and grid without losing any information. You must however, click Save at the top of the page before you exit the Resource Allocation Chart/Grid. Otherwise, any changes you make while working with the Chart or Grid will not be saved.
For more information about creating resource allocations, see Creating a Resource Allocation Record.