Highlighting KPI Scorecard Results
You can set up highlighting of KPI scorecard results when you're creating a new scorecard or editing an existing scorecard. Highlighting makes results more visible in the KPI Scorecard portlet.
-
To create a new KPI scorecard, go to Customization > Centers and Tabs > KPI Scorecards > New. For more information, see Creating a KPI Scorecard, and Entering Basic Scorecard Information.
-
To edit an existing KPI scorecard, go to Customization > Centers and Tabs > KPI Scorecards and click Edit next to the KPI scorecard you want to edit.
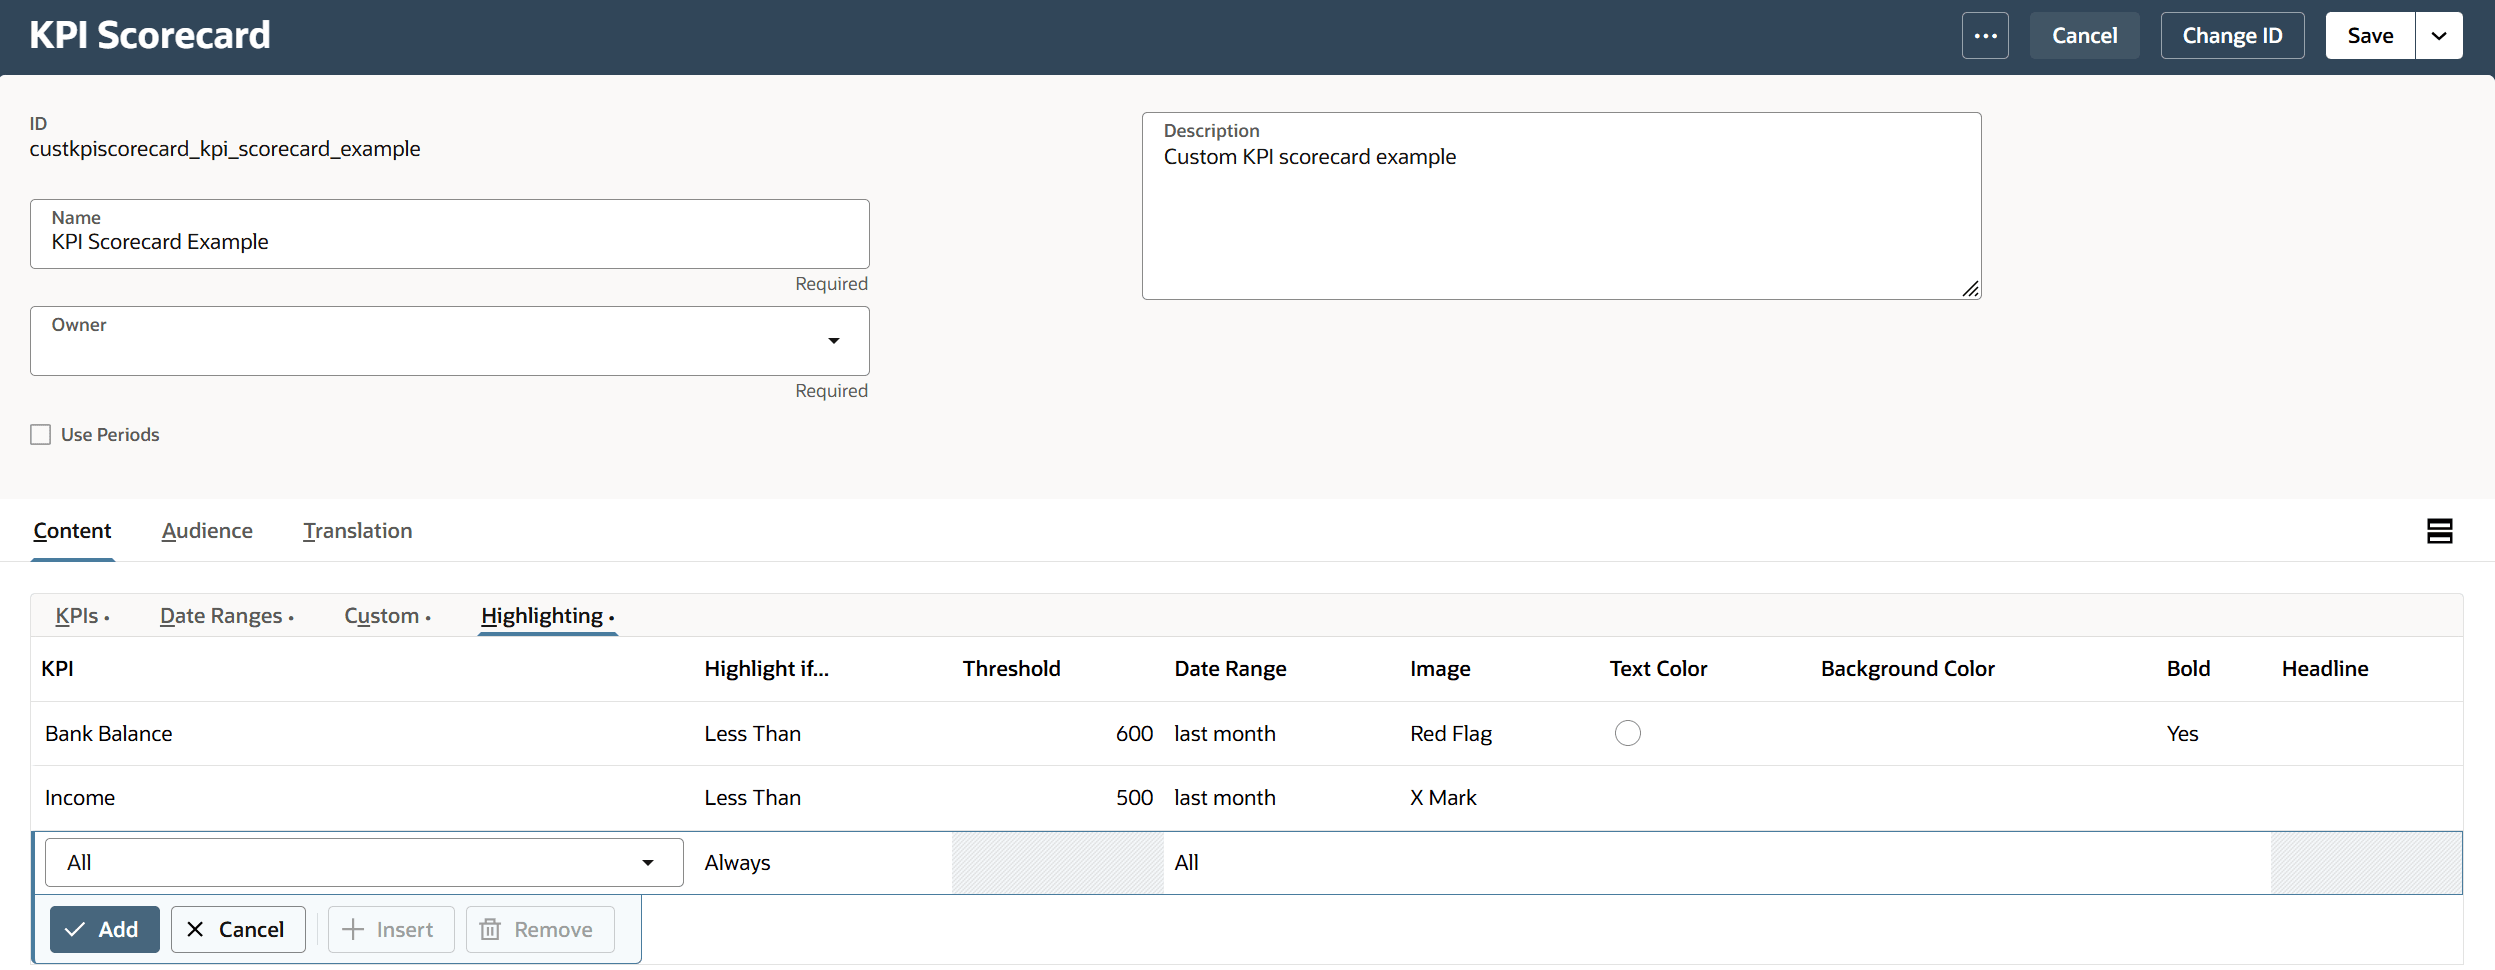
To set highlighting options for a result in a KPI scorecard:
-
Select a KPI from the dropdown list.
-
Select an option in the Highlight If... column, to indicate how the result should be compared to the Threshold value. The following options are available:
-
Always
-
Less Than
-
Greater Than
-
Magnitude Greater Than
-
Magnitude Less Than
-
-
Enter a Threshold value.
-
Select the Date Range or Period to determine whether highlighting should be applied when the comparison with the threshold is performed. The available options include All and the date ranges or periods set on the Date Ranges or Periods subtab.
-
You can use any of the following options to specify the highlighting to be applied to the results that exceed or fall short of the specified Threshold value.
-
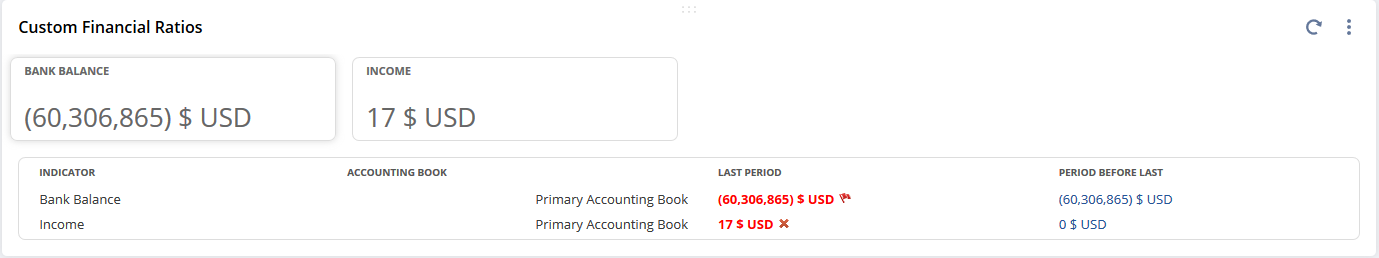
Use the Image column to select an image to be displayed with the highlighted result in the KPI scorecard portlet.
-
Use the Text Color column to select a text color other than the default for the highlighted result.
-
Use the Background Color column to select a background color other than the default for the highlighted result.
-
Check the box in the Bold column to display the highlighted result in bold text.
-
Check the box in the Headline column to display the highlighted result as a headline, in large bold text at the top of the KPI Scorecard portlet.
Note:Up to four scorecard results can be displayed as headlines.
-
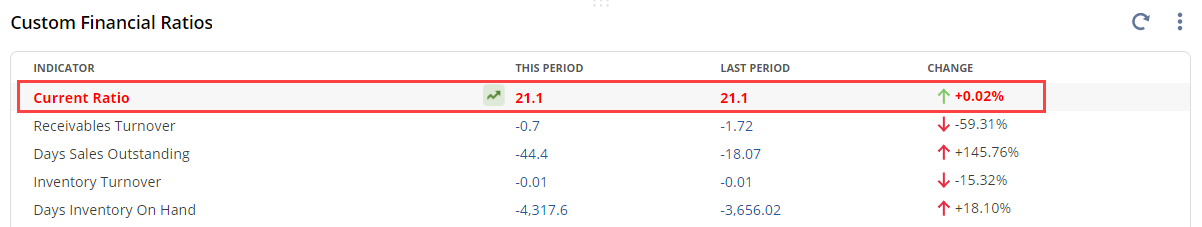
You can see the results in your KPI Scorecard portlet: