Introduction
This tutorial shows you how to leverage KPIs in Financials by using out-of-the-box KPIs or adding your own. The sections build on each other and should be completed sequentially.
Background
Key Performance Indicators (KPIs) also known as metrics and measures, enable you to collect objective, quantifiable data or data that indicates progress toward a performance or strategy target. High-level KPIs may focus on the overall performance of the organization, while low-level KPIs may focus on processes within departments such as sales, marketing, HR, support and so on.
You can use KPIs to reflect the health of key areas (perspectives), in your organization. For example, a KPI that tracks the return on assets for an organization in the banking industry provides financial data and should be associated with the financial perspective.
With out-of-the-box KPIs, accounts, and drivers, Financials accelerates your planning process. You can also define custom drivers and KPIs and bring in your own chart of accounts in Financials.
Prerequisites
Cloud EPM Hands-on Tutorials may require you to import a snapshot into your Cloud EPM Enterprise Service instance. Before you can import a tutorial snapshot, you must request another Cloud EPM Enterprise Service instance or remove your current application and business process. The tutorial snapshot will not import over your existing application or business process, nor will it automatically replace or restore the application or business process you are currently working with.
Before starting this tutorial, you must:
- Have Service Administrator access to a Cloud EPM Enterprise Service instance.
- Upload and import the snapshot Financials_KPIs.zip into your Planning instance.
- Save Revenue_Data FY24_FY25_FY26.csv locally. You will be importing data using this load file.
Note:
If you run into migration errors importing the snapshot, re-run the migration excluding the HSS-Shared Services component, as well as the Security and User Preferences artifacts in the Core component. For more information on uploading and importing snapshots, refer to the Administering Migration for Oracle Enterprise Performance Management Cloud documentation.Key Performance Indicators in Financials
Here are the predefined KPIs when you enable parent key members:
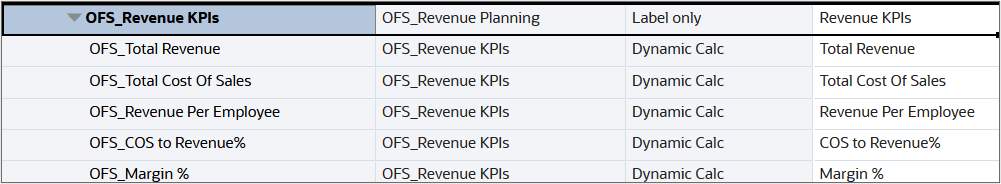
Revenue KPIs
| KPI | Description |
|---|---|
| OFS_Total Revenue | Parent key member used to depict total results for revenue |
| OFS_Total Cost of Sales | Parent key member used to depict total results for cost of sales |
| OFS_Revenue Per Employee | Calculates based on the total revenue divided by the current number of employees |
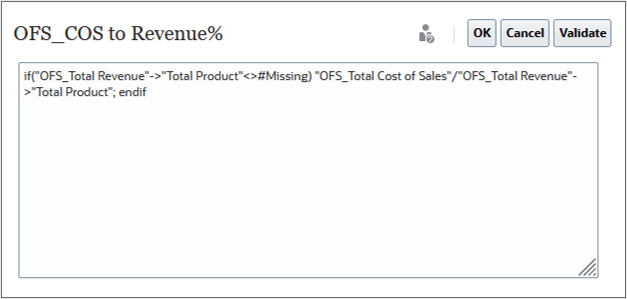
| OFS_COS to Revenue% | Calculates the percentage of cost of sales to total revenue |
| OFS_Margin % | Calculates margin % by dividing gross profit by total revenue |
Expense KPIs
| KPI | Description |
|---|---|
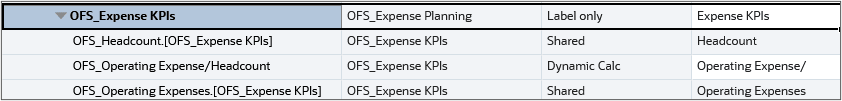
| OFS_Headcount | Number of current employees |
| OFS_Operating Expense / Headcount | Calculates based on operating expenses divided by the current number of employees |
| OFS_Operating Expenses | Parent member used to depict the total operating expenses |
Income Statement
| KPI | Description |
|---|---|
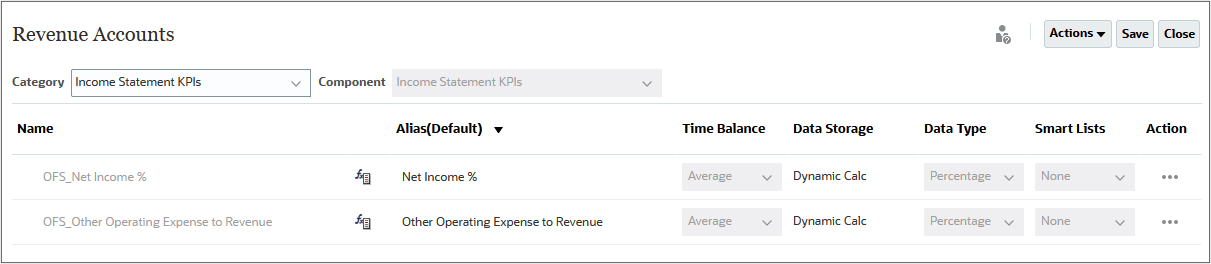
| OFS_Net Income % | Calculates net income as a % of total revenue |
| OFS_Other Operating Expense to Revenue | Calculates the percentage of operating expense to revenue as a performance indicator |
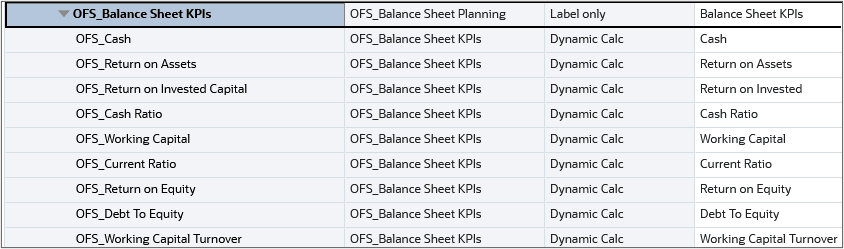
Balance Sheet
| KPI | Description |
|---|---|
| OFS_Cash | Parent key member used to depict total cash |
| OFS_Return on Assets | Calculates the return on asset performance metric, net Income divided by total assets |
| OFS_Return on Invested Capital | Calculates the return on invested capital |
| OFS_Cash Ratio | Indicates the ratio of cash compared to total current liabilities |
| OFS_Working Capital | Calculates the working capital by subtracting total current assets minus current liabilities |
| OFS_Current Ratio | Calculates the ratio of Total Assets to Total Liabilities |
| OFS_Return on Equity | Calculates the return on equity |
| OFS_Debt To Equity | Calculates the ratio of debt to equity |
| OFS_Working Capital Turnover | Calculates the working capital ratio by dividing total current assets minus current liabilities by total revenue |
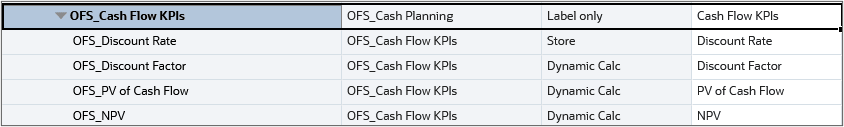
Cash Flow
| KPI | Description |
|---|---|
| OFS_Discount Rate | Discount rate |
| OFS_Discount Factor | Calculates the discount factor to be used in the NPV calculation |
| OFS_PV of Cash Flow | Calculates the present value of cash flow based on discount rate and cash flow |
| OFS_NPV | Calculates the net present value of cash flow |
Setting up the Foundation for Your Plans and Forecasts
In this section, you review the enabled features and time frame granularity, set values for user variables, and view data in Financials.
Reviewing Enabled Features
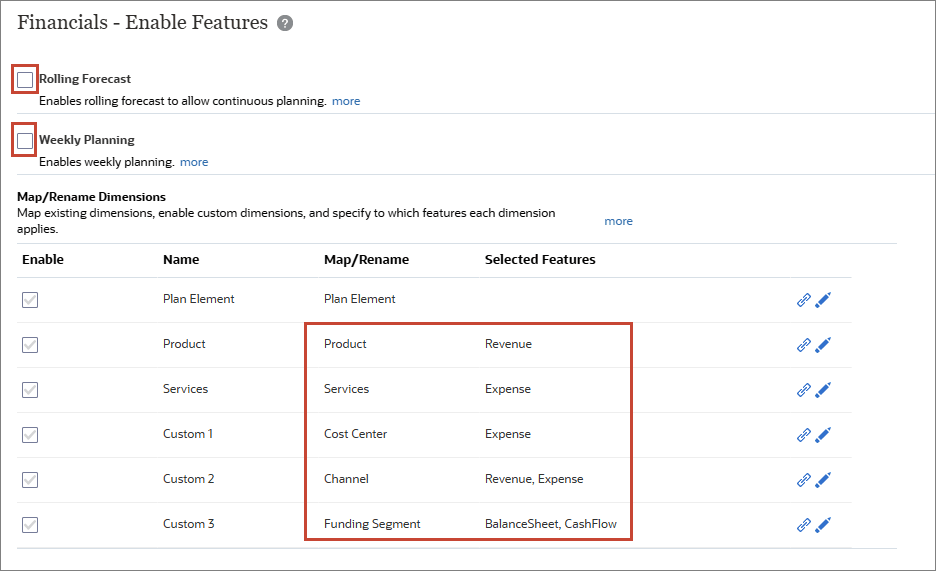
In Enable Features, you select which parent key members, accounts, and drivers you want to enable for your Financials business process, as well as add and map custom dimensions. Based on your selections, dimensions, drivers, forms, accounts, and KPIs are created.
Note:
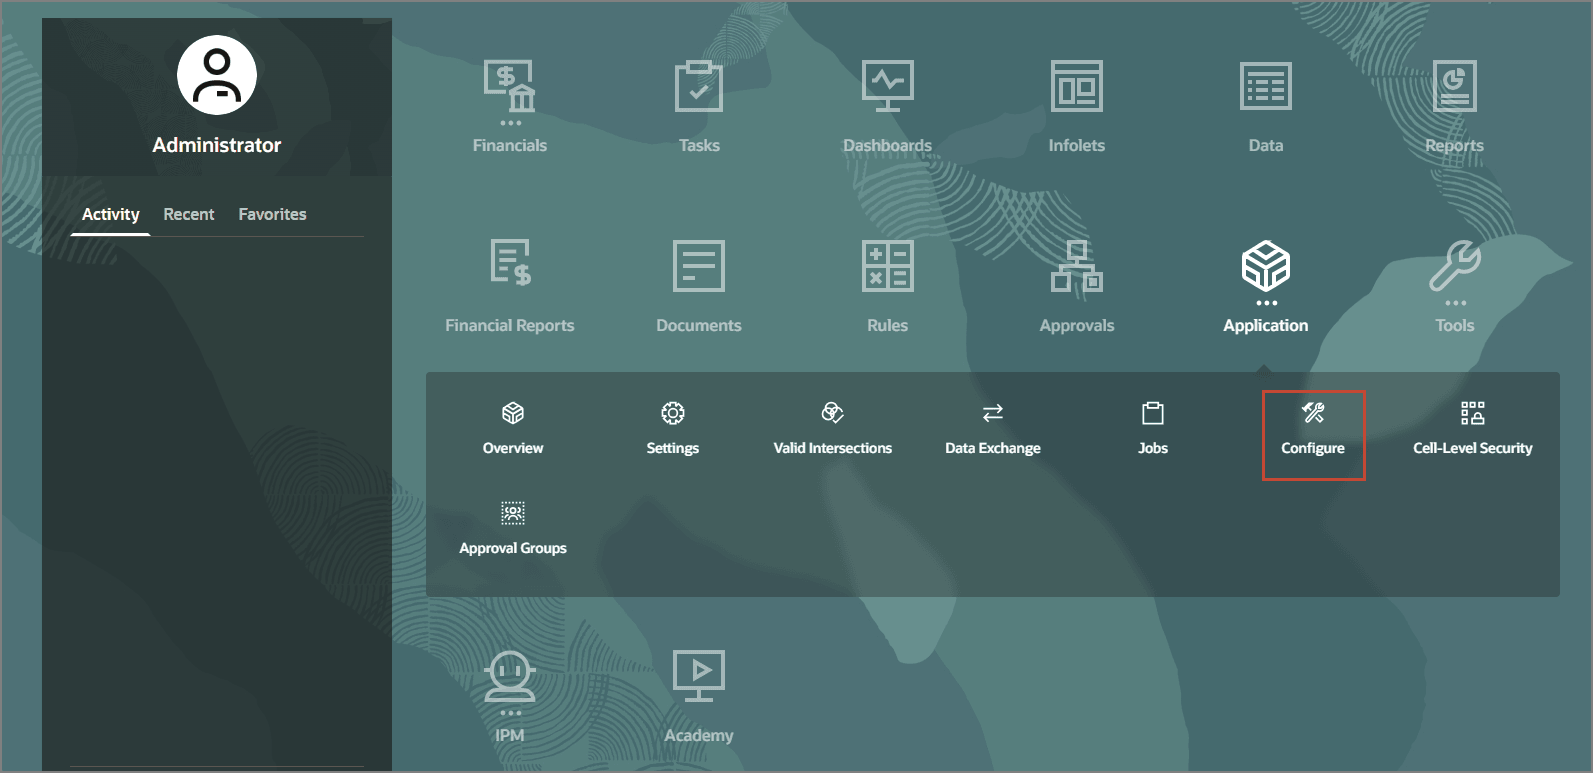
You must define all custom dimensions the first time you enable features. You can’t define these later.- On the Planning home page, click Application then Configure.
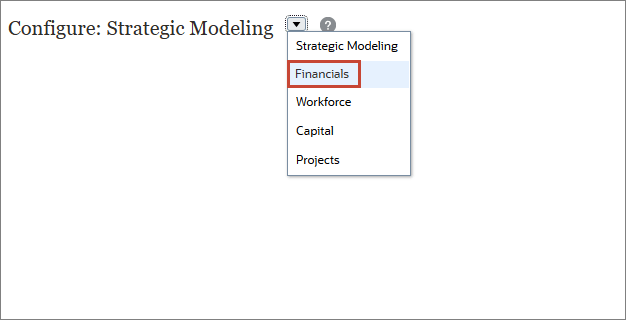
- From the Configure drop-down, select Financials.
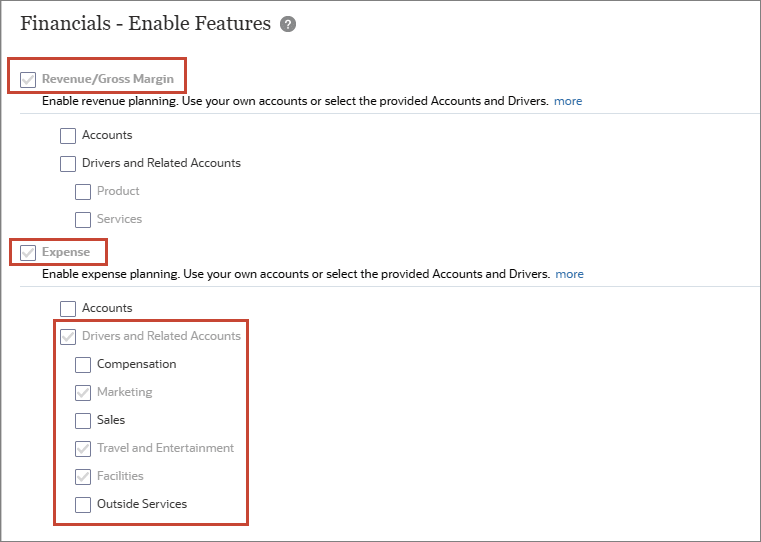
- In Configure: Financials, click Enable Features.
- Scroll down.
- Scroll down.
- Click Close.
Revenue and Expense planning is enabled. Expenses are configured so that you can plan with drivers and related accounts.
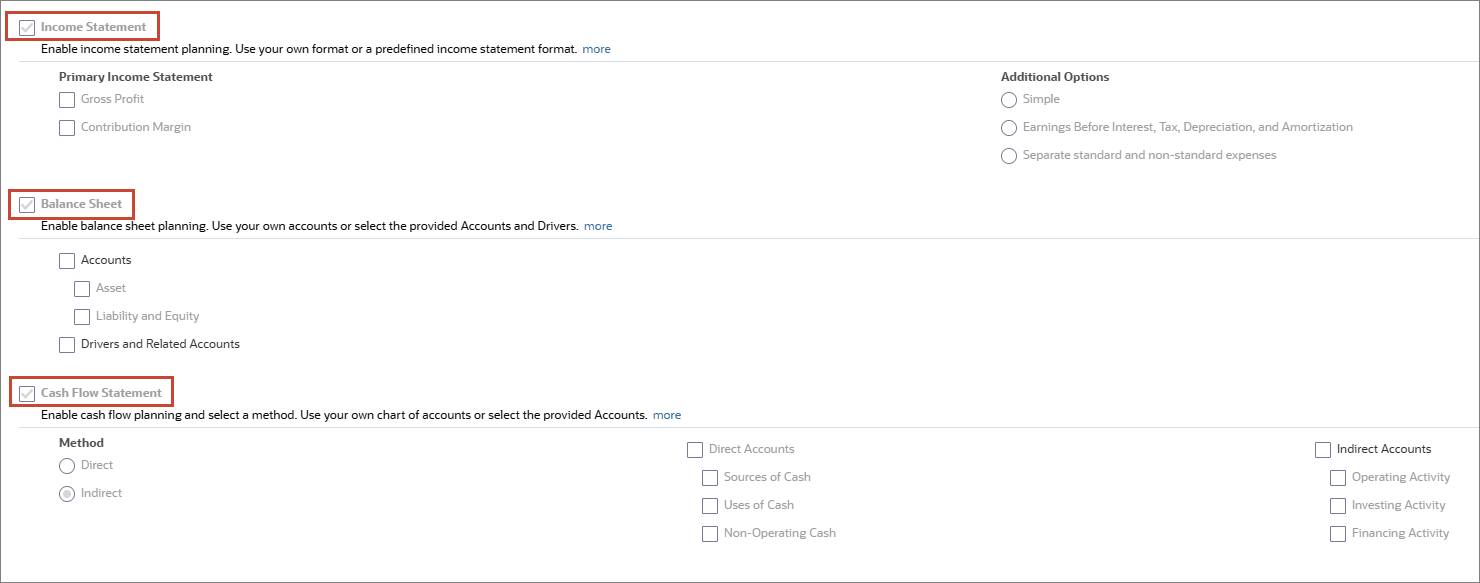
Income Statement, Balance Sheet and Cash Flow are configured.
Currently, Rolling forecast and Weekly planning are not configured. Existing and custom dimensions are displayed. Product dimension is enabled for Revenue and the Services dimension is enabled for Expense. Cost Center is enabled for Expense. Channel is enabled for both Revenue and Expense. Funding Segment is enabled for Balance Sheet and Cash Flow.
Note:
You can’t disable features later.Reviewing Time Periods and Granularity
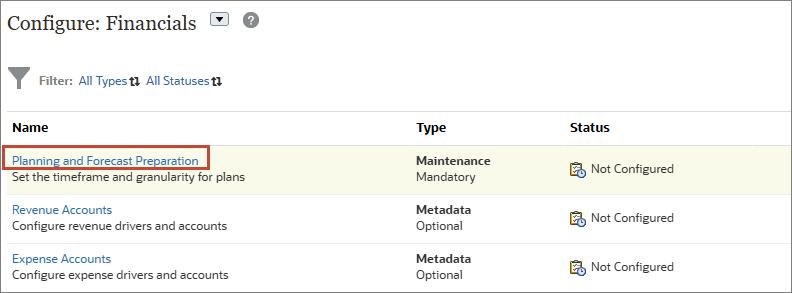
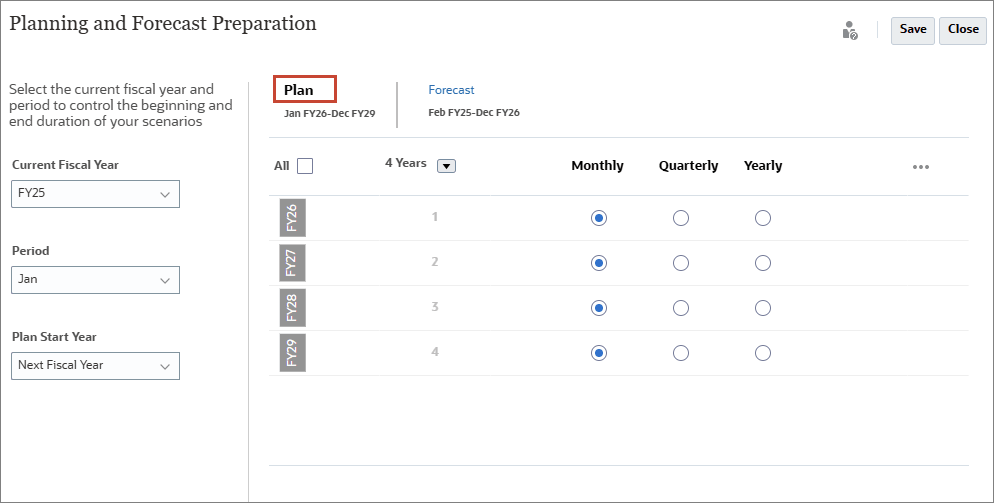
In Planning and Forecast Preparation, you select the current fiscal year, period (month), and plan start year to control the beginning and end duration of your scenarios. You also set the period granularity for the Plan, Forecast, and Rolling Forecast (if enabled) scenarios in your business process.
- In Configure: Financials, click Planning and Forecast Preparation.
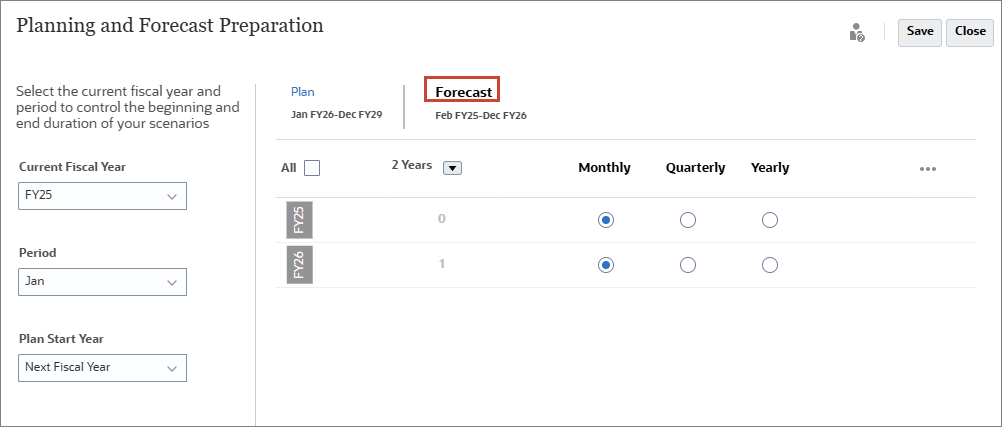
- Click Forecast.
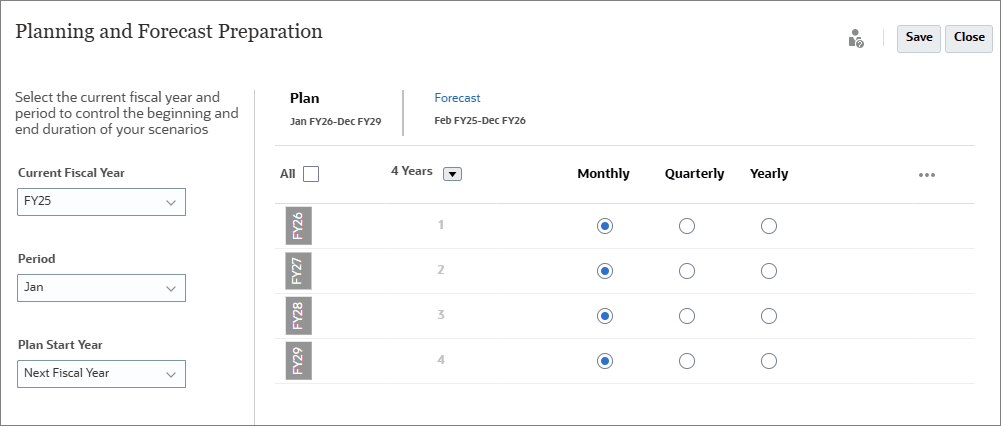
- Click Plan.
- Click Close.
Notice that Current Fiscal Year is FY25, the Period is January, and the Plan Start Year is set to Next Fiscal Year.
The Forecast starts in February FY25 and runs through December of FY26. The two year forecast is set on a monthly basis.
The four year Plan which runs from January FY26 through December of FY29, and has each year's data planned on a monthly basis.
Selecting Values for User Variables
User Variables were added when the business process was created. User variables act as filters in forms, enabling planners to focus only on certain members. In this section, you set values for User Variables.
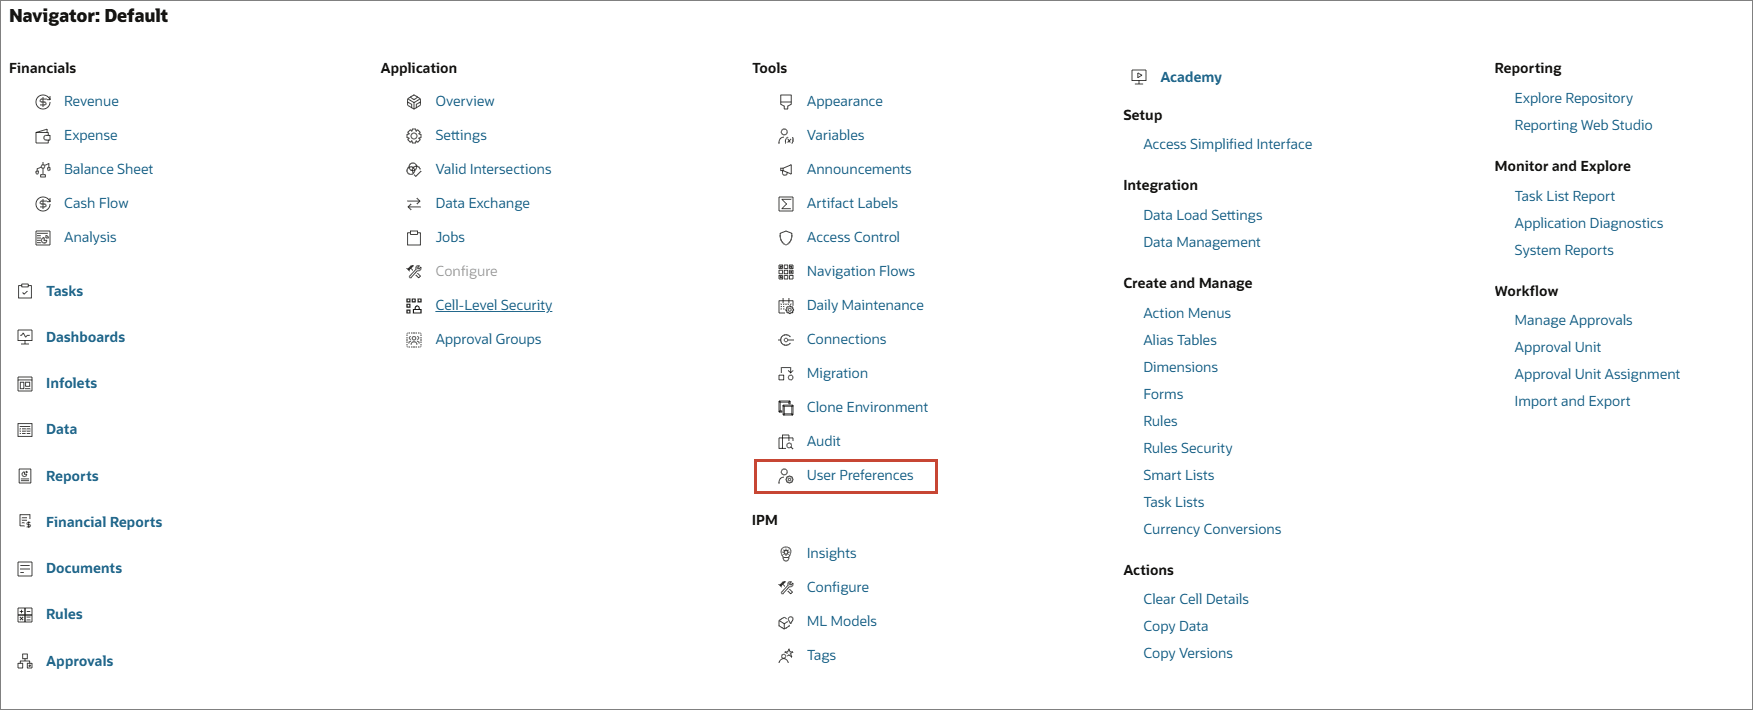
- Click
 (Navigator) then under Tools, click User Preferences.
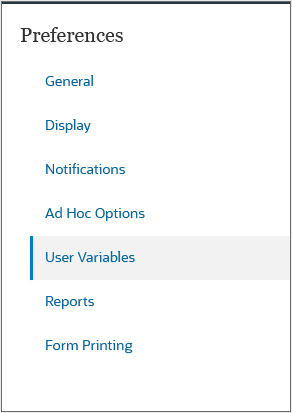
 - Under Preferences, click User Variables.
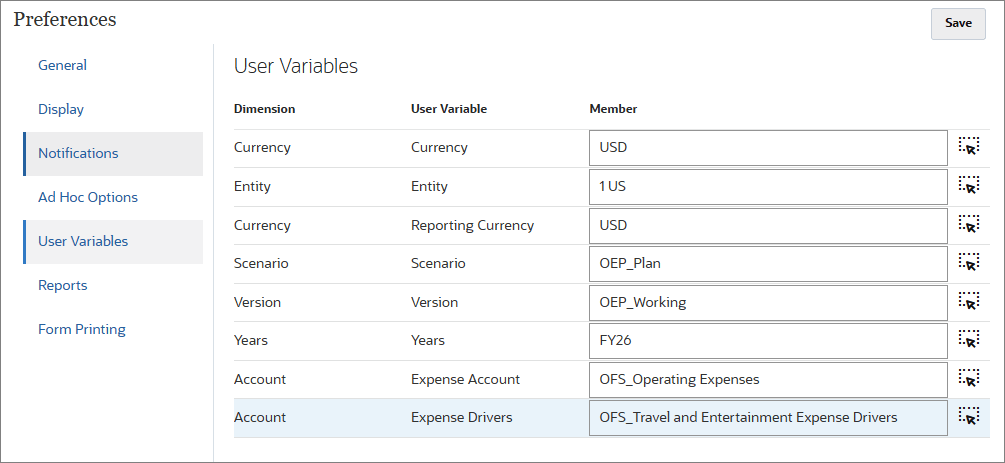
- For each variable, click its
 (Member Selector) to select a member as the variable's value:
- Currency: USD
- Entity: 1 US
- Reporting Currency: USD
- Scenario: OEP_Plan
- Version: OEP_Working
- Years: FY26
- Expense Account: OFS_Operating Expenses
- Expense Drivers: OFS_Travel and Entertainment Expense Drivers
- Verify your selections, and click Save.
- At the information message, click OK.
Managing KPIs
In this section, you manage KPIs in the dimension hierarchy and the Configure: Financials page.
Verifying Enabled KPIs
Out-of-the-box KPIs are enabled based on the features selected on the Enable Features page of Financials.
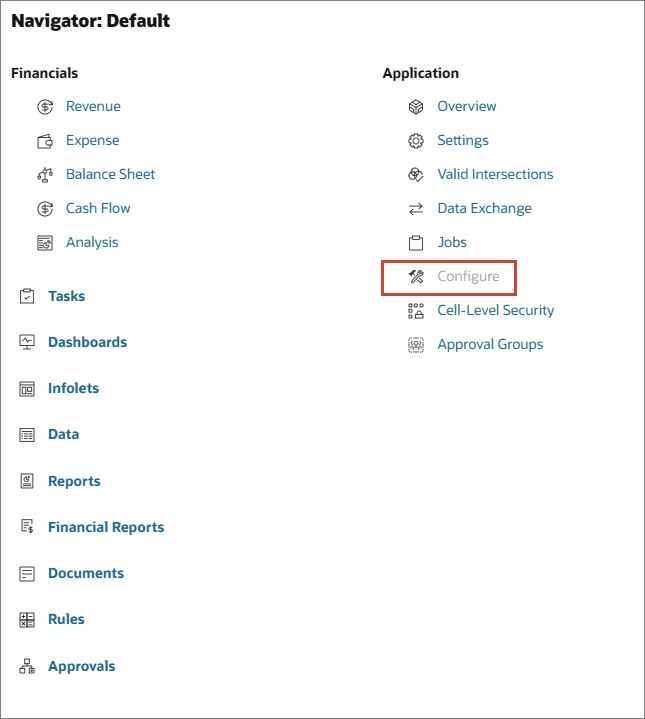
- Click (Navigator) then under Application, click Configure.
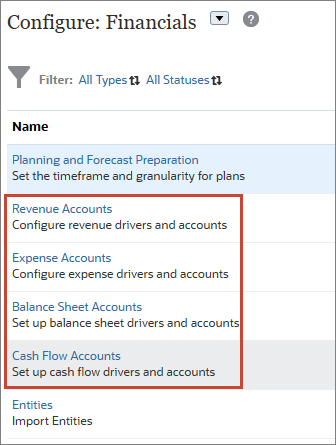
- From the Configure drop-down, select Financials.
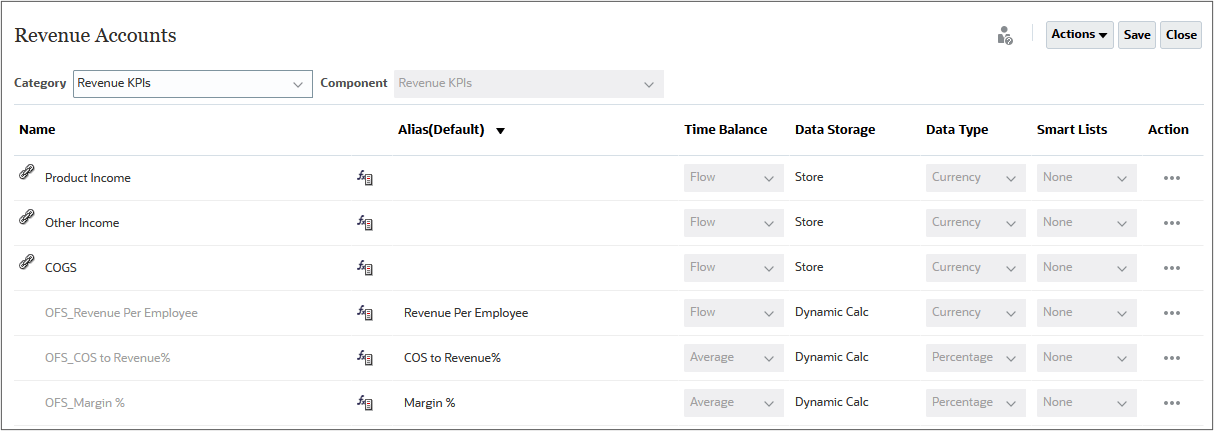
- In Configure: Financials, click Revenue Accounts.
- From the Category dropdown list, select Revenue KPIs.
- For OFS_COS to Revenue%, click
 (Member Formula).
 - Click Cancel.
- From the Category dropdown list, select Income Statement KPIs.
- Click Close.
- Repeat steps 3 to 7 to view KPIs for other subcomponents.
Depending on the features you enabled, subcomponent accounts are listed on this page. In this example, Revenue Accounts, Expense Accounts, Balance Sheet Accounts, and Cash Flow Accounts were enabled.
The enabled Revenue KPIs are displayed.
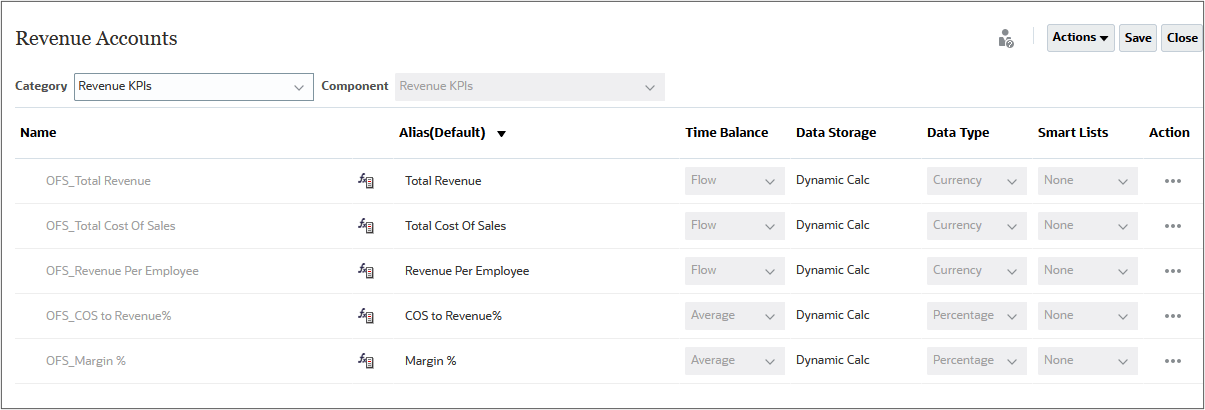
If the KPI has a member formula, you can view it here.
You can view, add, edit, and validate the KPI member formula here.
Income statement-related revenue KPIs are displayed.
Reviewing KPIs in the Hierarchy
KPIs are stored as account members in the dimension hierarchy.
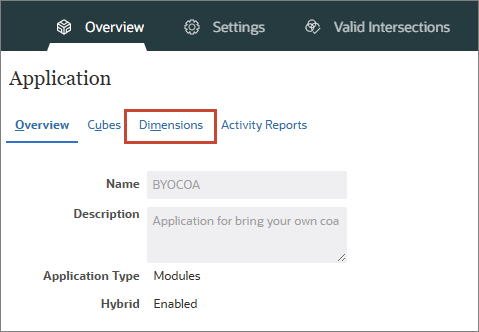
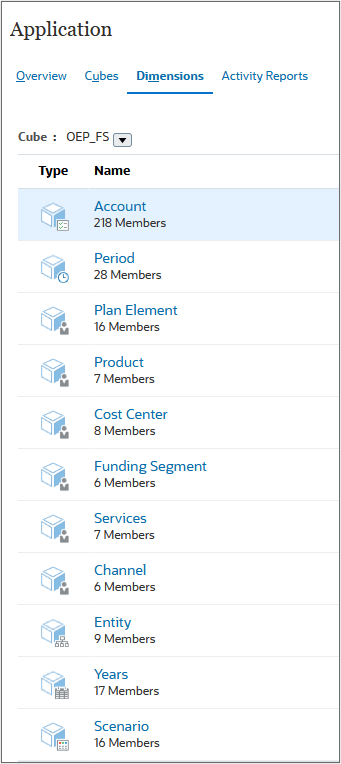
- Click (Navigator) then under Application, click Overview.
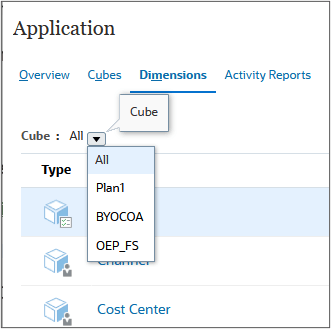
- Click Dimensions.
- From the Cube dropdown list, select OEP_FS.
- Click Account.
- In Edit Member Properties: Account, click
 (Zoom in All Levels) to expand all levels in the hierarchy.
 - Scroll down and locate the following members:
Tip:
You can search the members by name in the search box.- OFS_Revenue KPIs
- OFS_Expense KPIs
- OFS_Income Statement KPIs
- OFS_Balance Sheet KPIs
- OFS_Cash Flow KPIs

Adding KPIs to the Alternate Hierarchy
You can bring in your own KPIs in the same way you load your own chart of accounts. Predefined accounts, drivers, KPIs, and the chart of accounts you bring in can coexist in Financials.
In this section, you review the chart of accounts previously loaded under parent key members. You will add imported accounts as shared members under existing KPI parent members to make sure that the added accounts are included in the Income Statement.
Learn more on how to bring in your own chart of accounts from these tutorials:
- Configuring Financials to bring in your own chart of accounts
- Leveraging best practice Planning in Financials using your chart of accounts
Note:
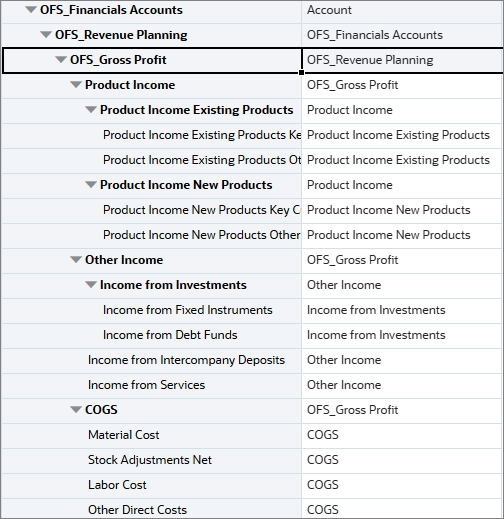
Learn how to add and edit dimensions and members by stepping through the Managing Dimensions in Cloud EPM Business Processes tutorial.- In the grid, under OFS_Financials Accounts, then OFS_Revenue Planning, select OFS_Gross Profit.
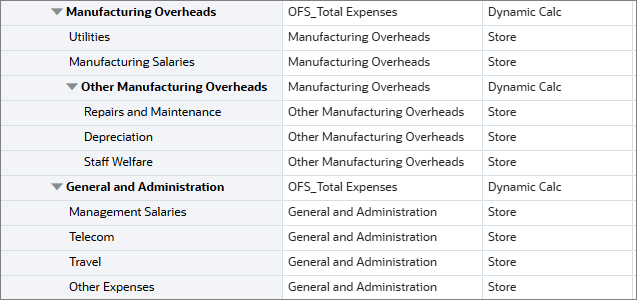
- In the grid, under OFS_Financials Accounts, then OFS_Expense Planning, select OFS_Total Expenses.
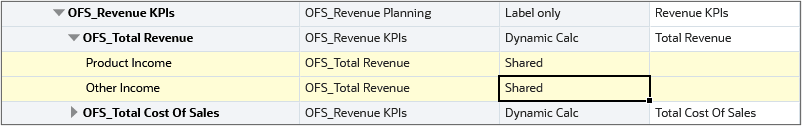
- Add the account members as KPIs. In the grid, under OFS_Financials Accounts, then OFS_Revenue Planning, then OFS_Revenue KPIs, select OFS_Total Revenue.
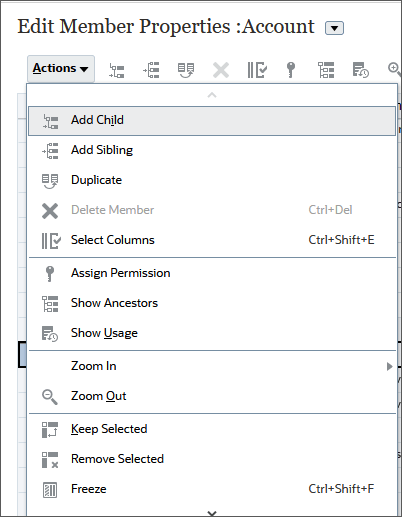
- Click Actions and select Add Child.
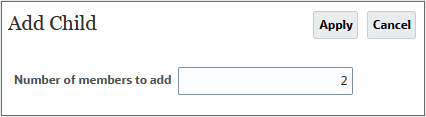
- In the Add Child dialog box, enter 2 and click Apply.
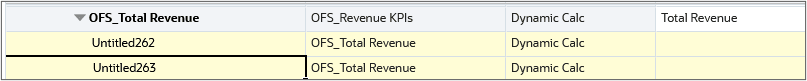
- Edit the Member Name for the added yellow cells under OFS_Total Revenue to:
- Product Income
- Other Income
- For both members, set the Default Data Storage to Shared.
- Click Save.
- In the grid, under OFS_Financials Accounts, then OFS_Revenue Planning, then OFS_Revenue KPIs, select OFS_Total Cost of Sales.
- Click Actions and select Add Child.
- In the Add Child dialog box, accept the default value (1) and click Apply.
- Edit the Member Name for the added yellow cell under OFS_Total Cost of Sales to COGS.
- Set the Default Data Storage to Shared.
- Click Save.
- Click
 (Refresh Database).
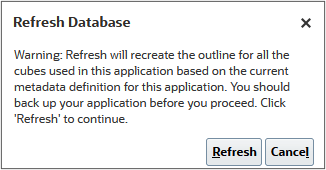
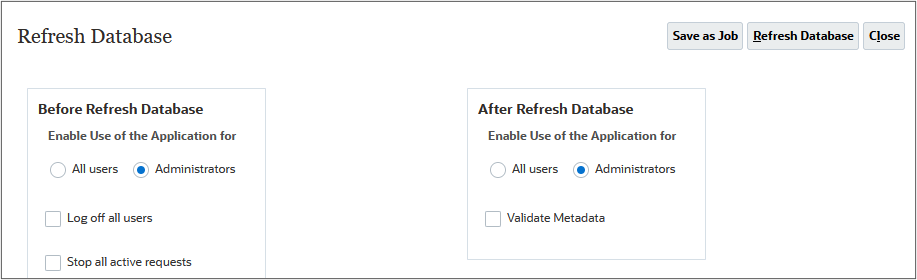
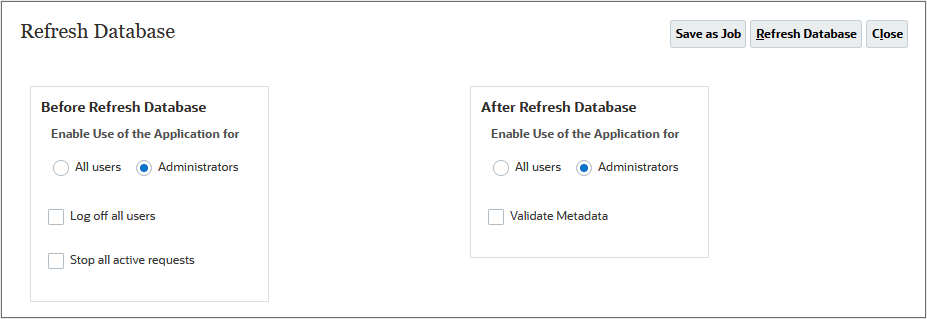
 - In the Refresh Database dialog box, accept the default selections, and click Refresh Database.
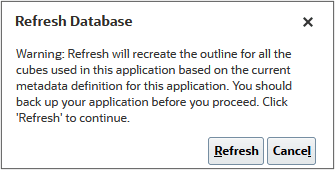
- At the Refresh Database prompt, click Refresh.
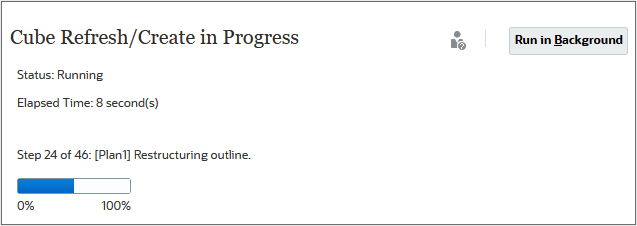
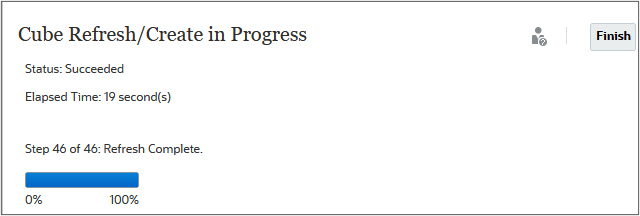
The Cube Refresh/Create in Progress status is displayed.
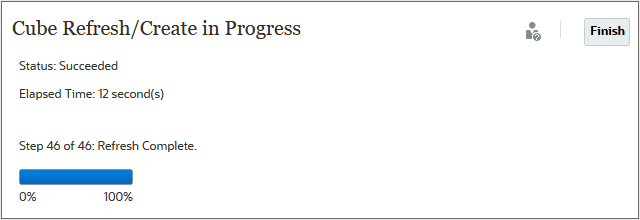
- When the status displays as Succeeded and the percent complete is 100%, click Finish.
- Click Close.
- Click Cancel.
The following revenue accounts were previously added to the hierarchy.
The following expense accounts were previously added to the hierarchy.
Yellow colored cells are added under OFS_Total Revenue.
The members are temporarily added to the hierarchy.

The member is temporarily added to the hierarchy.

To commit changes, you must refresh the database.
Tip:
It is recommended that Enable Use of the Application is set to Administrators, before and after refreshing the database, until Financials is completely configured and ready for production.Adding KPIs in Configure: Financials
You add and edit KPIs in the same way you add or edit accounts and drivers.
Tip:
Check that your KPI member aliases and names don’t conflict with those of the provided KPIs.- Click (Navigator) then under Application, click Configure.
- From the Configure drop-down, select Financials.
- In Configure: Financials, click Revenue Accounts.
- From the Category dropdown list, select Revenue KPIs.
- Click Actions and select Add.
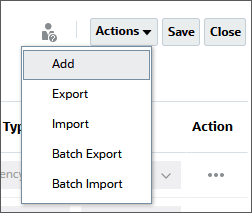
Tip:
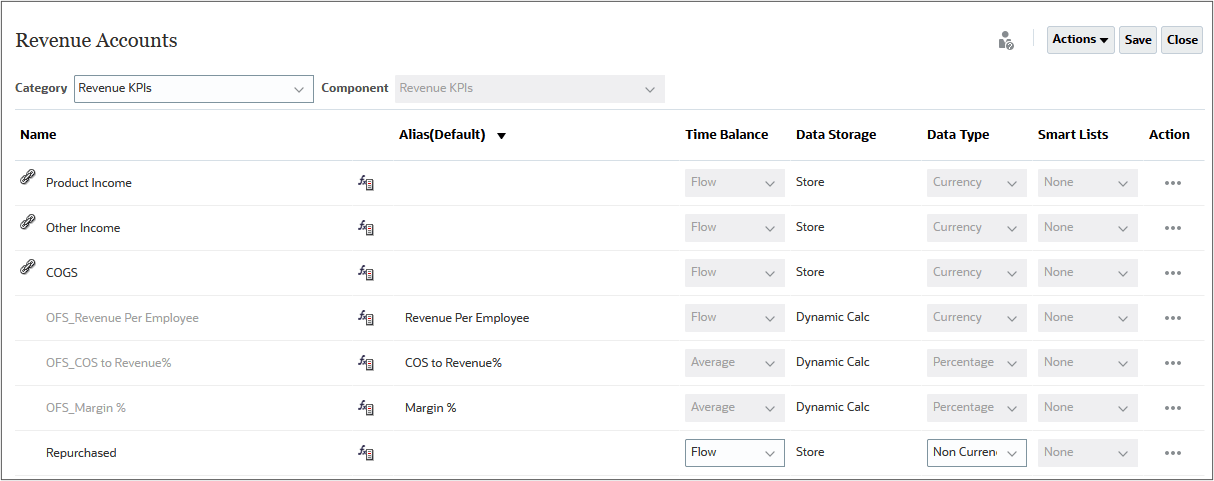
To add a small number of KPIs, select Add from the Actions menu. To add a group of KPIs, export the set of predefined KPIs, and then modify the export file in Excel. Then, import the modified file. - Enter details in the new row:
- Name: Repurchased
- Time Balance: Flow
- Data Storage: Store
- Data Type: Non Currency
- Click Save.
- Click OK.
- Click Close.
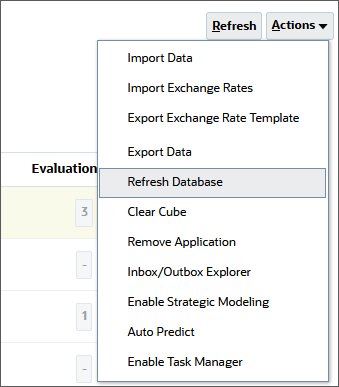
- Refresh the database. In Configure: Financials, click Actions and select Refresh Database.
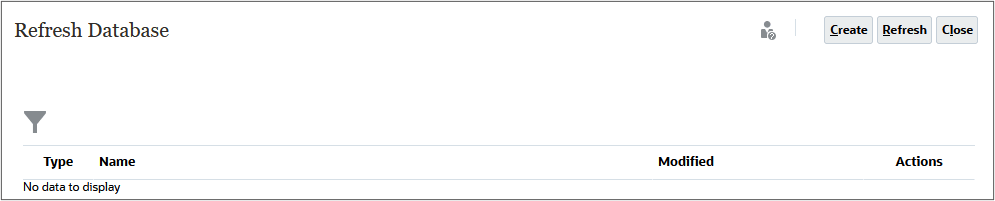
- In Refresh Database, click Create.
- For both Before Refresh Database and After Refresh Database—Enable Use of the Application for, select Administrators and click Refresh Database.
- At the prompt, click Refresh.
- When the status displays as Succeeded and the percent complete is 100%, click Finish.
- Click Close.
- In Refresh Database, click Close.
Notice that Product Income, Other Income, and COGS are now displayed, replacing OFS_Total Revenue, and OFS_Total Cost of Sales. In the hierarchy, OFS Total Revenue and OFS_Total Cost of Sales are still under OFS_Revenue KPIs but considered as parents. Level zero (0) KPIs are listed on this page.
Viewing KPIs in Dashboards and Forms
In this section, you load revenue data, plan using trends, run calculations, and view revenue data and KPIs.
Loading Revenue Data
At the beginning of your planning cycle, you might load data for a given scenario, version, and period. To stay up to date with changes or current data, you can plan for an incremental data load process.
- Click (Navigator) then under Application, click Overview.
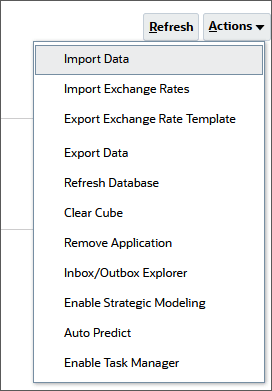
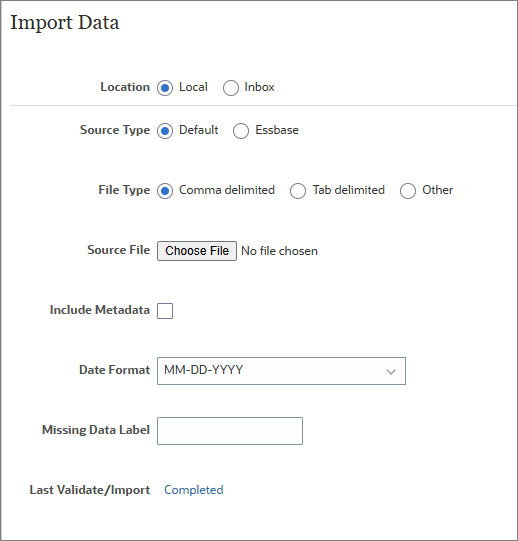
- Click Actions then select Import Data.
- In Import Data, click Create.
- Keep all the default selections and select Include Metadata.
- Click Browse to select a file.
- Locate and select Revenue_Data FY24_FY25_FY26.csv, and click Open.
Note:
The data file is also available in Prerequisites section for the download.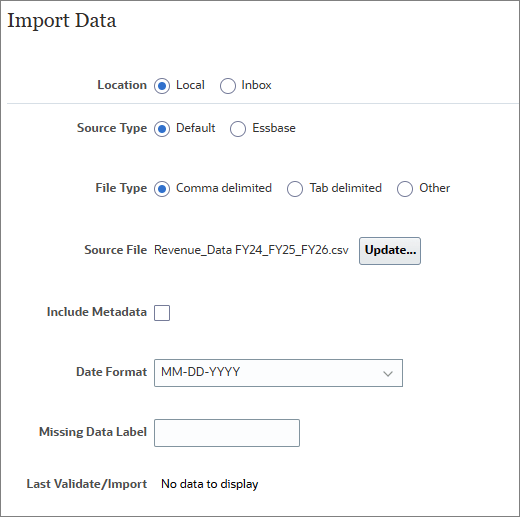
- Click Import.
- At the information dialog, click OK.
- Click Close twice.
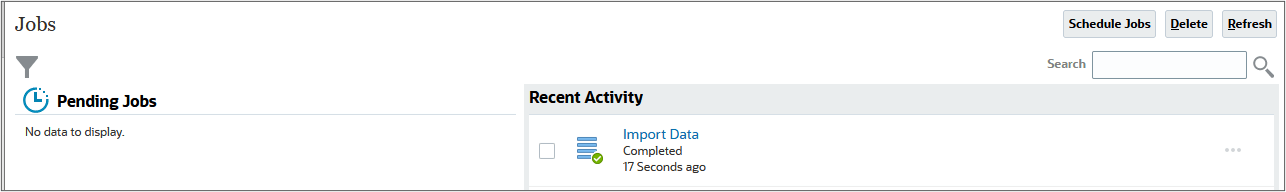
- Click Jobs.

- Verify that the job completed successfully.
Note:
Depending on your browser, the button label may display Choose File or Browse.Calculating Actuals and Preparing Plans
In this section, you run calculation rules to make sure your data is up to date and aggregated.
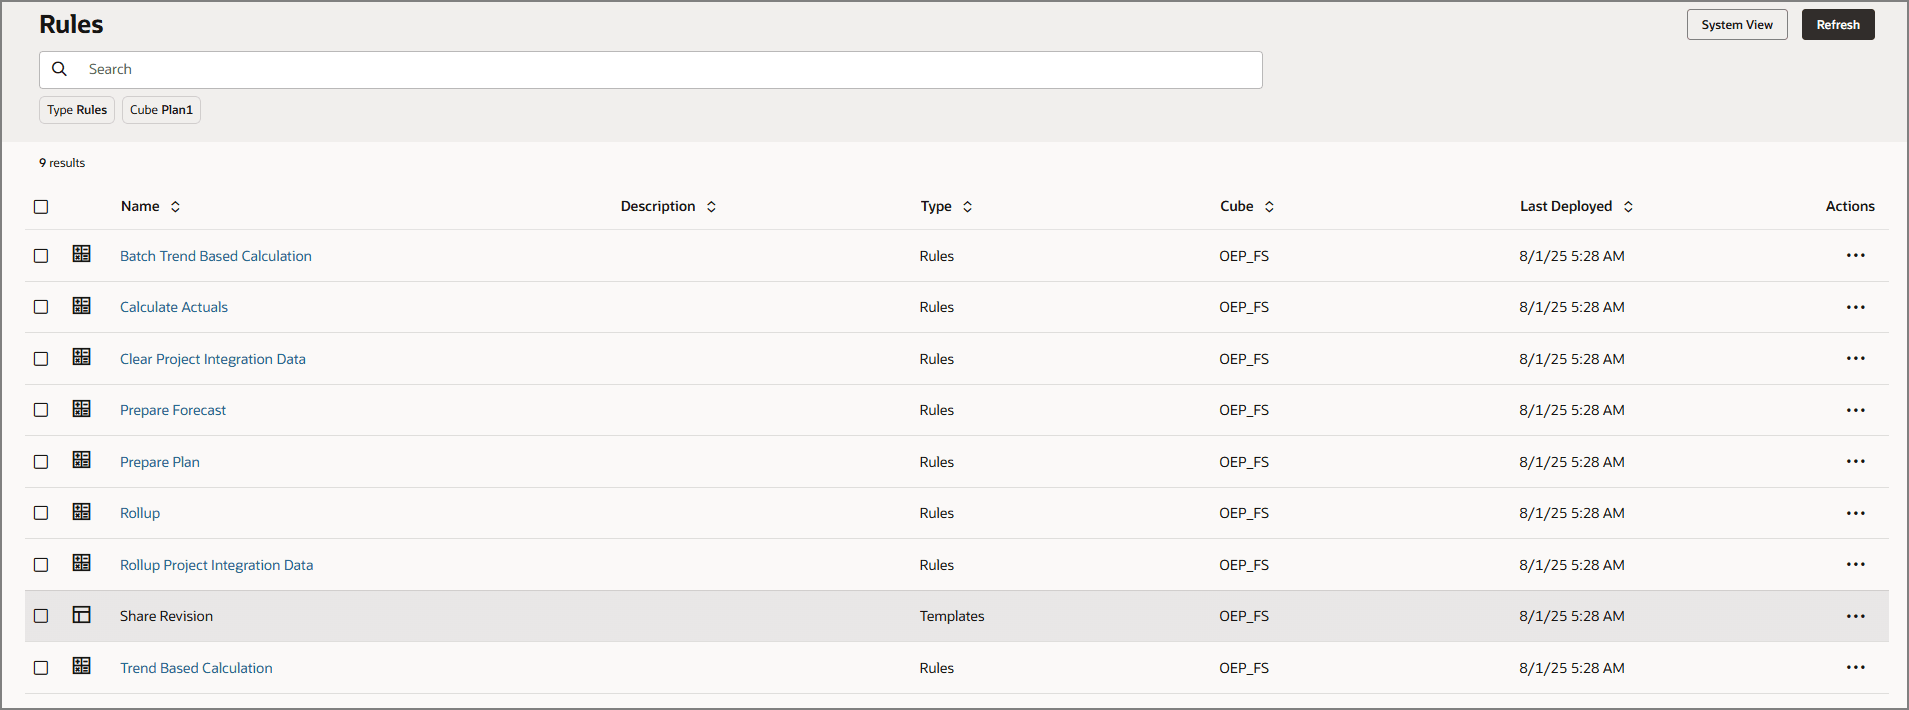
- From the Planning home page, click Rules.
- In Rules, for Calculate Actuals, click Launch.
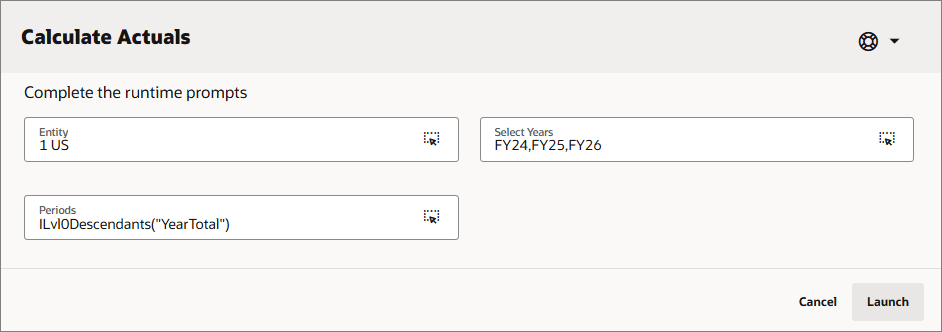
- For each item in the dialog box, select or type the values:
- Entity: 1 US
- Periods: ILvl0Descendants(YearTotal)
- Select Years: FY24,FY25,FY26
- Click Launch.
- At the prompt, click OK.
- In Rules, for Rollup, click Launch.
- For each item in the dialog box, select or type the values:
Tip:
Change the value of the Scenario dimension first.- Scenario: OEP_Actual
- Select Years: FY24,FY25,FY26
- Currency: USD
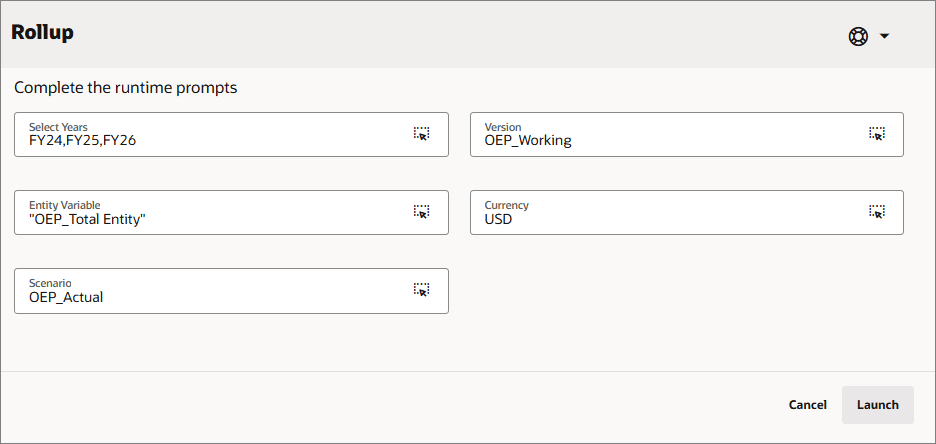
- Click Launch.
- Click OK.
- In Rules, for Prepare Plan, click Launch.
- For each item in the dialog box, select or type the values:
- Entity: 1 US
- Currency: USD
- Years: FY24,FY25,FY26
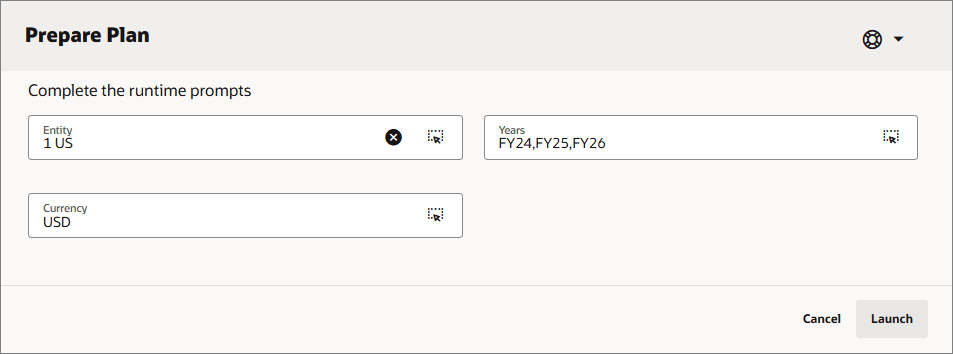
- Click Launch.
- Click OK.
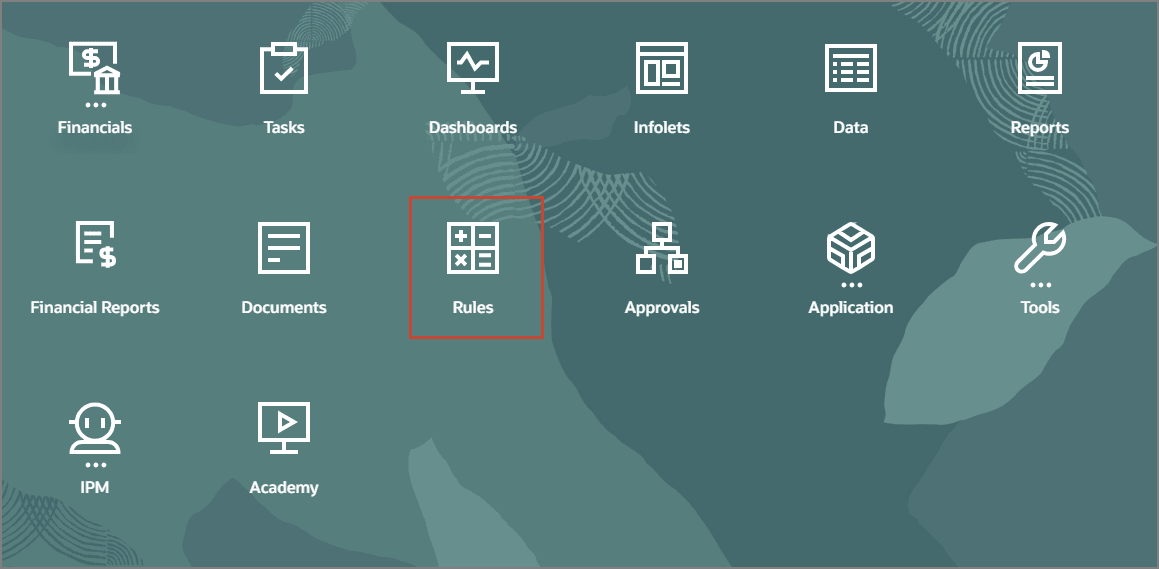
The Rules page lists predefined calculations in Financials.
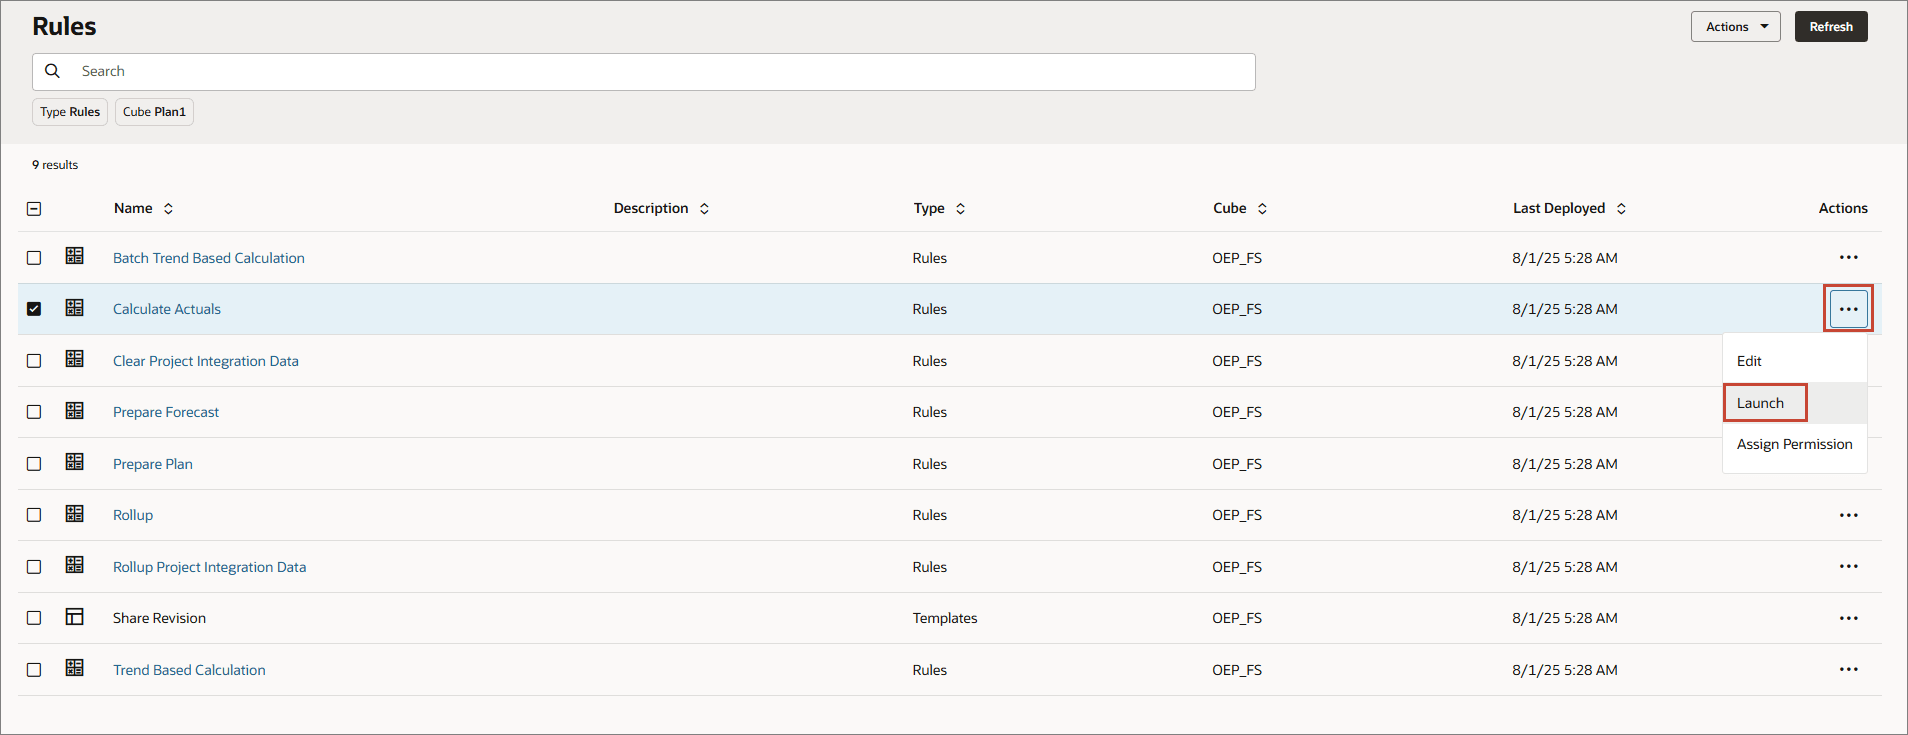
This Rule calculates drivers and aggregates data in Actuals.
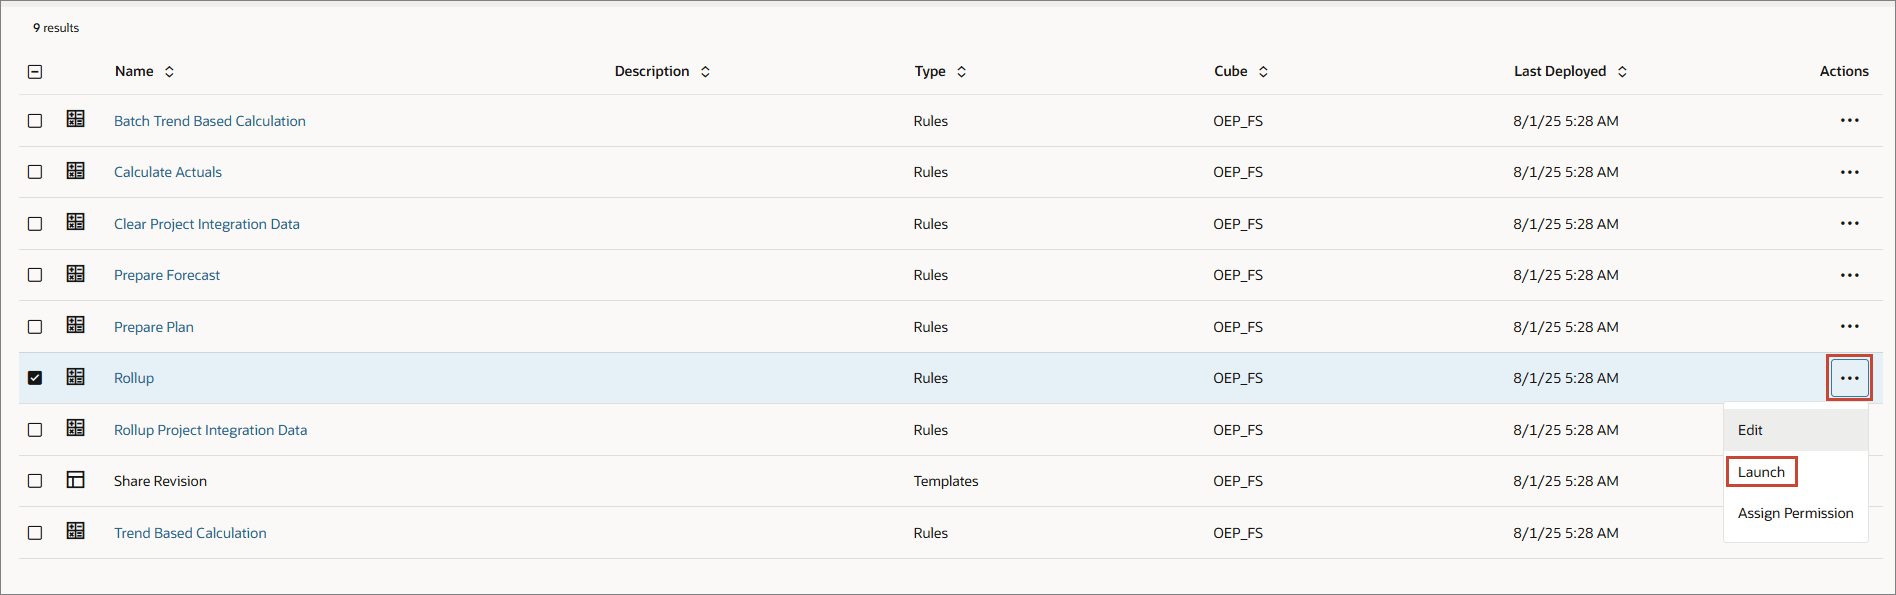
This Rule aggregates data to update reports or analyze data at various levels of the business hierarchy.
This Rule calculates plans based on the trends and drivers set up in Financials.
Entering and Viewing Plan Data
After loading data, you can start preparing plans that can be executed on a calendar based on your organization requirements.
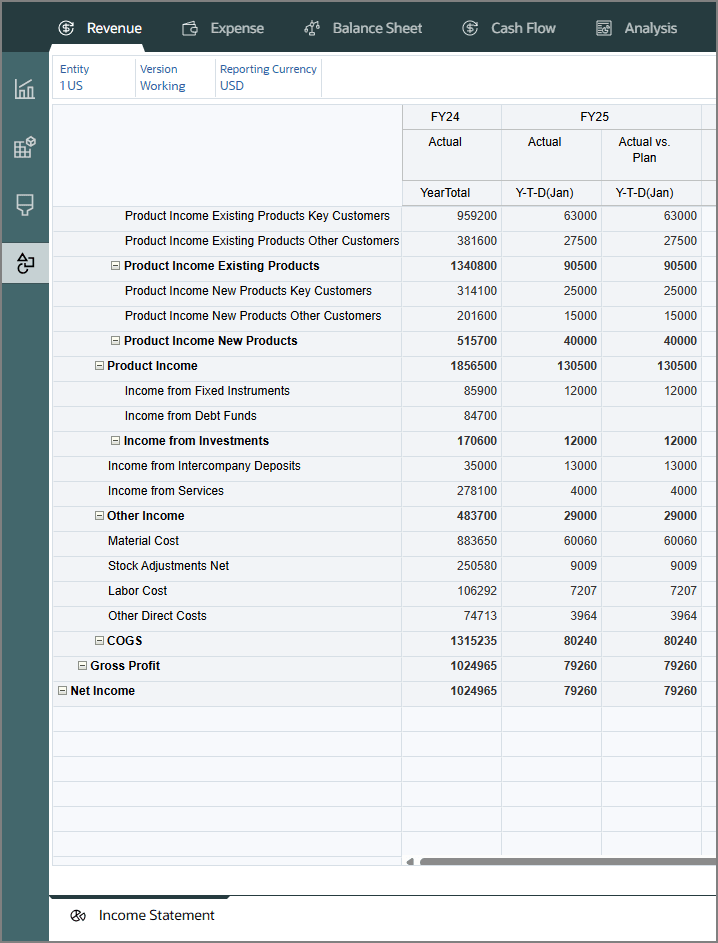
- From the Planning home page, click Financials, then Revenue.
- From the left vertical tabs, click
 (Income Statement).
The Income Statement tab includes data from the Actual and Plan scenarios. The accounts displayed are from the chart of accounts that was previously loaded.
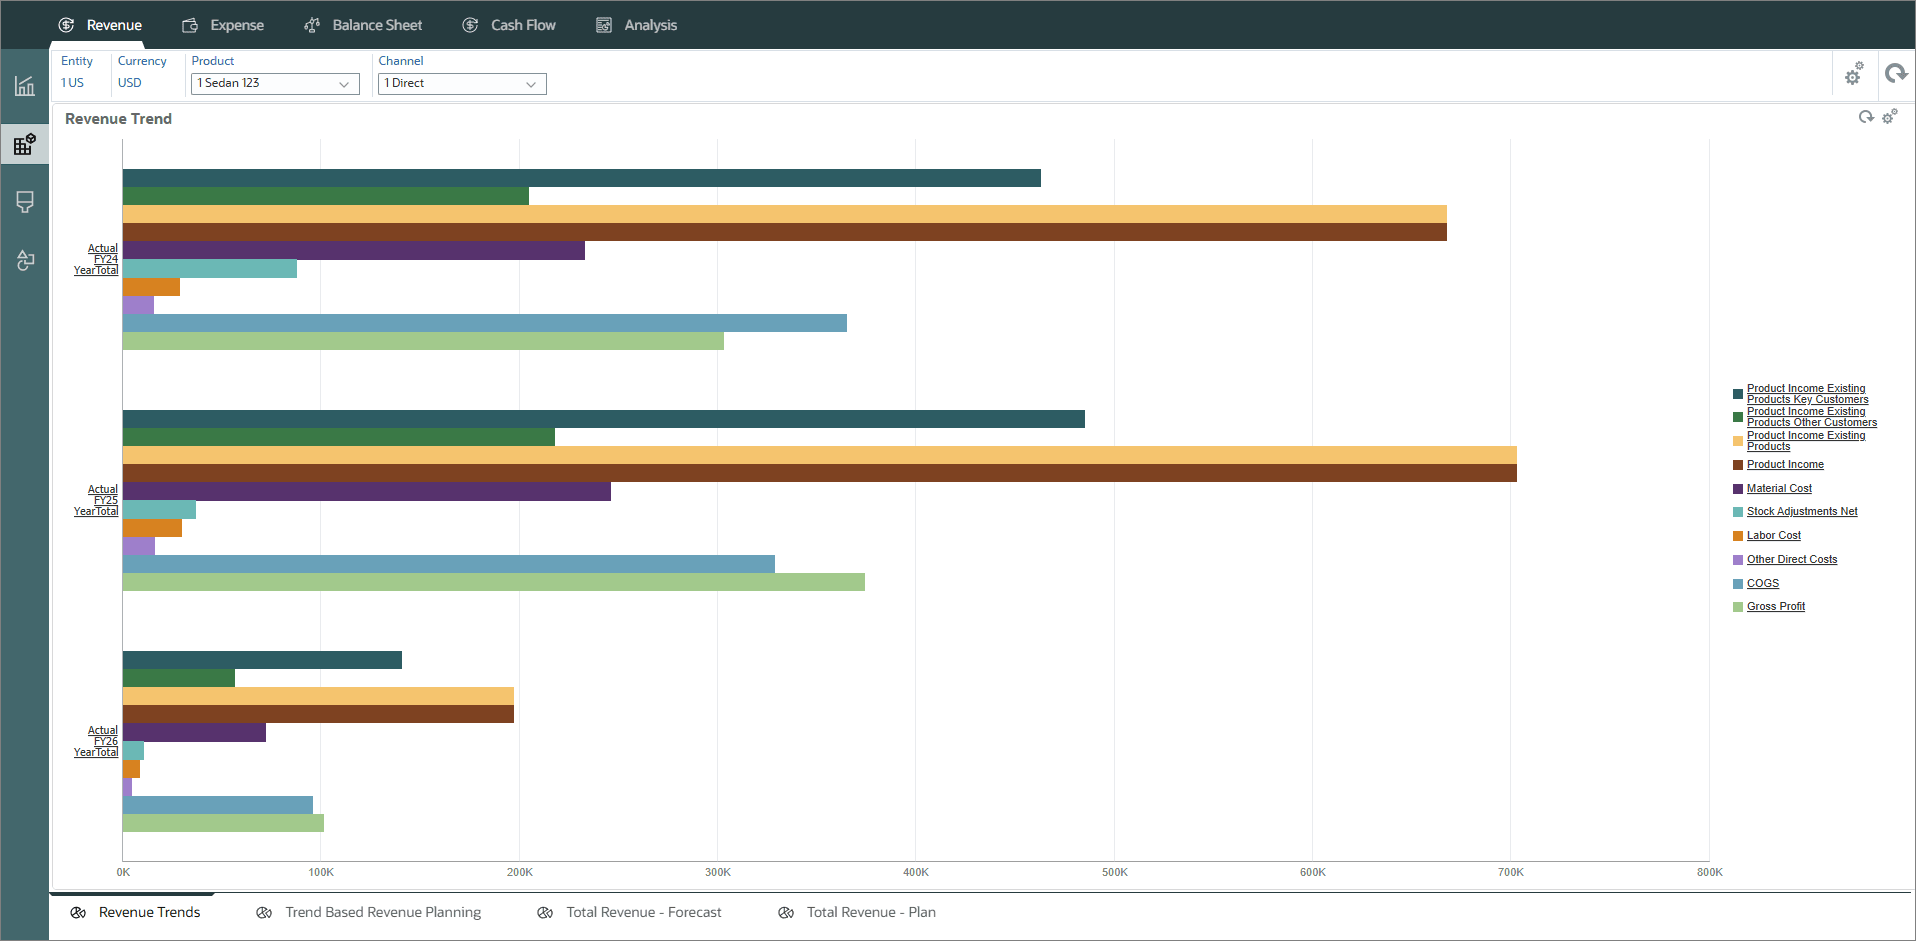
- From the left vertical tabs, click
 (Driver and Trend Based).
The Revenue Trends chart is displayed.
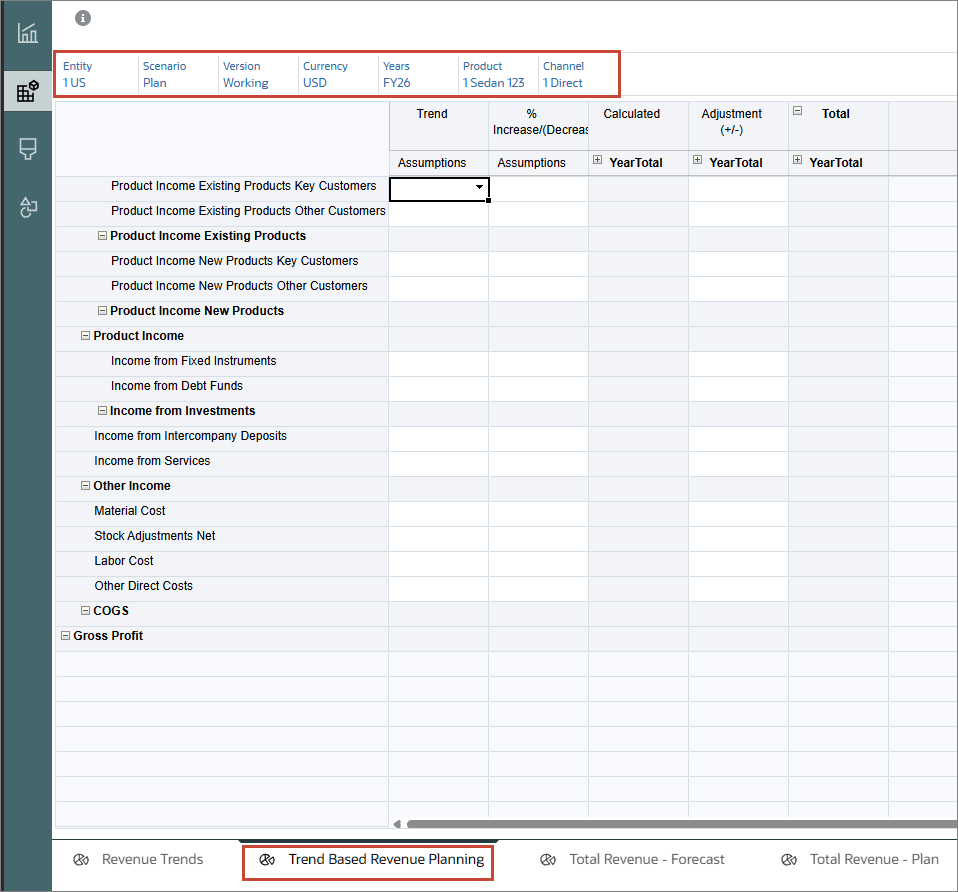
- From the bottom tabs, click Trend Based Revenue Planning.
- Modify the POV selections based on the following, and click
 (Go):
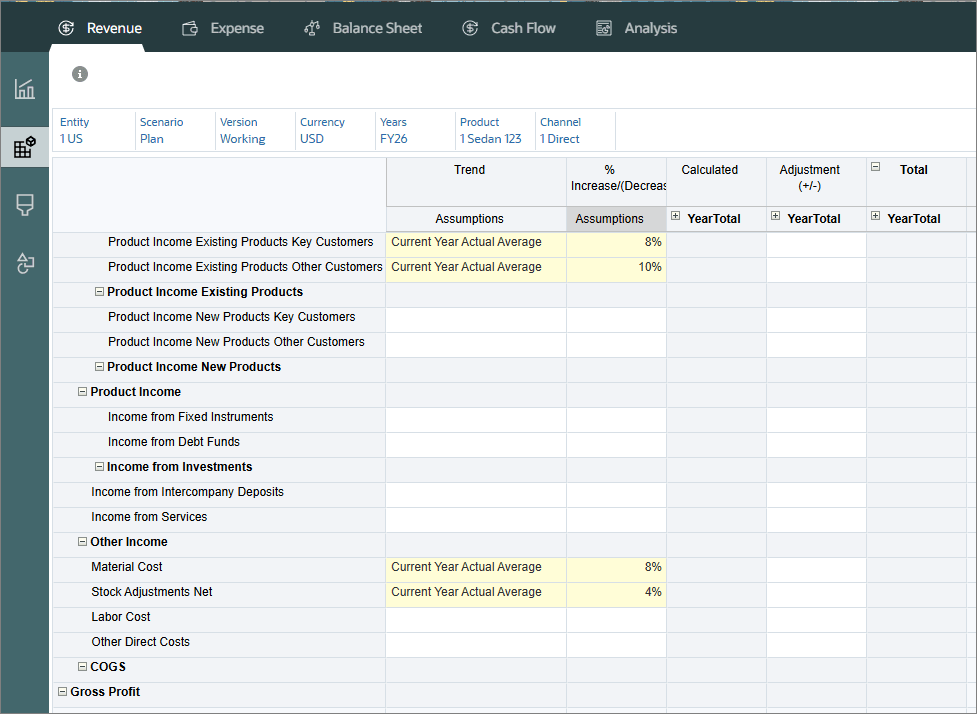
(Go): - For Product Income Existing Products Key Customers, in Trend Assumptions, select Current Year Actual Average, and in %Increase/(Decrease) Assumptions, enter 8%.
- For Product Income Existing Products Other Customers, in Trend Assumptions, select Current Year Actual Average, and in %Increase/(Decrease) Assumptions, enter 10%.
- For Material Cost, in Trend Assumptions, select Current Year Actual Average, and in %Increase/(Decrease) Assumptions, enter 8%.
- For Stock Adjustments Net, in Trend Assumptions, select Current Year Actual Average, and for Stock Adjustments Net, and in %Increase/(Decrease) Assumptions, enter 4%.
- Click Save.
- At the Information message, click OK.
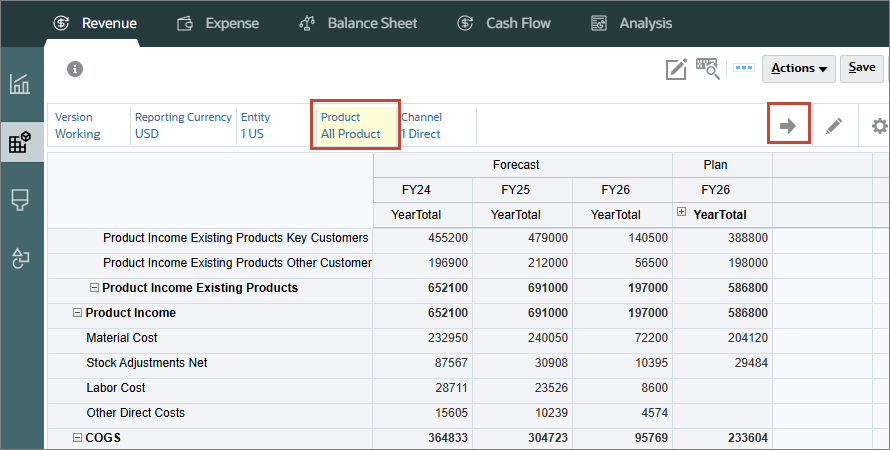
- From the bottom tabs, click Total Revenue - Plan.
- In the POV, change the selection for Product to All Product, and click (Go).
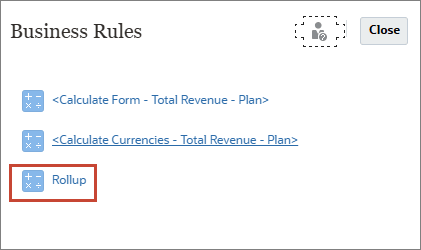
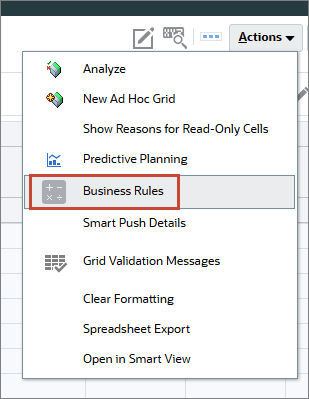
- In Total Revenue - Plan, click Actions and select Business Rules.
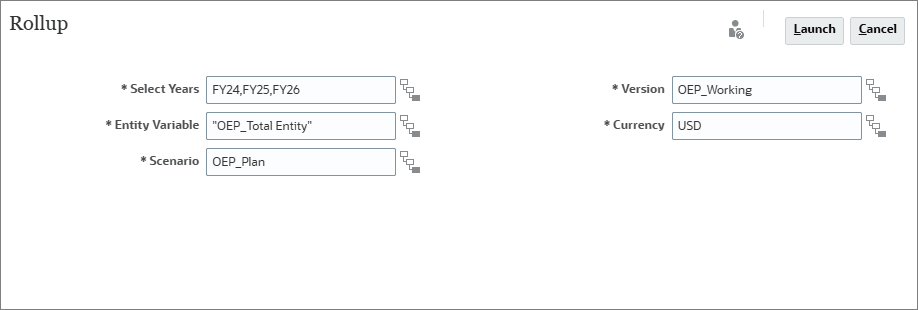
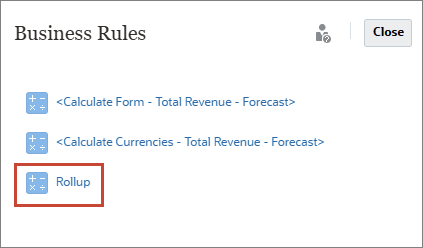
- In the Business Rules prompt, click Rollup.
- In the Rollup prompt, verify the default selections for Entity, Scenario, and Version:
- Entity Variable: OEP_Total Entity
- Scenario: OEP_Plan
- Version: OEP_Working
- For Years and Currency, click its
 (Member Selector) to select a member as its value:
- Select Years: FY24,FY25,FY26
- Currency: USD
- Click Launch.
- Click OK.
- In the left, click
 (Overview).
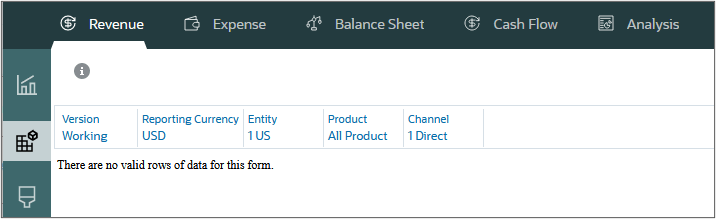
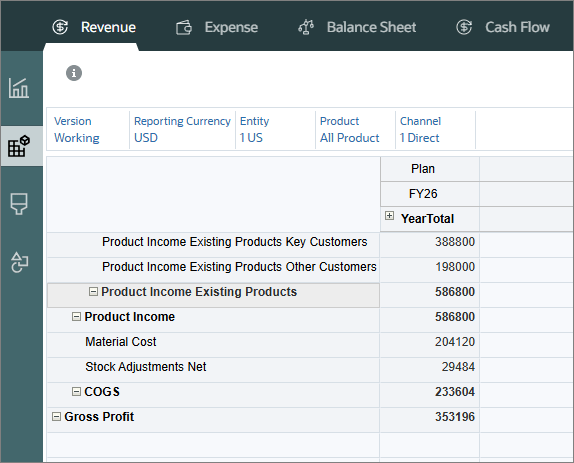
The form displays no valid rows of data.
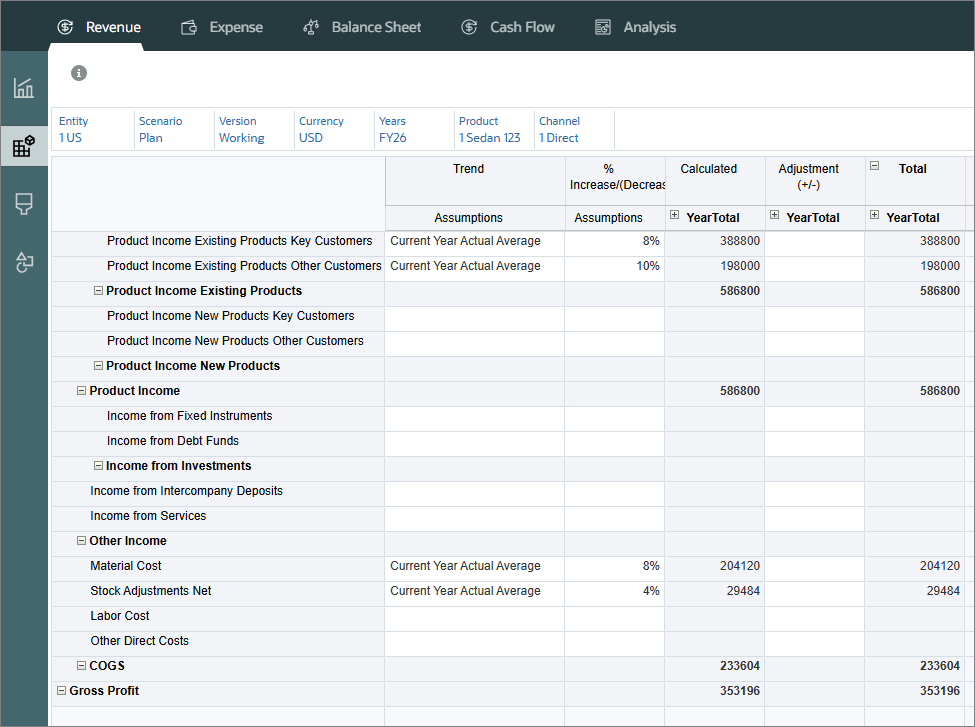
Data is calculated and updated on the form. Note that COGS and Product Income were added as KPIs.
The form displays no valid rows of data.
Data was rolled up in the hierarchy and is now displayed on the form.
The Revenue Overview dashboard displays Actual and Plan data. To include updated data, including KPIs, you must run calculations for Forecast.
Rolling up Forecast Data and Viewing the Updated Dashboard
With forecasting, you can budget using past and present data, and analyze trends using assumptions. Forecasts can help your management teams anticipate results based on past information, while allowing to be adjusted when new information is available. You can also prepare forecasts that mimic real, flexible business cycles.
Tip:
Forecast data was imported when you loaded revenue data. To learn how to prepare forecast data, refer to the Calculating Actuals and Preparing Plans and Forecasts in Financials tutorial.After running calculation rules for the forecast scenario, you view KPIs in the Revenue dashboard.
- In the left, click the (Driver and Trend Based) tab.
- From the bottom tabs, click Total Revenue - Forecast.
- Click Actions and select Business Rules.
- In Business Rules, click Rollup.
- For each item in the dialog box, click its (Member Selector) to select a member as its value:
- Scenario: OEP_Forecast
- Select Years: FY24,FY25,FY26
- Currency: USD
- Click Launch.
- Click OK.
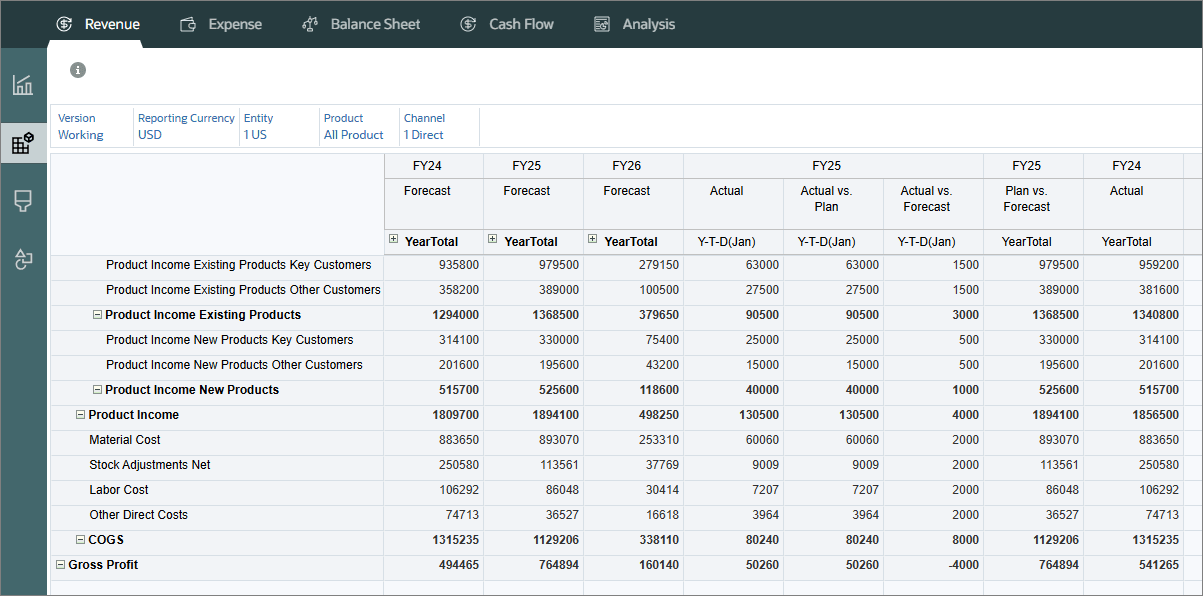
- In the left, click (Overview).
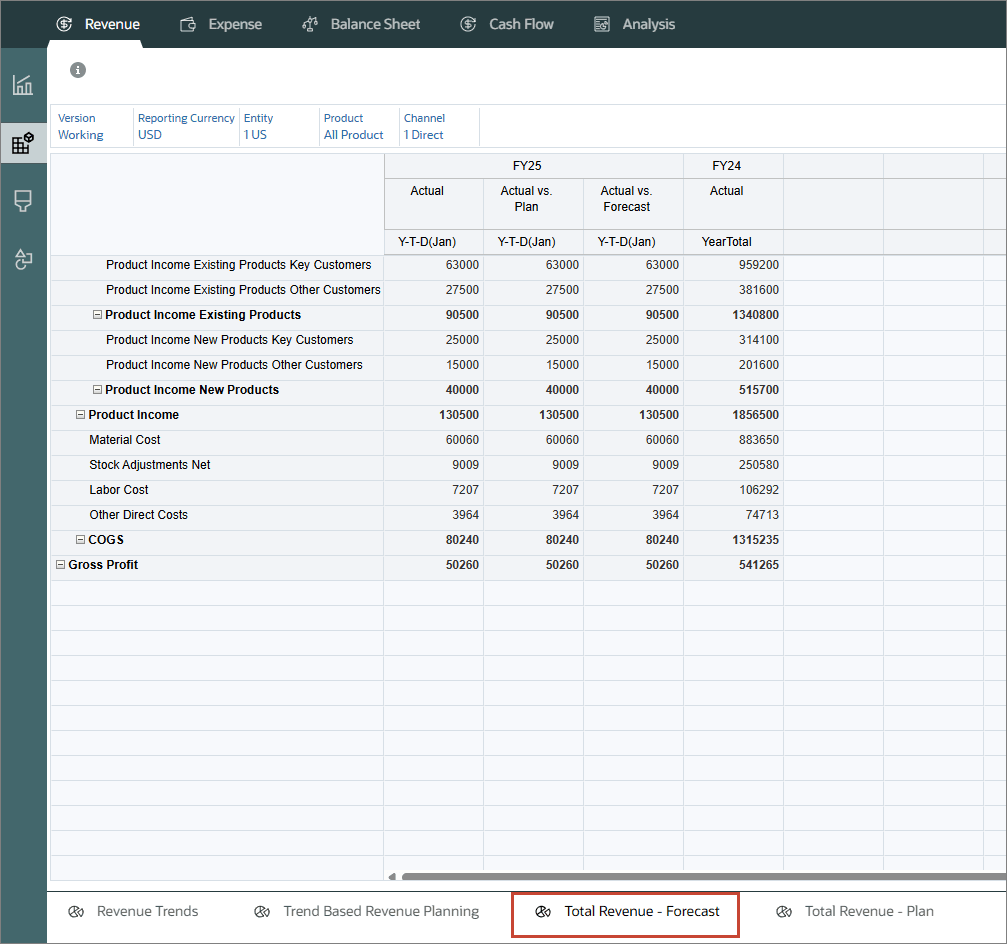
Total Revenue - Forecast displays data for Actual and Plan scenarios. To include updated Forecast scenario data, run the Rollup business rule.
Tip:
Change the value of the Scenario dimension first.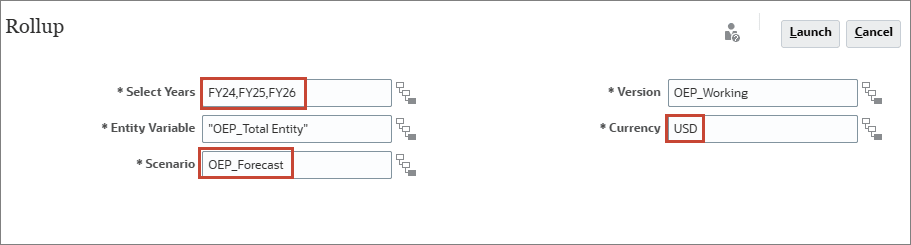
Data for Actuals, Plan, and Forecast are now displayed.
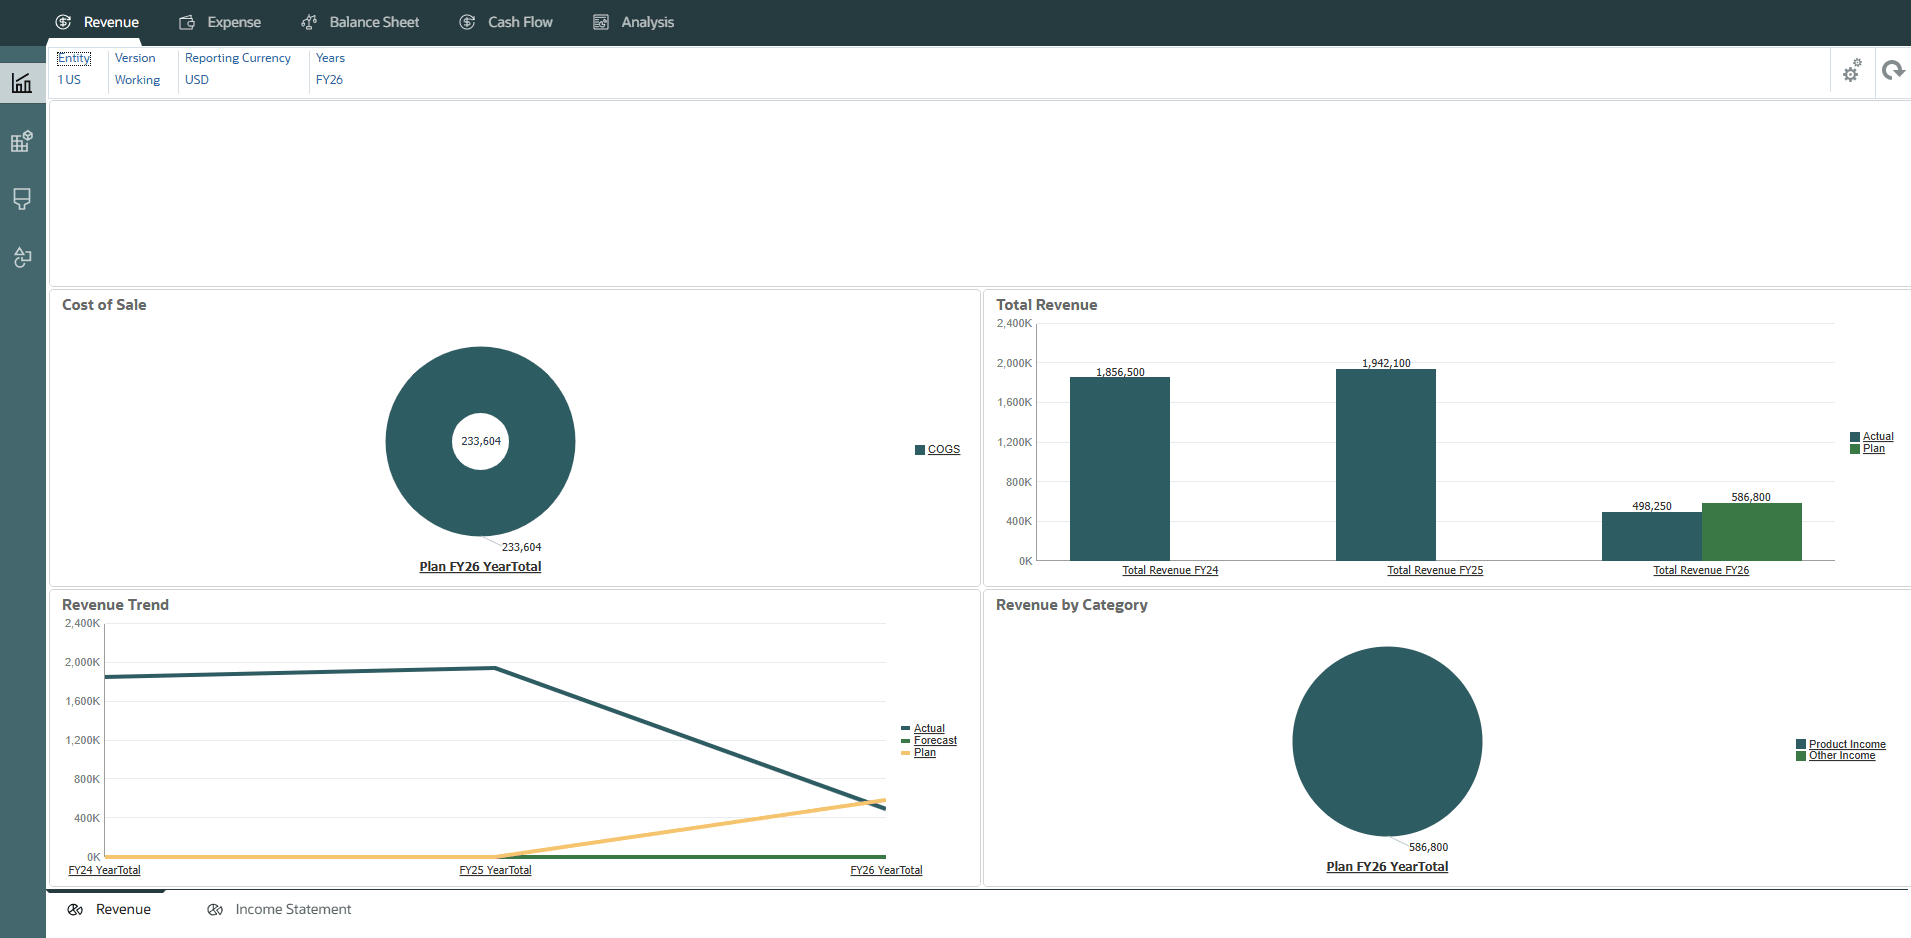
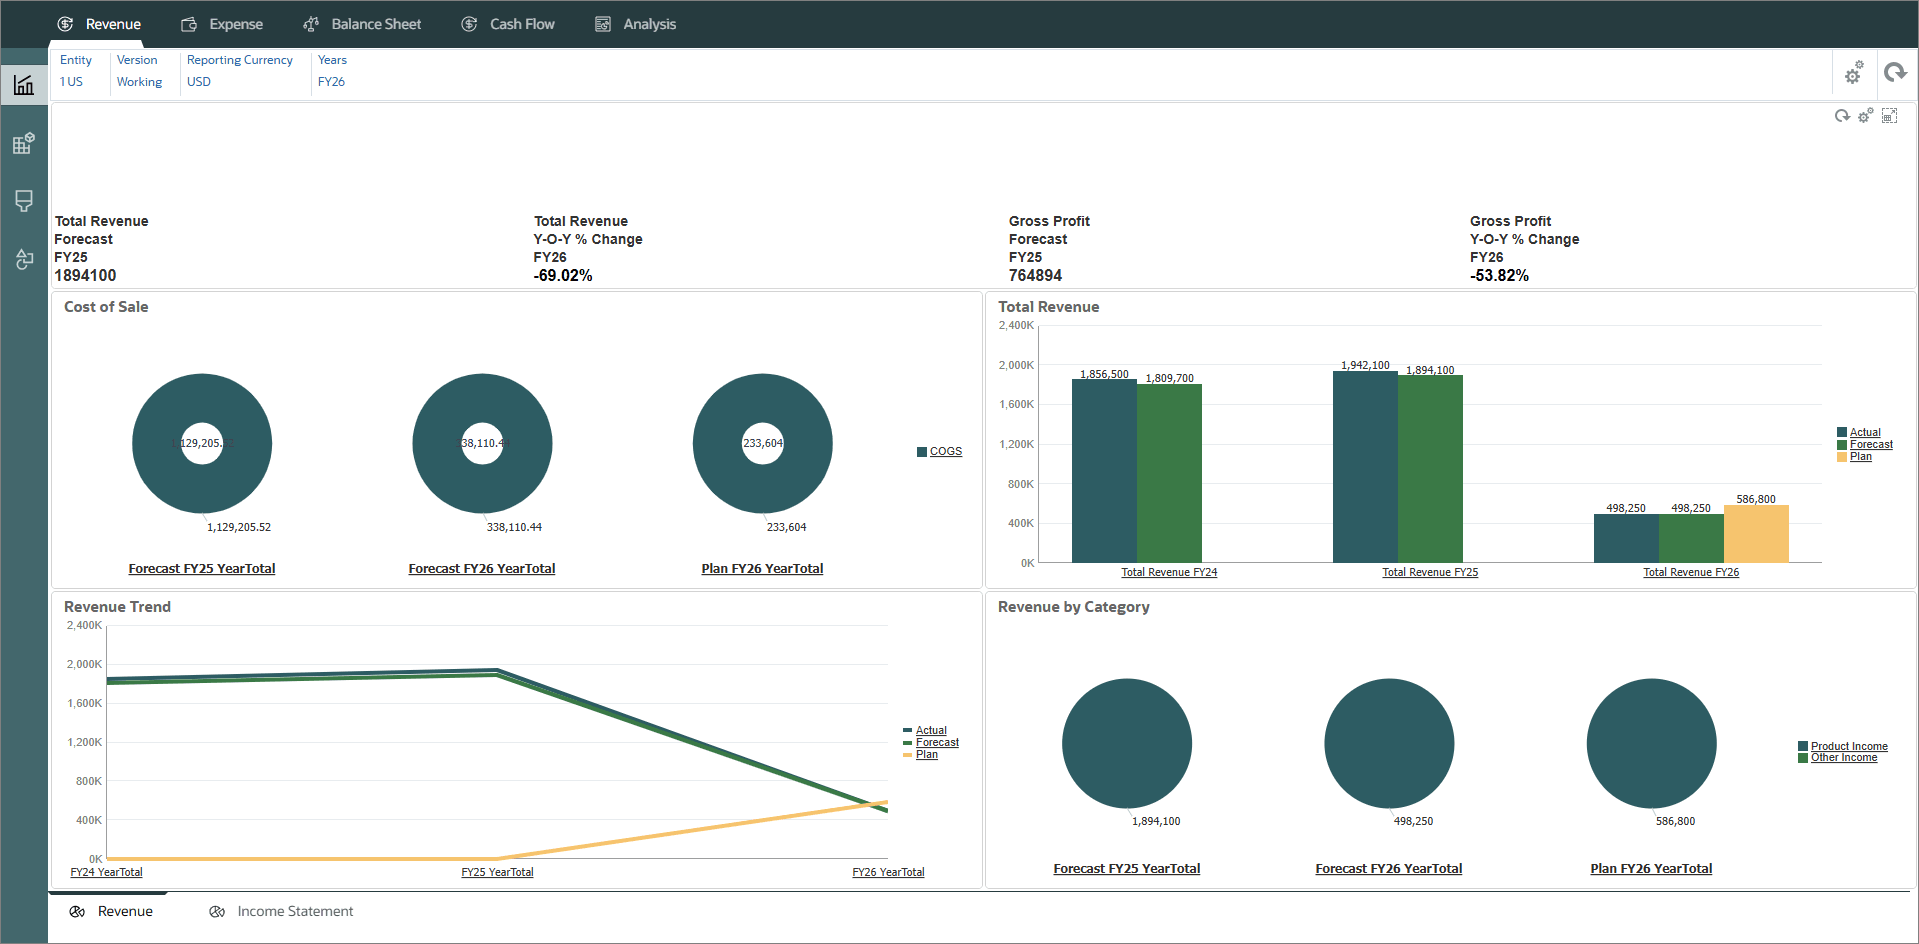
The Revenue Overview dashboard now displays Actual, Plan, and Forecast data. The dashboard also displays key performance indicators for revenue.
Related Links
More Learning Resources
Explore other labs on docs.oracle.com/learn or access more free learning content on the Oracle Learning YouTube channel. Additionally, visit Oracle University to view training resources available.
For product documentation, visit Oracle Help Center.