Getting Started with the APEX Graph Visualization Plug-in
This section helps you get started with the Graph Visualization plug-in in your APEX application.
Before you get started, ensure that your APEX workspace meets the following requirements:
-
The target application into which you want to import the plug-in exists.
-
The target application is connected to Oracle AI Database 26ai.
-
The SQL property graph to be used for visualization exists in the default database schema.
Using the command editor in the SQL Workshop component, you can create a SQL property graph using the
CREATE PROPERTY GRAPHDDL statement (see Using the Command Editor). -
The Graph Visualization plug-in version in the Oracle APEX 24.2 GitHub repository is supported only on APEX 24.2 version.
-
Download the Graph Visualization (Preview) plug-in (
region_type_plugin_graphviz.sql) from the Oracle APEX GitHub repository. -
Sign in to your APEX workspace (see Signing In to Your Workspace).
-
Create the
DBMS_GVTpackage and theAPEX_SQLGRAPH_JSONfunction in your APEX workspace.-
Download the
required-for-26ai/gvt_sqlgraph_to_json.sqlfile from the Oracle APEX GitHub repository. -
Upload and run the
gvt_sqlgraph_to_json.sqlscript in your APEX workspace (see Uploading a SQL Script). -
Download the
required-for-26ai/required_helper_functions.sqlfile from the Oracle APEX GitHub repository and run the script in your APEX workspace.
-
-
Import the downloaded plug-in script (
region_type_plugin_graphviz.sql) file into your target APEX application (see Importing Plug-ins). -
Implement the plug-in in an application page to perform various graph visualizations.
The following basic example describes the steps to visualize a graph existing in your database using the Graph Visualization plug-in.
-
Open the application page in Page Designer.
-
Select the Rendering tab on the left pane of the Page Designer.
-
Right-click an existing component and add a new region component.
-
Select the new region and configure the following attributes in the Region tab of the Property Editor on the right pane of the Page Designer:
-
Enter the Identification Title.
-
Select Graph Visualization (Preview) as Identification Type.
-
Select the source Location as Local Database.
-
Select the Type value.
You can choose either SQL Query or PropertyGraph as the Type value.
-
Embed the SQL graph query to retrieve the graph data.
Depending on the type selected in the previous step, you can provide the query as shown in the following examples:
-
SQL Query: Enter the SQL graph query input as shown:
SELECT * FROM GRAPH_TABLE ( BANK_SQL_PG MATCH (a IS accounts) -[e IS transfers]-> (b IS accounts) WHERE a.id = 816 COLUMNS(vertex_id(a) AS id_a, edge_id(e) AS id_e, vertex_id(b) AS id_b) ) -
PropertyGraph : Provide the SQL graph query as shown:
-
Graph Name: Select the SQL property graph name.
-
Match Clause: Enter the
MATCHclause of the graph query. For example:(a IS accounts) -[e IS transfers]-> (b IS accounts) -
Columns Clause: Enter the
COLUMNSclause of the graph query. For example:(vertex_id(a) AS id_a, edge_id(e) AS id_e, vertex_id(b) AS id_b) -
Where Clause: Optionally, enter the
WHEREclause of the query. For example,a.id = 816.
-
-
-
-
Run the application page to visualize the graph rendered by the plugin.
-
Figure: Visualizing a SQL Graph Query in an APEX Application
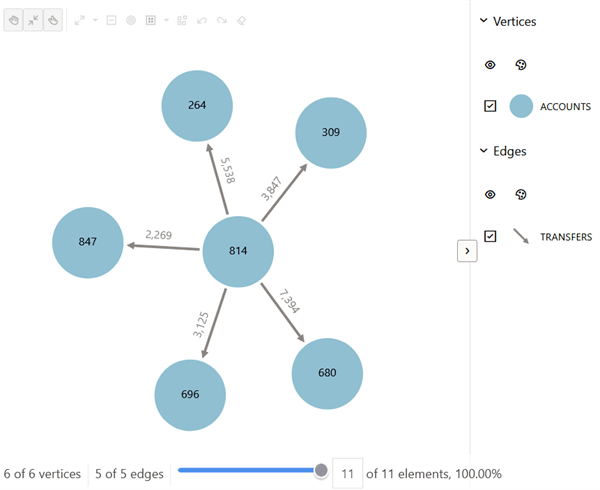
Description of the illustration apex_gviz_basic_graph.png
Note: The APEX Graph Visualization plug-in on Oracle AI Database 26ai does not support graphs that use vertex or edge keys with DATE or TIMESTAMP data types. Visualizing graph query results on graphs with DATE or TIMESTAMP keys may result in only a subset of graph data being shown.
-
Optionally, you can visualize the underlying database schema for the property graph that is used in the SQL graph query.
-
Go to the Schema panel in the Attributes tab of the Property Editor.
-
Enable Schema Visualization.
-
Enter Graph Owner and Graph Name.
The owner and name of the graph must match those used in the SQL graph query.
If the graph is not qualified with the schema name in the SQL graph query, then the graph owner is the current schema that is associated with the APEX application workspace.
-
Save and rerun the application page.
-
Click Schema View in the graph visualization toolbar.
The schema visualization is shown alongside the SQL property graph query visualization. as shown:
-
Figure: Graph Schema Visualization
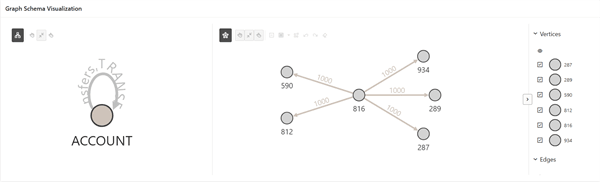
Description of the illustration apex_schema_viz.png
- Optionally, you can control the display size of the graph by dynamically changing the number of elements to be displayed in the graph.
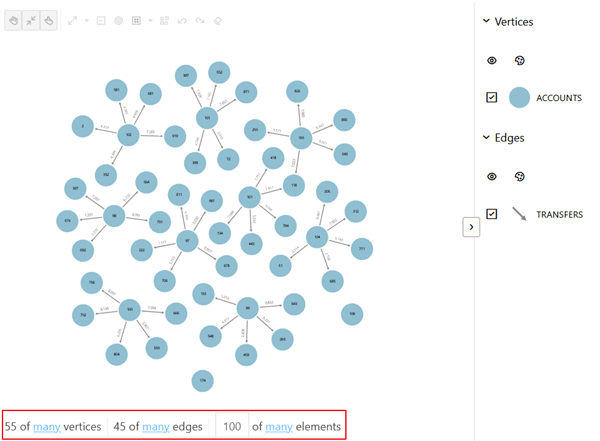
If the Show Display Size Control is switched ON in the Appearance panel, then the graph display size is rendered at the bottom of the graph visualization as shown:
Figure: Customizing the Graph Display Size
Description of the illustration apex_display_size.png
In the preceding figure:
-
54 of many vertices: This indicates 54 vertices are displayed and
manyindicates the total number of vertices in the graph. -
46 of many edges: This indicates 46 edges are displayed and
manyindicates the total number of edges in the graph. -
100 of many elements: This indicates 100 elements are displayed and
manyindicates the total number of graph elements. The initial value depends on the Display Size configuration in the Settings panel.
See Managing the Display Size of the Graph on the various actions supported for customizing the graph display size.
- Optionally, you can import and run the Sample Graph Visualizations application from Oracle APEX GitHub repository.
- Importing the Sample Graph Visualizations Application in APEX
The Sample Graph Visualizations application demonstrates the use of the Graph Visualization plug-in.
Importing the Sample Graph Visualizations Application in APEX
The Sample Graph Visualizations application demonstrates the use of the Graph Visualization plug-in.
Perform the following steps to import the Sample Graph Visualizations application:
-
Download the Sample Graph Visualizations application from Oracle APEX GitHub repository.
-
Create the
DBMS_GVTpackage if it is not already added in your APEX workspace.-
Download the
required-for-26ai/gvt_sqlgraph_to_json.sqlfile from the Oracle APEX GitHub repository. -
Upload and run the
gvt_sqlgraph_to_json.sqlscript in your APEX workspace (see Uploading a SQL Script). -
Download the
required-for-26ai/required_helper_functions.sqlfile from the Oracle APEX GitHub repository and run the script in your APEX workspace.
-
-
Import the
sample-apps/sample-graph-visualizations/sample-graph-visualizations_26ai.sqlinto your APEX instance and install the application by following the steps in Importing an Application.When installing the sample application, ensure that you have the
CREATE VIEW,CREATE MATERIALIZED VIEW, andCREATE TRIGGERprivilege for installing the supporting objects.You can directly run the sample application once it is installed.
Figure: Sample Graph Visualization Home Page
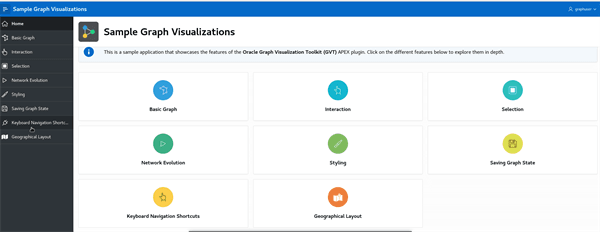
Also, note that the sample application requires a secure HTTPS connection. If you want to disable secure connection, then perform the following steps:
Caution: It is not recommended to disable secure connections in production deployment.
-
Navigate to the sample application home page in App Builder.
-
Click Shared Components.
-
Click Authentication Schemes under Security.
-
Click the Current authentication scheme.
-
Click the Session Sharing tab and turn off the Secure switch.
-
Click Apply Changes and then run the application.