3 Problem Detection and Reporting
This chapter provides information about problem detection and reporting by the platform operating system and the ELAP application.
Detecting and Reporting Problems
Problems are detected and reported by the platform operating system and the ELAP application.
The E5-APP-B card platform constantly monitors its operational status using the System Health Check utility syscheck. This utility can be initiated also by the user. For more details about syscheck, see System Health Check Overview.
E5-APP-B Card LEDs
This section describes the LEDs found on the front face of the E5-APP-B card.
Server Panel LEDs
Figure 3-1 shows the E5-APP-B card LEDs on the front panel
Figure 3-1 E5-APP-B Card LEDs
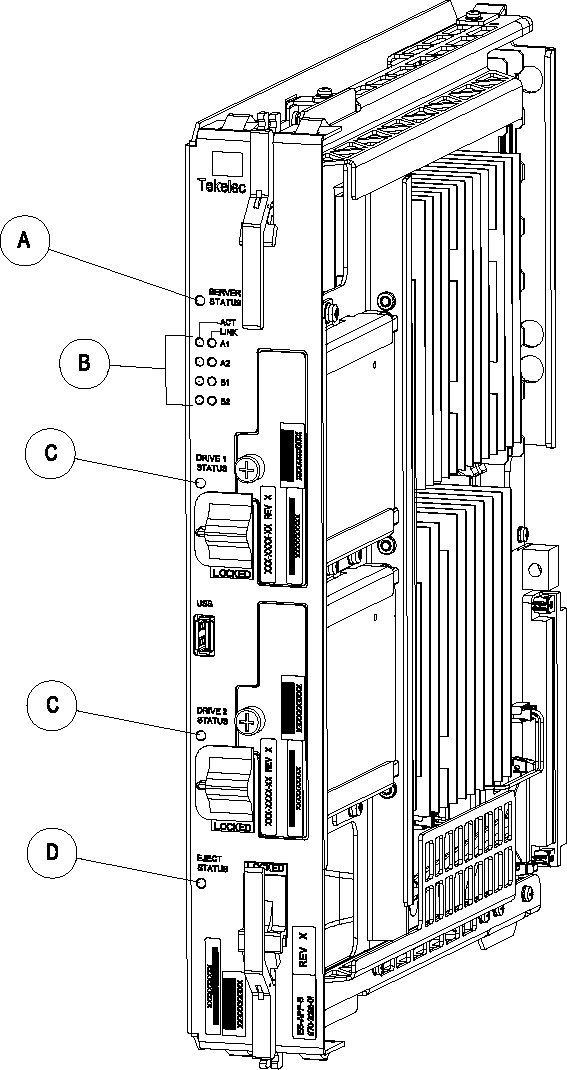
The following light-emitting diode (LED) status indicators can be found on the E5-APP-B card:
- One Server Status indicator (A)
- Four E-Net link and Active LED status indicators (B)
- Two drive module status indicators (C)
- One Card Eject status indicator (D)
Table 3-1 E5-APP-B LED Table
| LED Name | HW/SW Controlled | Description |
|---|---|---|
| Server Status | SW |
Solid Red - Server is halted Flashing Red - Server is booting Solid Amber - TKLC configuration beginning Solid Green - TPD loaded/operational state Flashing Green - Server is shutting down |
| Drive 1 Status | SW/HW |
HW: Flashing Green - Drive activity SW: Flashing Red - Impending drive removal SW: Steady red - Drive ready for removal |
| Drive 2 Status | SW/HW |
HW: Flashing Green - Drive activity SW: Flashing Red - Impending drive removal SW: Steady red - Drive ready for removal |
| Eject Status | SW |
Red - Card ready for extraction Flashing Red - Card preparing for extraction Off - Card is not ready for extraction |
| Act LED A1 | HW | Flashing Green - Link Activity |
| Act LED A2 | HW | Flashing Green - Link Activity |
| Act LED B1 | HW | Flashing Green - Link Activity |
| Act LED B2 | HW | Flashing Green - Link Activity |
| Link LED A1 | HW |
Green - 10/100 Link Speed Amber - 1000 Link Speed |
| Link LED A2 | HW |
Green - 10/100 Link Speed Amber - 1000 Link Speed |
| Link LED B1 | HW |
Green - 10/100 Link Speed Amber - 1000 Link Speed |
| Link LED B2 | HW |
Green - 10/100 Link Speed Amber - 1000 Link Speed |
Displaying Errors on ELAP GUI
If the ELAP application detects an application error or receives an alarm message from the platform layer, the ELAP application displays the error on the graphical user interface (GUI):
- With a text message running across the banner.
- By illuminating the alarm level indicator on the GUI that corresponds to the alarm level of the error. If that alarm level indicator is already illuminated, the number shown on the indicator is incremented. For details about the alarms represented by the indicator, click the alarm button.
**INTERNAL XREF ERROR** shows an example of errors displayed on the ELAP GUI.
Figure 3-2 Errors displayed on ELAP GUI

To obtain additional information about the alarms, click any lighted alarm indicator. A pop-up window is displayed, showing the number of each type of alarm and listing the text of each existing alarm in each type. **INTERNAL XREF ERROR** shows an example.
Figure 3-3 Viewing Alarm Details

When an alarm value in the Alarm View popup window represents multiple alarms, the text of each alarm being reported is displayed. The individual alarm text is found in Alarm Categories. To correct the alarm condition, perform the associated procedure described in Recovering From Alarms.
Alarm values reported in **INTERNAL XREF ERROR** may represent multiple alarms. To determine which alarms are indicated, perform Decode Alarm Strings. After determining which alarms are being reported, find the individual alarm numbers in Platform and Application Alarms.
Unsolicited Alarm and Information Messages
The EAGLE displays only one alarm per ELAP at a time based on the highest priority. If a single error is detected, the ELAP application sends an error message to the EAGLE terminal to report the active alarm category. If multiple errors are detected, the ELAP application sends an error message to the EAGLE terminal to report the most severe active alarm category.
If multiple alarms of the same severity exist and their severity is the highest alarm severity currently active, a combination alarm code is sent to the EAGLE. The EAGLE issues the appropriate UAM to the operator.
Errors detected in the hardware and software are reported by the following UAMs, which are described in greater detail in the EAGLE Unsolicited Alarm and Information Messages Reference.
- Critical Platform Alarms are reported by the EAGLE in UAM 0370.
-
Critical Application Alarms are reported to the EAGLE in UAM 0371.
-
Major Platform Alarms are reported to the EAGLE in UAM 0372.
-
Major Application Alarms are reported to the EAGLE in UAM 0373.
-
Minor Platform Alarms are reported to the EAGLE in UAM 0374.
-
Minor Application Alarms are reported to the EAGLE in UAM 0375.
When all error conditions are corrected for all platform and application errors, the operator receives this UAM:
UAM 0250 MPS available.
For information about the alarm data contained in UAMs, see Platform and Application Alarms.