5 Platform and Application Alarms
This chapter provides recovery procedures for platform and application alarms related to the E5-APP-B.
Alarm Categories
This chapter describes recovery procedures to use when an alarm condition or other problem exists on the MPS system. For information about how and when alarm conditions are detected and reported, see Detecting and Reporting Problems.
When an alarm code is reported, locate the alarm in Platform and Application Alarms. The procedures for correcting alarm conditions are described in Platform and Application Alarms.
Note:
Sometimes the alarm string may consist of multiple alarms and must be decoded in order to use the Alarm Recovery Procedures in this manual. If the alarm code is not listed, see Decode Alarm Strings.-
Critical Platform Alarms
-
Critical Application Alarms
-
Major Platform Alarms
-
Major Application Alarms
-
Minor Platform Alarms
-
Minor Application Alarms
Table 5-1 shows the alarm numbers and alarm text for all alarms generated by the MPS platform and the ELAP application. The order within a category is not significant. Some of the alarms described in this chapter are not available with specific configurations.
Table 5-1 Platform and Application Alarms
MPS Alarm Recovery Procedures
This section provides recovery procedures for the MPS and ELAP alarms, listed by alarm category and Alarm Code (alarm data string) within each category.
Critical Platform Alarms
Critical platform alarms are issued if uncorrectable memory problems are detected.
1000000000002000 - Uncorrectable ECC Memory Error
This alarm indicates that chipset has detected an uncorrectable (multiple-bit) memory error that the Error-Correcting Code (ECC) circuitry in the memory is unable to correct.
Recovery
- Contact unresolvable-reference.html#GUID-A2C37E16-F0BA-4FB6-9D93-1D4A95A40DC7 to request hardware replacement.
1000000000008000 – Server NTP Daemon lost NTP synchronization for extended time
Alarm Type: TPD
Description: This alarm indicates that a TPD syscheck test determined that the time last synchronized with an NTP server has exceeded the critical threshold (LAST_SYNCHRONIZED_TIME_PERIOD_CRITICAL), as configured by the application.
Severity: Critical
Alarm ID: TKSPLATCR16
Recovery
Contact unresolvable-reference.html#GUID-A2C37E16-F0BA-4FB6-9D93-1D4A95A40DC7.
1000000000010000 – Server's time has gone backwards
Alarm Type: TPD
Description: This alarm indicates that syscheck determined that a server's time has gone backwards.
Severity: Critical
Alarm ID: TKSPLATCR17
Recovery
Contact unresolvable-reference.html#GUID-A2C37E16-F0BA-4FB6-9D93-1D4A95A40DC7.
Critical Application Alarms
This section describes the critical application alarms.
2000000000000001 - LSMS DB Maintenance Required
This alarm indicates that database maintenance is required.
Recovery
- Call unresolvable-reference.html#GUID-A2C37E16-F0BA-4FB6-9D93-1D4A95A40DC7 for assistance.
Major Platform Alarms
Major platform alarms involve hardware components, memory, and network connections.
3000000000000001 – Server fan failure
Alarm Type: TPD
Description: This alarm indicates that a fan on the application server is either failing or has failed completely. In either case, there is a danger of component failure due to overheating.
Description: This alarm indicates that a fan in the EAGLE fan tray in the EAGLE shelf where the E5-APP-B is "jacked in" is either failing or has failed completely. In either case, there is a danger of component failure due to overheating.
Severity: Major
OID: TpdFanErrorNotify 1.3.6.1.4.1.323.5.3.18.3.1.2.1
Alarm ID: TKSPLATMA13000000000000001
Recovery
Note:
3000000000000002 - Server Internal Disk Error
This alarm indicates that the server is experiencing issues replicating data to one or more of its mirrored disk drives. This could indicate that one of the server disks has failed or is approaching failure.
Recovery
3000000000000008 - Server Platform Error
This alarm indicates a major platform error such as a corrupt system configuration or missing files, or indicates that syscheck itself is corrupt.
Recovery
3000000000000010 - Server File System Error
This alarm indicates that syscheck was unsuccessful in writing to at least one of the server file systems.
Recovery
- Call unresolvable-reference.html#GUID-A2C37E16-F0BA-4FB6-9D93-1D4A95A40DC7 for assistance.
3000000000000020 - Server Platform Process Error
This alarm indicates that either the minimum number of instances for a required process are not currently running or too many instances of a required process are running.
Recovery
- Contact unresolvable-reference.html#GUID-A2C37E16-F0BA-4FB6-9D93-1D4A95A40DC7 for recovery procedures.
3000000000000080 - Server Swap Space Shortage Failure
This alarm indicates that the server’s swap space is in danger of being depleted. This is usually caused by a process that has allocated a very large amount of memory over time.
Note:
In order for this alarm to clear, the underlying failure condition must be consistently undetected for a number of polling intervals. Therefore, the alarm may continue to be reported for several minutes after corrective actions are completed.Recovery
- Call unresolvable-reference.html#GUID-A2C37E16-F0BA-4FB6-9D93-1D4A95A40DC7 for assistance.
3000000000000100 - Server provisioning network error
Alarm Type: TPD
Note:
The interface identified as eth01 on the hardware is identified as eth91 by the software (in syscheck output, for example).Severity: Major
OID: TpdProvNetworkErrorNotify 1.3.6.1.4.1.323.5.3.18.3.1.2.9
Alarm ID: TKSPLATMA93000000000000100
Recovery
- Perform the following substeps to verify that the network configuration is correct.
- Verify that a customer-supplied cable labeled TO CUSTOMER NETWORK is securely connected to the appropriate server. Follow the cable to its connection point on the local network and verify this connection is also secure.
- Test the customer-supplied cable labeled TO CUSTOMER NETWORK with an Ethernet Line Tester. If the cable does not test positive, replace it.
- Have your network administrator verify that the network is functioning properly.
- If no other nodes on the local network are experiencing problems and the fault has been isolated to the server or the network administrator is unable to determine the exact origin of the problem, contact unresolvable-reference.html#GUID-A2C37E16-F0BA-4FB6-9D93-1D4A95A40DC7.
3000000000000200 – Server Eagle Network A error
Alarm Type: TPD
Description: This alarm is generated by the MPS syscheck software package and is not part of the TPD distribution.
Note:
If these three alarms exist, the probable cause is a failed mate server.-
3000000000000200-Server Eagle Network A Error
-
3000000000000400-Server Eagle Network B Error
-
3000000000000800-Server Sync Network Error
-
One or both of the servers is not operational.
-
One or both of the switches is not powered on.
-
The link between the switches is not working.
-
The connection between server A and server B is not working.
-
The eth01 interface (top ethernet port on the rear of the server) connects to the customer provisioning network.
-
The eth02 interface (2nd from top ethernet port on the rear of the server) connects to port 3 of switch A.
-
The eth03 interface (2nd from bottom ethernet port on the rear of the server) connects to port 3 of switch B.
-
The eth04 interface (bottom ethernet port on the rear of the server) connects to port 5 of switch A
-
The interfaces on the switch are ports 1 through 20 (from left to right) located on the front of the switch.
-
Ports 1 and 2 of switch A connect to ports 1 and 2 of switch B.
-
Ports 7 to 24 of switch A and ports 5 through 24 of switch B can be used for links to the Main SM ports (SM A ports) on the EAGLE.
Severity: Major
OID: 1.3.6.1.4.1.323.5.3.18.3.1.2.10
Alarm ID: TKSPLATMA103000000000000200
Recovery
3000000000000400 – Server Eagle Network B error
Alarm Type: TPD
Description: This alarm is generated by the MPS syscheck software package and is not part of the TPD distribution.
Note:
If these three alarms exist, the probable cause is a failed mate server.- 3000000000000200-Server Eagle Network A Error
- 3000000000000400-Server Eagle Network B Error
- 3000000000000800-Server Sync Network Error
- One or both of the servers is not operational.
- One or both of the switches is not powered on.
- The link between the switches is not working.
- The connection between server A and server B is not working.
- The eth01 interface (top ethernet port on the rear of the server) connects to the customer provisioning network.
- The eth02 interface (2nd from top ethernet port on the rear of the server) connects to port 4 of switch A.
- The eth03 interface (2nd from bottom ethernet port on the rear of the server) connects to port 4 of switch B.
- The eth04 interface (bottom ethernet port on the rear of the server) connects to port 6 of switch A.
- The interfaces on the switch are ports 1 through 20 (from left to right) located on the front of the switch.
- Ports 1 and 2 of switch A connect to ports 1 and 2 of switch B.
- Ports 7 to 24 of switch A and ports 5 through 24 of switch B can be used for links to the Main SM ports (SM A ports) on the EAGLE.
Severity: Major
OID: 1.3.6.1.4.1.323.5.3.18.3.1.2.11
Alarm ID: TKSPLATMA113000000000000400
Recovery
3000000000000800 – Server Sync network error
Alarm Type: TPD
Description: This alarm is generated by the MPS syscheck software package and is not part of the TPD distribution.
Note:
If these three alarms exist, the probable cause is a failed mate server.-
3000000000000200-Server Eagle Network A Error
-
3000000000000400-Server Eagle Network B Error
-
3000000000000800-Server Sync Network Error
Note:
The sync interface uses eth03 and goes through switch B. All pairs are required.Severity: Major
OID: 1.3.6.1.4.1.323.5.3.18.3.1.2.12
Alarm ID: TKSPLATMA123000000000000800
Recovery
- Verify that both servers are booted up by ensuring that the POWER LEDs on both servers are illuminated green.
- Perform the following substeps to verify that the network configuration is correct.
- If the problem persists, contact unresolvable-reference.html#GUID-A2C37E16-F0BA-4FB6-9D93-1D4A95A40DC7.
3000000000001000 - Server Disk Space Shortage Error
This alarm indicates that one of the following conditions has occurred:
-
A file system has exceeded a failure threshold, which means that more than 90% of the available disk storage has been used on the file system.
-
More than 90% of the total number of available files have been allocated on the file system.
-
A file system has a different number of blocks than it had when installed.
Recovery
- Run
syscheck(see Running syscheck Through the ELAP GUI). - Examine the syscheck output to determine if the file system
/var/TKLC/epap/free/var/TKLC/elap/freeis low on space. If it is, continue to the next step; otherwise go to 4. - If possible, recover space on the free partition by deleting unnecessary files:
- Select Debug>Manage Logs & Backups. A screen similar to Figure 5-1 is displayed. This screen displays information about the total amount of space allocated for and currently used by logs and backups. The display includes logs and backup files which might be selected for deletion to recover additional disk space.
Figure 5-1 Manage Logs and Backups

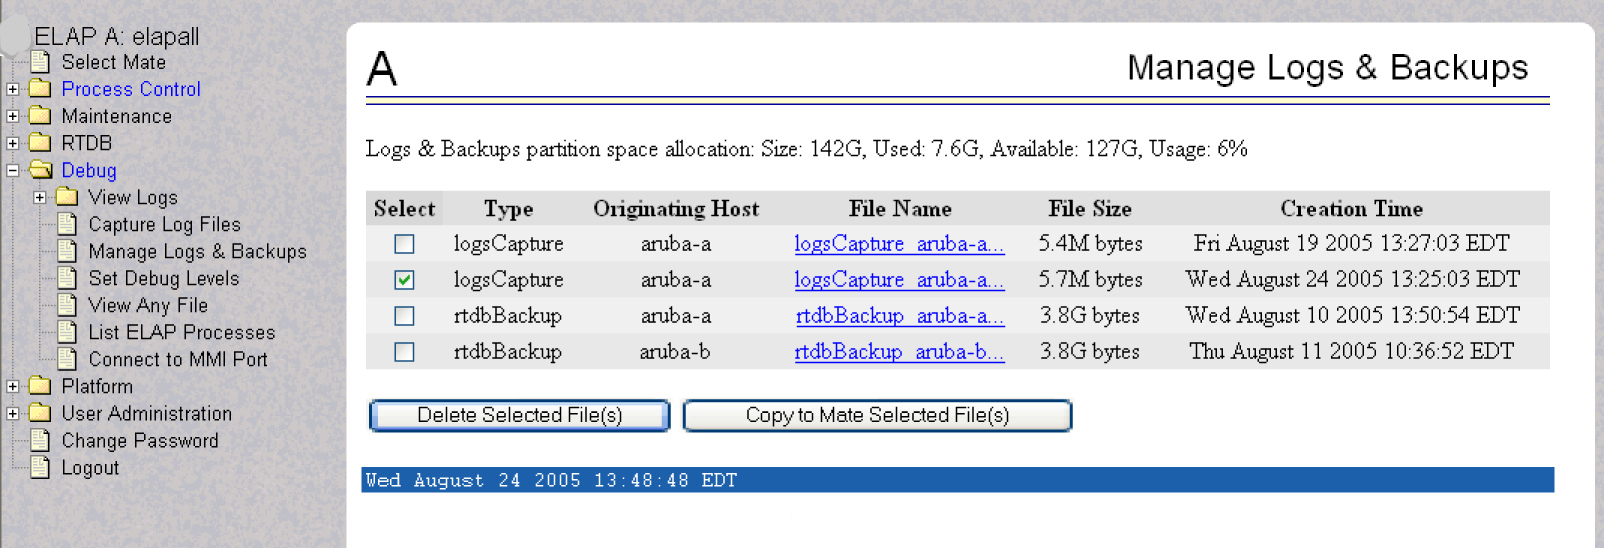
- Select Debug>Manage Logs & Backups.
- Call unresolvable-reference.html#GUID-A2C37E16-F0BA-4FB6-9D93-1D4A95A40DC7 for assistance.
3000000000002000 - Server Default Route Network Error
This alarm indicates that the default network route of the server is experiencing a problem. Running syscheck in Verbose mode will provide information about which type of problem.
Caution:
When changing the network routing configuration of the server, verify that the modifications will not impact the method of connectivity for the current login session. The route information must be entered correctly and set to the correct values. Incorrectly modifying the routing configuration of the server may result in total loss of remote network access.Recovery
- Perform the following substeps when
syscheckVerbose output indicates:The default route is not on the provisioning network- Select Maintenance>LSMS Connection>Change Allowed: a window similar to the example shown in Figure 5-4 displays.
Figure 5-2 Enable LSMS Connection Window

- Click the Enable LSMS Connection button.
After the connection is enabled, the workspace displays the information shown in Figure 5-3.
Figure 5-3 LSMS Connection Enabled

This procedure is complete.
- Select Maintenance>LSMS Connection>Change Allowed: a window similar to the example shown in Figure 5-4 displays.
- Perform the following substeps to reboot the server if the
syscheckVerbose output indicates the following error:An active route cannot be found for a configured default route, . .- Select Maintenance>LSMS Connection>Change Allowed: a window similar to the example shown in Figure 5-4 displays.
Figure 5-4 Enable LSMS Connection Window

- Click the Enable LSMS Connection button.
After the connection is enabled, the workspace displays the information shown in Figure 5-5.
Figure 5-5 LSMS Connection Enabled

This procedure is complete.
- Select Maintenance>LSMS Connection>Change Allowed: a window similar to the example shown in Figure 5-4 displays.
3000000000004000 - Server Temperature Error
Alarm Type: TPD
Description: The internal temperature within the server is unacceptably high.
Severity: Major
OID: TpdTemperatureErrorNotify 1.3.6.1.4.1.323.5.3.18.3.1.2.15
Alarm ID: TKSPLATMA153000000000004000
Recovery
3000000000008000 - Server Mainboard Voltage Error
This alarm indicates that at least one monitored voltages on the server mainboard is not within the normal operating range.
Recovery
- Contact unresolvable-reference.html#GUID-A2C37E16-F0BA-4FB6-9D93-1D4A95A40DC7 for assistance.
3000000000010000 - Server Power Feed Error
This alarm indicates that one of the power feeds to the server has failed.
Recovery
3000000000020000 - Server Disk Health Test Error
This alarm indicates that the hard drive has failed or failure is imminent.
Recovery
- Immediately contact unresolvable-reference.html#GUID-A2C37E16-F0BA-4FB6-9D93-1D4A95A40DC7 for assistance with a disk replacement.
3000000000040000 - Server Disk Unavailable Error
This alarm indicates that the smartd service is not able to read the disk status because the disk has other problems that are reported by other alarms. This alarm appears only while a server is booting.
Recovery
- Perform the recovery procedures for the other alarms that accompany this alarm.
3000000000080000 - Device Error
This alarm indicates that the offboard storage server has a problem with its disk volume filling.
Recovery
- Call unresolvable-reference.html#GUID-A2C37E16-F0BA-4FB6-9D93-1D4A95A40DC7 for assistance.
3000000000100000 - Device Interface Error
This alarm indicates that the IP bond is either not configured or not functioning.
Recovery
- Call unresolvable-reference.html#GUID-A2C37E16-F0BA-4FB6-9D93-1D4A95A40DC7 for assistance.
3000000000200000 - Correctable ECC Memory Error
This alarm indicates that chipset has detected a correctable (single-bit) memory error that has been corrected by the Error-Correcting Code (ECC) circuitry in the memory.
Recovery
3000000400000000 - Multipath device access link problem
Alarm Type: TPD
Description: One or more "access paths" of a multipath device are failing or are not healthy, or the multipath device does not exist.
Severity: Major
OID: TpdMpathDeviceProblemNotify1.3.6.1.4.1.323.5.3.18.3.1.2.35
Alarm ID: TKSPLATMA353000000400000000
Recovery
- unresolvable-reference.html#GUID-A2C37E16-F0BA-4FB6-9D93-1D4A95A40DC7 should do the following:
- Contact unresolvable-reference.html#GUID-A2C37E16-F0BA-4FB6-9D93-1D4A95A40DC7.
3000000800000000 – Switch Link Down Error
This alarm indicates that the switch is reporting that the link is down. The link that is down is reported in the alarm. For example, port 1/1/2 is reported as 1102.
Recovery Procedure:
- Verify cabling between the offending port and remote side.
- Verify networking on the remote end.
- If problem persists, contact unresolvable-reference.html#GUID-A2C37E16-F0BA-4FB6-9D93-1D4A95A40DC7 to verify port settings on both the server and the switch.
3000001000000000 - Half-open Socket Limit
Alarm Type: TPD
Description:This alarm indicates that the number of half open TCP sockets has reached the major threshold. This problem is caused by a remote system failing to complete the TCP 3-way handshake.
Severity: Major
OID: tpdHalfOpenSocketLimit 1.3.6.1.4.1.323.5.3.18.3.1.2.37
Alarm ID: TKSPLATMA37 3000001000000000
Recovery
3000002000000000 - Flash Program Failure
Alarm Type: TPD
Description: This alarm indicates there was an error while trying to update the firmware flash on the E5-APP-B cards.
Severity: Major
OID: tpdFlashProgramFailure 1.3.6.1.4.1.323.5.3.18.3.1.2.38
Alarm ID: TKSPLATMA383000002000000000
Recovery
3000004000000000 - Serial Mezzanine Unseated
Alarm Type: TPD
Description:This alarm indicates the serial mezzanine board was not properly seated.
Severity: Major
OID: tpdSerialMezzUnseated 1.3.6.1.4.1.323.5.3.18.3.1.2.39
Alarm ID: TKSPLATMA393000004000000000
Recovery
3000000008000000 - Server HA Keepalive Error
This alarm indicates that heartbeat process has detected that it has failed to receive a heartbeat packet within the timeout period.
Recovery
- Determine if the mate server is currently operating. If the mate server is not operating, attempt to restore it to operation.
- Determine if the keepalive interface is operating.
- Determine if heartbeart is running (service TKLCha status).
- Call unresolvable-reference.html#GUID-A2C37E16-F0BA-4FB6-9D93-1D4A95A40DC7 for assistance.
3000000010000000 - DRBD block device can not be mounted
This alarm indicates that DRBD is not functioning properly on the local server. The DRBD state (disk state, node state, or connection state) indicates a problem.
Recovery
- Call unresolvable-reference.html#GUID-A2C37E16-F0BA-4FB6-9D93-1D4A95A40DC7 for assistance.
3000000020000000 - DRBD block device is not being replicated to peer
This alarm indicates that DRBD is not replicating to the peer server. Usually this alarm indicates that DRBD is not connected to the peer server. A DRBD Split Brain may have occurred.
Recovery
- Determine if the mate server is currently operating.
- Call unresolvable-reference.html#GUID-A2C37E16-F0BA-4FB6-9D93-1D4A95A40DC7 for assistance.
3000000040000000 - DRBD peer needs intervention
This alarm indicates that DRBD is not functioning properly on the peer server. DRBD is connected to the peer server, but the DRBD state on the peer server is either unknown or indicates a problem.
Recovery
- Call unresolvable-reference.html#GUID-A2C37E16-F0BA-4FB6-9D93-1D4A95A40DC7 for assistance.
3000020000000000 - Server NTP Daemon never synchronized
Alarm Type: TPD
Description: This alarm indicates that the NTP sync file (/var/TKLC/log/syscheck/ntp_sync_config) and the NTP last known good time file (/var/TKLC/log/syscheck/ntp_last_good_time) have not been synchronized.
Severity: Major
Alarm ID: TKSPLATMA42
Recovery
Contact unresolvable-reference.html#GUID-A2C37E16-F0BA-4FB6-9D93-1D4A95A40DC7.
Major Application Alarms
The major application alarms involve the ELAP software, RTDBs, file system, and logs.
4000000000000001 - Mate ELAP Unavailable
One ELAP has reported that the other ELAP is unreachable.
Recovery
4000000000000002 - RTDB Mate Unavailable
The local ELAP cannot use the direct link to the Standby for RTDB database synchronization.
Recovery
- Select RTDB>View RTDB Status to verify that the RTDB status on both sides is coherent, as shown in Figure 5-6.
Figure 5-6 Coherent RTDB Status


4000000000000004 - Congestion
The ELAP RTDB database record cache used to keep updates currently being provisioned is above 80% capacity.
Recovery
4000000000000008 - File System Full
This alarm indicates that the server file system is full.
Recovery
- Call unresolvable-reference.html#GUID-A2C37E16-F0BA-4FB6-9D93-1D4A95A40DC7 for assistance.
4000000000000010 - Log Failure
This alarm indicates that the system was unsuccessful in writing to at least one log file.
- Call unresolvable-reference.html#GUID-A2C37E16-F0BA-4FB6-9D93-1D4A95A40DC7 for assistance.
4000000000000040 - Fatal Software Error
A major software component on the ELAP has failed.
Recovery
- Perform Restarting the ELAP Software
- Capture the log files on both ELAPs (see Saving Logs Using the ELAP GUI) and contact unresolvable-reference.html#GUID-A2C37E16-F0BA-4FB6-9D93-1D4A95A40DC7.
4000000000000080 - RTDB Corrupt
A real-time database is corrupt. The calculated checksum did not match the checksum value stored for one or more records.
Recovery
- Capture the log files on both ELAPs (see Saving Logs Using the ELAP GUI) and contact unresolvable-reference.html#GUID-A2C37E16-F0BA-4FB6-9D93-1D4A95A40DC7.
4000000000000100 - RTDB Inconsistent
The real-time database for one or more Service Module cards is inconsistent with the current real-time database on the Active ELAP fixed disks.
Recovery
- Capture the log files on both ELAPs (see Saving Logs Using the ELAP GUI) and contact unresolvable-reference.html#GUID-A2C37E16-F0BA-4FB6-9D93-1D4A95A40DC7.
4000000000000200 - RTDB Incoherent
This message usually indicates that the RTDB database download is in progress.
When the download is complete, the following UIM message will appear:
0452 - RTDB reload complete
Recovery
- If this alarm displays while an RTDB download is in progress, no further action is necessary.
- If this alarm displays when an RTDB download is not in progress, capture the log files on both ELAPs (see Saving Logs Using the ELAP GUI) and contact unresolvable-reference.html#GUID-A2C37E16-F0BA-4FB6-9D93-1D4A95A40DC7.
4000000000001000 - RTDB 100% Full
The RTDB on the ELAP is at capacity. The ELAP RTDB is not updating.
You may be able to free up space by deleting unnecessary data in the database. The ELAP must be upgraded in order to add disk capacity.
Recovery
- Contact unresolvable-reference.html#GUID-A2C37E16-F0BA-4FB6-9D93-1D4A95A40DC7 for assistance.
4000000000002000 - RTDB Resynchronization In Progress
This message indicates that the RTDB resynchronization is in progress.
Recovery
- No further action is necessary.
4000000000004000 - RTDB Reload Is Required
This message indicates that the RTDB reload is required because the transaction logs did not contain enough information to resynchronize the databases (the transaction logs may be too small).
Caution:
If both sides are reporting this error, contact unresolvable-reference.html#GUID-A2C37E16-F0BA-4FB6-9D93-1D4A95A40DC7.
If only one side is reporting this error, use the following procedure.
Recovery
- Log in to the User Interface screen of the ELAP (see Accessing the ELAP Text Interface).
- Refer to LNP Database Synchronization for the correct procedures.
- If the problem persists, contact unresolvable-reference.html#GUID-A2C37E16-F0BA-4FB6-9D93-1D4A95A40DC7.
4000000000400000 - LVM Snapshot detected that is too old
Note:
LVM alarms are valid for ELAP 8.0 and later.This alarm indicates that an LVM snapshot has been present on the system for longer than 30 minutes. LVM snapshots should not exist for longer than 15 minutes or performance may be degraded as the LVM snapshot overfills with data.
The Logical Volume Manager (LVM) creates read-only snapshots of the database. These LVM snapshots are present when an audit of the LSMS database is active and when the database is being downloaded to EAGLE. An LVM snapshot provides rollback and recovery capability to the active database. All LVM snapshots are removed when no longer needed, or are removed and recreated when in continuous use such as during an LSMS audit which may last several hours.
Recovery
4000000000800000 - LVM Snapshot detected that is too full
This alarm usually occurs when an LVM snapshot has remained in existence too long and has a higher full percentage than expected; however, the alarm may occur also if an unusually large number of updates, distributed evenly across the entire database, have been received.
The Logical Volume Manager (LVM) creates read-only snapshots of the database. These LVM snapshots are present when an audit of the LSMS database is active and when the database is being downloaded to EAGLE. An LVM snapshot provides rollback and recovery capability to the active database. All LVM snapshots are removed when no longer needed, or are removed and recreated when in continuous use such as during an LSMS audit which may last several hours.
Recovery
4000000001000000 - LVM Snapshot detected with invalid attributes
An LVM snapshot has been detected with invalid attributes. This alarm may occur if an LVM snapshot cannot be removed completely due to an error in the LVM subsystem. Restarting the ELAP software may clear this condition.
Recovery
4000000002000000 - DRBD Split Brain
This alarm occurs when the ELAP A and B servers have simultaneous outages or if the three heartbeat paths are lost between the two servers. If either condition occurs, neither server can determine which server has the most recent copy of the database. The first system to recover becomes the HA active system. Manual action is required to determine which copy of the shared data is valid and to resynchronize with the other system.
Recovery
4000000010000000 - An instance of Snapmon already running
- prov1snap
- prov2snap
- auditsnap
- backupsnap
Recovery
Minor Platform Alarms
Minor platform alarms involve disk space, application processes, RAM, and configuration errors.
1000000000000001 – Breaker panel feed unavailable
Alarm Type: TPD
Description: This alarm is generated by the MPS syscheck software package and is not part of the TPD distribution. Refer to MPS-specific documentation for information regarding this alarm.
Severity: Critical
OID: 1.3.6.1.4.1.323.5.3.18.3.1.1.1
Alarm ID: TKSPLATCR1
Recovery
- See 910-5129-001 Rev. A, PM&C/T5100 Platform Troubleshooting Guide.
- Contact unresolvable-reference.html#GUID-A2C37E16-F0BA-4FB6-9D93-1D4A95A40DC7.
5000000000000001 - Server Disk Space Shortage Warning
This alarm indicates that one of the following conditions has occurred:
-
A file system has exceeded a warning threshold, which means that more than 80% (but less than 90%) of the available disk storage has been used on the file system.
-
More than 80% (but less than 90%) of the total number of available files have been allocated on the file system.
Recovery
- Run
syscheck(see Running syscheck Through the ELAP GUI) - Examine the
syscheckoutput to determine if the file system/var/TKLC/epap/free/var/TKLC/elap/freeis the one that is low on space. If the file system is low on disk space, continue to 3; otherwise go to 4. - You may be able to free up space on the free partition by deleting unnecessary files, as follows:
- Select Debug>Manage Logs & Backups.
A screen similar to Figure 5-7 is displayed. This screen displays information about the total amount of space allocated for and currently used by logs and backups. The display includes logs and backup files which might be selected for deletion to recover additional disk space.
Figure 5-7 Manage Logs and Backups

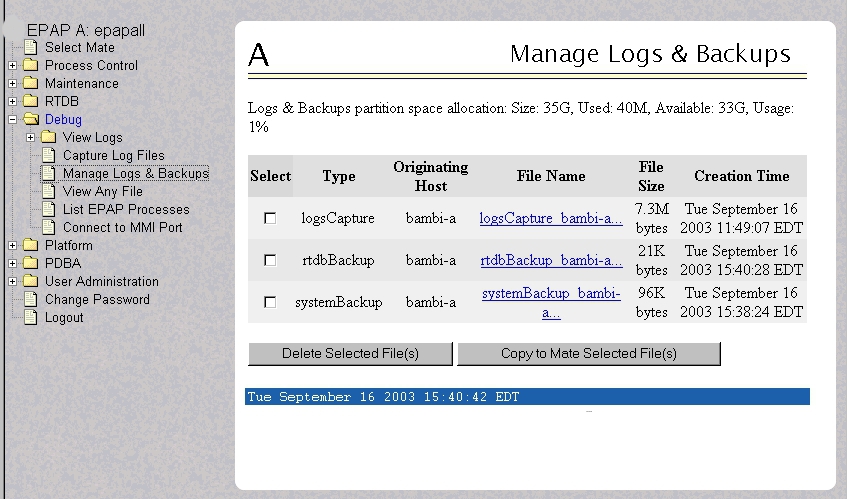
- Select Debug>Manage Logs & Backups.
- Call unresolvable-reference.html#GUID-A2C37E16-F0BA-4FB6-9D93-1D4A95A40DC7 for assistance.
5000000000000002 - Server Application Process Error
This alarm indicates that either the minimum number of instances for a required process are not currently running or too many instances of a required process are running.
Recovery
5000000000000004 - Server Hardware Configuration Error
Recovery
- Run
syscheckin verbose mode. - Call unresolvable-reference.html#GUID-A2C37E16-F0BA-4FB6-9D93-1D4A95A40DC7 for assistance.
5000000000000008 - Server RAM Shortage Warning
This alarm indicates one of two conditions:
- Less memory than the expected amount is installed.
- The system is swapping pages in and out of physical memory at a fast rate, indicating a possible degradation in system performance.
This alarm may not clear immediately when conditions fall below the alarm threshold. Conditions must be below the alarm threshold consistently for the alarm to clear. The alarm may take up to five minutes to clear after conditions improve.
Recovery
- Call unresolvable-reference.html#GUID-A2C37E16-F0BA-4FB6-9D93-1D4A95A40DC7 for assistance.
5000000000000020 - Server Swap Space Shortage Warning
This alarm indicates that the swap space available on the server is less than expected. This is usually caused by a process that has allocated a very large amount of memory over time.
Note:
In order for this alarm to clear, the underlying failure condition must be consistently undetected for a number of polling intervals. Therefore, the alarm may continue to be reported for several minutes after corrective actions are completed.Recovery
- Call unresolvable-reference.html#GUID-A2C37E16-F0BA-4FB6-9D93-1D4A95A40DC7 for assistance.
5000000000000040 - Server Default Router Not Defined
This alarm indicates that the default network route is either not configured or the current configuration contains an invalid IP address or hostname.
Caution:
When changing the server’s network routing configuration it is important to verify that the modifications will not impact the method of connectivity for the current login session. It is also crucial that this information not be entered incorrectly or set to improper values. Incorrectly modifying the server’s routing configuration may result in total loss of remote network access.
Recovery
- Perform the following substeps to restart the ELAP and enable the LSMS connection.
- Select Maintenance>LSMS Connection>Change Allowed: a window similar to the example shown in Figure 5-8 displays.
Figure 5-8 Enable LSMS Connection Window

- Click the Enable LSMS Connection button.
When the connection has been enabled, the workspace displays the information shown inFigure 5-9.sw
.Figure 5-9 LSMS Connection Enabled

- Select Maintenance>LSMS Connection>Change Allowed: a window similar to the example shown in Figure 5-8 displays.
5000000000000080 – Server temperature warning
Alarm Type: TPD
Description: This alarm indicates that the internal temperature within the server is outside of the normal operating range. A server Fan Failure may also exist along with the Server Temperature Warning.
Severity: Minor
OID: tpdTemperatureWarningNotify 1.3.6.1.4.1.323.5.3.18.3.1.3.8
Alarm ID: TKSPLATMI85000000000000080
Recovery
5000000000000100 - Server Core File Detected
This alarm indicates that an application process has failed and debug information is available.
Recovery
5000000000000200 - Server NTP Daemon Not Synchronized
This alarm indicates that the NTP daemon (background process) has been unable to locate a server to provide an acceptable time reference for synchronization.
Severity: Minor
Alarm ID: TKSPLATMI10
Recovery
5000000000000400 - Server CMOS Battery Voltage Low
The presence of this alarm indicates that the CMOS battery voltage has been detected to be below the expected value. This alarm is an early warning indicator of CMOS battery end-of-life failure which will cause problems in the event the server is powered off.
Recovery
5000000000000800 - Server Disk Self Test Warning
A non-fatal disk issue (such as a sector cannot be read) exists.
Recovery
5000000000001000 - Device Warning
This alarm indicates that either a snmpget cannot be performed on the configured SNMP OID or the returned value failed the specified comparison operation.
Recovery
- Run
syscheckin Verbose mode. (See Running the System Health Check.) - Call unresolvable-reference.html#GUID-A2C37E16-F0BA-4FB6-9D93-1D4A95A40DC7 for assistance.
5000000000002000 - Device Interface Warning
This alarm can be generated by either an SNMP trap or an IP bond error. If syscheck is configured to receive SNMP traps, this alarm indicates that a SNMP trap was received with the set state. If syscheck is configured for IP bond monitoring, this alarm can mean that a slave device is not operating, a primary device is not active, or syscheck is unable to read bonding information from interface configuration files.
Recovery
- Run
syscheckin Verbose mode. (See Running the System Health Check.) - Call unresolvable-reference.html#GUID-A2C37E16-F0BA-4FB6-9D93-1D4A95A40DC7 for assistance.
5000000000004000 - Server Reboot Watchdog Initiated
This alarm indicates that the server has been rebooted due to a hardware watchdog.
Recovery
5000000000008000 - Server HA Failover Inhibited
This alarm indicates that the server has been inhibited and HA failover is prevented from occurring.
Recovery
- Call unresolvable-reference.html#GUID-A2C37E16-F0BA-4FB6-9D93-1D4A95A40DC7 for assistance.
5000000000010000 - Server HA Active To Standby Transition
This alarm indicates that the server is in the process of transitioning HA state from Active to Standby.
Recovery
- Call unresolvable-reference.html#GUID-A2C37E16-F0BA-4FB6-9D93-1D4A95A40DC7 for assistance.
5000000000020000 - Server HA Standby To Active Transition
This alarm indicates that the server is in the process of transitioning HA state from Standby to Active.
Recovery
- Call unresolvable-reference.html#GUID-A2C37E16-F0BA-4FB6-9D93-1D4A95A40DC7 for assistance.
5000000000040000 - Platform Health Check Failure
This alarm indicates a syscheck configuration error.
Recovery
- Call unresolvable-reference.html#GUID-A2C37E16-F0BA-4FB6-9D93-1D4A95A40DC7 for assistance.
5000000000080000 - NTP Offset Check Failure
This alarm indicates that time on the server is outside the acceptable range or offset from the NTP server. The alarm message provides the offset value of the server from the NTP server and the offset limit set for the system by the application.
Alarm Type: TPD
Severity: Minor
Alarm ID: TKSPLATMI20
Recovery
- Call unresolvable-reference.html#GUID-A2C37E16-F0BA-4FB6-9D93-1D4A95A40DC7 for assistance.
5000000000100000 - NTP Stratum Check Failure
This alarm indicates that NTP is syncing to a server, but the stratum level of the NTP server is outside the acceptable limit. The alarm message provides the stratum value of the NTP server and the stratum limit set for the system by the application.
Recovery
- Call unresolvable-reference.html#GUID-A2C37E16-F0BA-4FB6-9D93-1D4A95A40DC7 for assistance.
5000000020000000 – Server Kernel Dump File Detected
Alarm Type: TPD
Description: This alarm indicates that the kernel has crashed and debug information is available.
Severity: Minor
OID: 1.3.6.1.4.1.323.5.3.18.3.1.3.30
Alarm ID: TKSPLATMI305000000020000000
Recovery
- Run syscheck in Verbose mode (see Running the System Health Check).
- Contact unresolvable-reference.html#GUID-A2C37E16-F0BA-4FB6-9D93-1D4A95A40DC7.
5000000040000000 – TPD Upgrade Failed
Alarm Type: TPD
Description: This alarm indicates that a TPD upgrade has failed.
Severity: Minor
OID: tpdServerUpgradeFailDetectedNotify 1.3.6.1.4.1.323.5.3.18.3.1.3.31
Alarm ID: TKSPLATMI315000000040000000
Recovery
5000000080000000– Half Open Socket Warning Limit
Alarm Type: TPD
This alarm indicates that the number of half open TCP sockets has reached the major threshold. This problem is caused by a remote system failing to complete the TCP 3-way handshake.
Severity: Minor
OID: tpdHalfOpenSocketWarningNotify1.3.6.1.4.1.323.5.3.18.3.1.3.32
Alarm ID: TKSPLATMI325000000080000s000
Recovery
- Run syscheck in verbose mode (see Running the System Health Check ).
- Run
syscheck(see Running syscheck Using the syscheck Login) - Contact unresolvable-reference.html#GUID-A2C37E16-F0BA-4FB6-9D93-1D4A95A40DC7 and provide the system health check output.
5000000000200000 - SAS Presence Sensor Missing
Recovery
- Call unresolvable-reference.html#GUID-A2C37E16-F0BA-4FB6-9D93-1D4A95A40DC7 for assistance with a replacement server.
5000000000400000 - SAS Drive Missing
This alarm indicates that the number of drives configured for this server is not being detected.
Recovery
- Call unresolvable-reference.html#GUID-A2C37E16-F0BA-4FB6-9D93-1D4A95A40DC7 to determine if the alarm is caused by a failed drive or failed configuration.
5000000000800000 - DRBD failover busy
This alarm indicates that a DRBD sync is in progress from the peer server to the local server. The local server is not ready to bethe primary DRBD node because its data is not current.
Recovery
- Wait for approximately 20 minutes, then check if the DRBD sync has completed. A DRBD sync should take no more than 15 minutes to complete.
- If the alarm persists longer than this time interval, call unresolvable-reference.html#GUID-A2C37E16-F0BA-4FB6-9D93-1D4A95A40DC7 for assistance.
5000000001000000 - HP disk resync
This alarm indicates that the HP disk subsystem is currently resyncing after a failed or replaced drive, or after another change in the configuration of the HP disk subsystem. The output of the message will include the disk that is resyncing and the percentage complete. This alarm eventually clears after the resync of the disk is completed. The time to clear is dependant on the size of the disk and the amount of activity on the system..
Recovery
- Run
syscheckin Verbose mode. - If the percent recovering is not updating, wait at least 5 minutes between subsequent runs of
syscheck, then call unresolvable-reference.html#GUID-A2C37E16-F0BA-4FB6-9D93-1D4A95A40DC7 with thesyscheckoutput.
5000000400000000 – NTP Source Server is not able to provide correct time
This alarm indicates that an NTP server was not able to provide a good time.
Severity: Minor
Alarm ID: TKSPLATMI35
Recovery
Contact unresolvable-reference.html#GUID-A2C37E16-F0BA-4FB6-9D93-1D4A95A40DC7.
Minor Application Alarms
Minor application alarms involve RTDB capacity and software errors.
4000000000020000 - Automatic RTDB Backup is not configured
This is an indication that the Automatic RTDB Backup is not configured on the system, i.e., the Backup Type is "None."
Recovery
- Configure the Automatic RTDB backup with backup type other than None. Refer to Automatic RTDB Backup for details on how to configure the Automatic RTDB Backup.
6000000000000200 - RTDB Backup Failed
This alarm indicates that the system was unable to complete an RTDB backup.
Recovery
- Call unresolvable-reference.html#GUID-A2C37E16-F0BA-4FB6-9D93-1D4A95A40DC7 for assistance.
6000000000000400 - Automatic RTDB Backup Failed
This alarm indicates that the system was unable to complete an automatic RTDB backup.
Recovery
- Call unresolvable-reference.html#GUID-A2C37E16-F0BA-4FB6-9D93-1D4A95A40DC7 for assistance.
6000000000000800 - Automatic Backup cron entry modified
This alarm indicates that the cron entry for automatic backups has been modified. No further action is required.
6000000000002000 - Configurable Quantity Threshold Exceeded
This alarm indicates that the RTDB file system has reached the user-configured threshold.
Recovery
- If the user-configurable threshold is set to less than 90%, then the user may increase the threshold to a higher value.
- Log in to the User Interface of the ELAP GUI. See Accessing the ELAP GUI Interface.
- Select to change the threshold value (1-99). See ELAP Administration and LNP Feature Activation for additional information.
- If the user-configurable threshold is set to 90% or higher, call unresolvable-reference.html#GUID-A2C37E16-F0BA-4FB6-9D93-1D4A95A40DC7 for assistance.
6000000000020000 - Automatic RTDB Backup is not configured
This is an indication that the Automatic RTDB Backup is not configured on the system, i.e., the Backup Type is "None."
Recovery
- Configure the Automatic RTDB backup with backup type other than None. Refer to Automatic RTDB Backup for details on how to configure the Automatic RTDB Backup.