4.1.3 ELAP GUI Main Screen
The ELAP GUI main screen contains three sections:
The banner is the topmost section. It extends the entire width of the browser window. The remainder of the screen is divided vertically into two sections. The smaller left section is the menu section. The larger right section is the workspace section.
4.1.3.1 ELAP GUI Banner Section
Figure 4-14 ELAP Banner Applet

The banner applet contains four information areas:
ELAP Host Addresses
- HA ELAP Pair VIP address
- ELAP A server provisioning IP address connection
- ELAP B server provisioning IP address connection
- Green - ELAP is connected
- Yellow with red triangle - ELAP is inhibited
- A - Active ELAP
- S - Standby ELAP
Clicking on an ELAP IP address toggles between the ELAP IP address and the ELAP host names.
ELAP Alarm Information Area
The ELAP alarm information area of the ELAP banner applet provides alarm-related information.
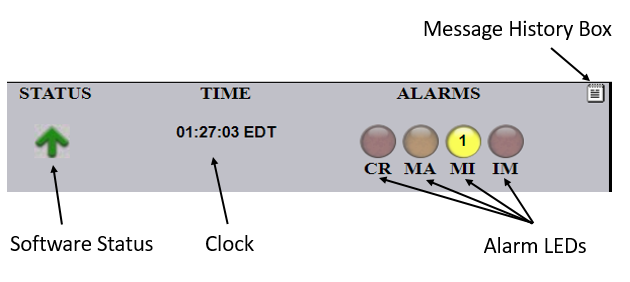
Figure 4-15 ELAP Alarm Information Area

The ELAP alarm information area provides these features:
-
Clock - Displays the time on the selected ELAP. Clicking on the clock changes the display mode.
-
ELAP software status - Displays the status of the ELAP software.
When the ELAP software is running, a green up arrow is displayed (as shown in the figure above). When ELAP software is down, a red (down) arrow is displayed. When there is a GUI time-out, TERMINATED is displayed in red.
-
Alarm LEDs - The alarm LEDs displays the existence and severity of alarms on the selected ELAP. The LEDs are:
- Critical alarms (left LED) - turns red when a Critical alarm occurs
- Major alarms (middle LED) - turns orange when a Major alarm occurs
- Minor alarms (right LED) - turns yellow when a Minor alarm occurs
-
Alarm message history - Clicking the Message History icon displays a history of the alarms and information messages for the selected server. Entries are color-coded to match alarm severity:
- Red - critical messages
- Orange - major messages
- Yellow - minor messages
- White - informational messages
To remove cleared messages from the message history, click the Clear button.
To refresh the messages displayed, click the Refresh button.
To prevent the message from displaying in the banner message box, click the Hide checkbox associated with a message.
-
Banner message box - The banner message box is a horizontal scroll box that displays text messages for the user. Banner messages indicate the status of the ELAP machine.
LSMS Connection Status
- LSMS provisioning indicator (enabled/disabled)
- LSMS provisioning connection status indicator (connected/unconnected/listening/unknown)
- LSMS audit connection status indicator (connected/unconnected/listening/unknown)
- LSMS bulk download connection status indicator (connected/unconnected/listening/unknown)
- LSMS bulk download indicator (enabled/disabled)
- Gray - disabled
- Orange - unknown (displays only during state transitions)
- Yellow - listening
- Green - connected or enabled
Note:
LSMS audit and LSMS bulk download cannot be enabled at the same time. Enabling one toggles the other to a disabled state.Figure 4-16 LSMS Connection Status Area

Moving the cursor over any of the five sections in the application displays a pop-up that provides LSMS information.
Service Module Card Status
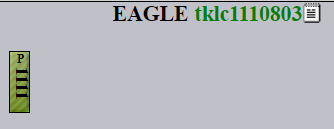
The Service Module card status area of the ELAP Banner Applet provides information for up to 18 Service Module card slots on the EAGLE.
Figure 4-17 Service Module Card Status

- Grey - unknown card state
- Booting
- Inhibited card
- Previously provisioned slot with undetectable card
- Light green (with ascending loading bar) - card loading (loading status is shown)
- Green striped - inconsistent card state
- Dark green - loaded consistent state
- P - indicates Primary Service Module card
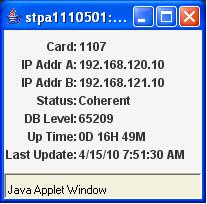
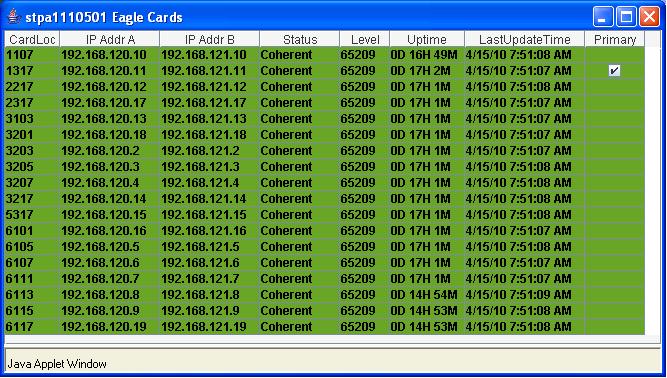
Moving the cursor over an occupied slot icon displays the card information in a pop-up window.
Figure 4-18 Status of an Individual Card

Figure 4-19 Service Module Card Status Information

4.1.3.2 ELAP GUI Menu Section
The ELAP graphical user interface menu section is located in the left side of ELAP browser. The top of the frame is the software system title (ELAP) and a letter that designates the selected ELAP, either A or B. One or more submenus appear below the title. The content of the menu corresponds to the access privileges of the user.
By clicking on the name or folder icon of a directory, the user may expand and contract the listing of submenu content (typical “tree-menu” view). Directory contents may be either menu actions or more submenus. When you click the menu actions, the output is displayed in the workspace section (the right frame of ELAP browser interface).
4.1.3.3 ELAP GUI Workspace Section
The ELAP graphical user interface workspace section displays the results of menu actions taken by the user. The content of the workspace section can be various things such as prompts or status reports. Every menu action that writes to the workspace uses a standard format.
The format for the workspace is a page header and footer, and page margins on either side. In the header two data fields are displayed. The left-justified letter A or B designates the ELAP server that is currently select for menu action. The other data field has the right-justified menu action title. The footer consists of a bar and text with the time when the page was generated. At the bottom of the footer, a copyright notice is shown.
Workspace Section Syntax Checking
The web browser user interface uses layers of syntax checking to validate user input for text-entry fields.
-
Mouse-over syntax check: For many of the entry fields, you can move the mouse over the field, causing a list of syntax hints for that field to appear.
-
Pop-up syntax checking: When you click the Submit button, syntax is verified on the client side by code running on the user's browser. Incorrect syntax appears in a pop-up window, which contains a description of the syntax error. When the window is dismissed, you can correct the error and submit the input again.
-
Back-end syntax checking: When you have clicked Submit button and the client side syntax checking has found no errors, back-end syntax checking is performed. If back-end syntax checking detects an error, it is displayed in the work space with an associated error code.