4 Solutions
This chapter describes information for:
Working with Solutions
A solution corresponds to an application configuration (for example, Merchandise Financial Planning or Item Planning). Each project can contain one or more solutions. For each solution, measures, rules, workbooks, and wizards are defined. Once a solution is created, it can be moved from one project to another.
Note:
Some solutions, such as Curve, Grade, and IPOCS-Demand Forecasting , have configuration steps that are specific to those solutions. For more information, see the corresponding configuration guide for the solution.
Create a Solution
Complete the following steps to create a solution.
Navigate: From the File menu, select New and then Solution. The Figure 4-1 opens.

-
In the Name field, enter the name of the solution.
-
In the Project field, select the project in which the solution is to belong. Multiple projects will be listed if multiple projects are currently open.
-
Click OK to save any changes and close the window.
Copy a Solution
Complete the following steps to copy a solution.
-
Select the solution to be copied.
-
Right-click in the Configuration Components pane and click Copy. The Copy solution window opens.
-
Type the new name for the solution in the text box.
Note:
This is the name that the solution is called after it has been copied.
-
Select the project where the solution is to be copied.
-
Click Finish to save the copied solution in the specified project.

Rename a Solution
Complete the following steps to rename a solution.
-
Select the solution to be renamed.
-
Right-click in the Configuration Components pane and select Rename. The Figure 4-3 opens.
-
Delete the old name from the resulting field and type the new name.
-
Click OK to save the new name.

Move a Solution
Complete the following steps to move a solution.
Note:
The Move a Solution operation is only available when multiple projects are open.
-
Select the solution to be moved.
-
Right-click in the Configuration Components pane and select Move. The Figure 4-4 opens.
-
Type the name of the solution in the text box.
Note:
This is the name that the solution is called after it has been moved.
-
Select the destination project for the solution from the resulting Project list.
-
Click OK to move the solution to the specified project.

Delete a Solution
Complete the following steps to delete a solution.
Select the solution to be deleted.
Right-click in the Configuration Components pane. The Figure 4-5 opens.

Click OK to complete the deletion.
Measures and Components
This section describes:
Measure Manager
The Measure Manager window allows you to define major and minor components of measures and to specify properties for each component. Once the component structure is defined, the Measure Manager generates measures by combining the components that are selected. You may then select (realize) the valid measures and further update the properties for individual measures.

Measure Properties
This section describes the fields displayed in the Measures tab.
Inheritance
Measure properties are inherited at the component level. The properties defined for a component are inherited by the minor components that belong to that component and to the measures that are associated with that component unless it is overridden at a lower level.
When a measure can inherit a property from more than one of the components that construct it, the measure inherits from the component that belongs to the highest major component in the component tree. For many properties, it is a good practice to set the properties for just one major component or for minor components in just one major component branch.
Measure Components
A major component is the highest level in the component inheritance hierarchy. Properties defined at this level are inherited by all minor components that are created under the major component.
Within each major component, you can create one or more minor components. You can also create a minor component under a minor component and also modify properties at the minor component level.
Once major and minor components are defined, the Measure Manager generates measures that are based on the combination of selected components. These measures cannot be used elsewhere in the configuration tools until the valid prototype measures are realized.
Note:
Components have no structural impact on the built solutions, and they are not exposed to end users. Components are intended to be a convenience to aid the configuration administrator to easily group measures together and to set measure properties at higher levels.
Component Process
The following steps describe the component process.
-
Create major components, from which measures are composed.
-
Create minor components, which are sub-groupings or specific items in a major component.
-
Define measure properties at the major component level. The minor components will inherit the properties associated with the major component they belong within.
-
If necessary, modify the measure properties at the minor component level.
Measure Naming Conventions
All components used in RPASCE configurations must adhere to the following naming convention:
Characters allowed:
-
Capital and lowercase letters (A, b…Z)
-
Numerals (1, 2, 3…)
-
Underscore (_)
With the exception of underscores, no non-alphanumeric characters are allowed. Measure component names must start with a letter. Spaces are not allowed.
Note:
Since the names of realized measures are limited to 30 characters, and those names are constructed by concatenating the names of the components from which the measure is built, it is usually good practice to abbreviate the names of components where necessary. However, there is no limit on the number of characters for measure labels.
Measure Component Design
The following two basic principles must be kept in mind to make the Measure Manager as powerful as possible.
-
Major and minor components should be designed with the idea of maximizing the inheritance of properties and minimizing the amount of property overriding.
-
Use minor components to make measure definition manageable.
For example, consider a configuration that has 2000 measures and 1500 of the measures is of data type real. Avoid grouping all 1500 measures into a single minor component because smaller subgroups of 1500 measures cannot be easily edited. Minor components can also have minor components, so within the 1500 measures, the configuration administrator may break them out further. This could be based on the aggregation method, such as total, max, recalc, and base intersections. Ideally, filtering by the checking of a lowest level minor component should allow the configuration administrator to easily view and manage every resulting measure for that minor component.
Create a Major Component
Complete the following steps to create a major component.
Navigate: In the Configuration Components pane, select Project then Solution then, Measures and then the Measure Components tab. The Measure Manager window opens in the workspace.
Figure 4-7 Measure Manager Window - Measure Components Tab

Description of "Figure 4-7 Measure Manager Window - Measure Components Tab"
-
Right-click in the left-hand pane of the Measure Manager window and select Add Major Component or click Add Major Component. The major component displays in the Measure Manager navigation tree with a default name.
Figure 4-8 Measure Manager Navigation Tree

Description of "Figure 4-8 Measure Manager Navigation Tree" -
To change the component name, right-click on the component and select Rename, or select the component from the navigation tree and then modify its Label field from the Measure Components tab.
Create a Minor Component
Complete the following steps to create a minor component.
Navigate: In the Configuration Components pane, select Project then Solution then, Measures and then the Measure Components tab. The Measure Manager window opens in the workspace.
Figure 4-9 Major Measure Component Selected

Description of "Figure 4-9 Major Measure Component Selected"
-
Select the major or minor component that the new minor component is to be added beneath. In Figure 4-9, NewMajorComponent is selected.
-
Choose one of the following methods:
-
Right-click the Measure Definition navigation tree and select Add Minor Component.
-
Click Add Minor Component.
-
Press Insert.
The minor component displays in the Measure Manager navigation tree with a default name.
-
-
To change the name, right-click on the component from the navigation tree and select Rename. You can also select the component from the navigation tree and modify the Label field from the Measure Components tab.

Defining Measure Component Properties
Complete the following steps to define the Measure Component properties.
Once components have been created, open the Measure Manager and select the Measure Components tab.
Select the major or minor components you want to view from the Measure Manager navigation tree. The selected components display in the Measure Components tab.

Specify the information for the component properties (for example, Name, Label, Description, and so on), which will apply to the measures that are inheriting property values from the component.
Note:
The values that are entered for major components are inherited by the child minor components and the auto-generated measures. Not all properties need to be entered for all components. Properties that are grayed out in the component properties table cannot have a value in the current context. Typically, this is based on the data type of the measure. For example, only components of Boolean data type can have an alert category or an alert expression.
Measure Component Properties
This section describes the fields displayed in the Measure Components tab.
Name
The name (identifier) of a component is used to identify the component within the Configuration Tools. Measure names are built by concatenating the names of the components from which the measure is built. They are concatenated in the order (from top to bottom) of the sequence that the components display in the list of components. You can override the measure name by manually entering a new name in the Name field. Measure names can be up to 30 characters in length. They can include letters and numbers but must start with a letter.
Label
The label of the component is used to generate measure labels in a similar way that measure names are generated. Labels are displayed to RPASCE end users. There is no maximum size limit but keep the grid display limitations in mind when creating a measure label.
Note:
Even though measure/fact labels are not required to be unique, RPASCE strongly suggests against duplicate labels, because they are used as identifiers within the user interface of RPASCE applications. The labels of Report Category measures are used in OAS UI and have additional restrictions. See the Create Reporting Views in PDS section of Oracle Retail Predictive Application Server Cloud Edition Administration User Guide for fact label restrictions.
Description
A description of the component is used to generate measure descriptions in the same way that measure labels are generated. The configuration administrator can enter any text to provide more information beyond the measure label to the end user. The description can be viewed by the end user in the RPASCE user interface.
Type
Select one of the following data types:
-
Real – Floating point numeric values. Most measures are of this type.
-
Int – Numeric integer values. There are no special spreading algorithms for integer measures, which should normally be used only for measures that are calculated bottoms up. Formatting can be used to display real measures as integer value in the RPAS CE client.
-
Boolean – True or false values, which are typically used for flags and indicators.
-
Date – Date and time. This can easily be converted to position names using standard RPASCE functions.
-
String – Variable length strings, which are typically used for notes and names.
NA Value
This is a value (typically zero for numeric measures) that is not physically stored but is inferred. It is used to help with storage and calculation efficiency, and it may be changed by RPASCE (in full-evaluation mode) if better efficiencies can be obtained with a different value. See Appendix – Calculation Engine User Guide and Appendix – Rules Function Reference Guide for more information.
Base Intx
The Base Intersection. The lowest level at which data is used for a measure. In the PDS, the measure is stored as a fact. For non-shared measures, they are stored at the measure’s base intersection. For shared measures, the measure’s base intersection may be higher than the fact intersection. Inside a workbook (for performance reasons), values for the measure may be stored higher than the base intersection. Nevertheless, whether stored or not, values for aggregated levels may be viewed in a workbook and used in calculations in workbooks or applications. Double-click this field to open the Select Intersection window. The hierarchies that were defined using the Hierarchy tool are displayed. One dimension from each hierarchy can be selected, but a dimension is not required for each hierarchy. Alternatively, a measure may be marked as scalar. A scalar measure has only one value at any combination in the positions of dimensions of the application. A Labeled Intersection may also be selected as the base intersection of a measure. The Labeled Intersection field is populated based on the Labeled Intersections defined through the Labeled Intersection window accessed in the Hierarchy Definition manager.
Note:
RPASCE imposes a limit of five dimensions that can be defined in a measure's base intersection.
Default Agg
The default aggregation method should be selected from the valid aggregation methods for the component. The valid aggregation method depends on the data Type selected for the component. See Appendix – Calculation Engine User Guide and Appendix – Rules Function Reference Guide for more information on aggregation and spread methods.
Note:
Only measures with an aggregation type of ambig, pst, or pet can be aggregated from lower than the partition levels to higher than the partition levels in a global application.
Agg Spec
This hybrid aggregation mechanism is designed to allow the configuration administrator to specify a complex method to aggregate the values of a measure. It allows a different aggregation method to be specified for each hierarchy in the measure's intersection. When a measure with the hybrid agg type needs to be aggregated, this is accomplished by separately aggregating each hierarchy of the intersection according to the agg method for that hierarchy.
Example:
Measure XYZ is defined at day_sku_str and has a hybrid aggregation type. The specifics for the aggregation are as follows:
-
Calendar should be aggregated by the first method.
-
Location should be aggregated by the total method.
-
Product should be aggregate by the total method. -stopped
Suppose that XYZ must be aggregated to the level of mnthclssrgn_. The process of generating this new value is accomplished by three successive aggregations:
-
day_sku_str_ to day_clssstr_ by total (product)
-
day_clssstr_ to day_clssrgn_ by total (location)
-
day_clssrgn_ to mnthclssrgn_ by first (calendar)
In this example, the user is allowed visibility to and control over the mechanism by which pst is performed.
A brief description of the user interface functionality/constraints is as follows:
-
The hybrid aggregation method now displays in the deff agg drop-down selector.
-
When a measure is specified for hybrid agg, the agg spec (aggregation specification) field becomes editable.
-
An agg spec can be typed in or built through a window (double-click the agg spec editor or select Ctrl-Space to launch it).
-
This window looks very similar to the standard wizard for workbooks. On the right, the ordering of hierarchies in the intersection of the measure is set by dragging the hierarchies in the list. On the left, a separate aggregation type is selected for each hierarchy. For the most part, these are the aggregation types that are available for the measure based on its type.
Exceptions are as follows:
-
Recalc or hybrid cannot be used within an agg spec.
-
First and last can be used only on the Calendar hierarchy only.
-
An aggregation type must be specified for each hierarchy in the intersection.
-
If a value is to be typed into agg spec, the syntax and meaning is the same as the arguments used by the aggregate function of the rule engine.
-
A hybrid aggregation measure must be read only in its agg state.
-
A hybrid measure must have a spread type of none.
Note:
The hybrid aggregation type is not supported for extended measures or for the load aggregation method for a measure. Unlike Aggregate procedure, the recalc aggregation type is not supported for any hierarchy for am measure using the hybrid aggregation type. Measures that use the hybrid aggregation type cannot be aggregated from a local domain into the global application.
Default Spread
The default spread method should be selected from the valid spread methods for the component. The valid default spread method depends on the data Type selected for the component. See Appendix – Calculation Engine User Guide and Appendix – Rules Function Reference Guide for more information on aggregation and spread methods.
Note:
The spread method can be overridden on edit in the RPASCE User Interface. For all populated spread methods (ending with pop), the spread method is the same as the underlying method (for instance, prop_pop is like prop), except that only cells with a value that is different from the naval are used in the spreading, and cells with a value equal to the naval are ignored.
Base State
The ability of the measure at the base level to be modified. The available options are read or write.
Agg State
The editability of the measure at the aggregate level, which are all intersections higher than the base intersection (read or write). Set the Base State to write and the Agg State to read for those measures that need to be manipulable, but where there is no business requirement to manipulate them other than at their base intersection. Usually there is no sensible way to spread such measures. The manipulability of measures will change according to protection processing principles. Therefore, base state and agg state should only be used to override the result of protection processing (for example, to make a measure non-manipulable that protection processing would otherwise allow to be manipulated). See Appendix – Calculation Engine User Guide and Appendix – Rules Function Reference Guide for more information on the Agg State of measures.
Database
The physical location in the file system of the database that stores
the data for this measure. Those measures that contain data that persists
beyond the lifetime of a given workbook store their information within
a database within the RPASCE application. This field is used to specify
the path to the location of the database to use for the measure. All
databases are contained within the data directory of the application.
If the specification does not begin with the data directory, data/ is attached to the beginning of the entry at the time
of installation (for instance, the entry Sales is registered as data/Sales)
Note:
The presence of multiple measures within a single database can create unnecessary contention when the measures' data are being updated as part of a workbook commit or batch calculation. In order to avoid this, measures that are updated through batch calculations or workbook commits should be configured with unique values for the database property so that they each get a separate database. Measures that are only updated by data load and that are read-only for workbook and batch operations can be grouped together without causing contention.
View Type
The View Type field holds properties for two types of measures:
-
Those that are calculated when viewed
-
Those that are synchronized with other measures.
If the view type is none, the measure is of neither type.
If the View Type is view_only, the measure is not calculated during a normal calculate cycle, and it is calculated on-the-fly when required (for instance, for viewing). Such measures must have an aggregation type of recalc and must appear on the left-hand side of only one expression in a rule group. They may not appear on the right-hand side of any expressions. The measure must not have a database assigned. See Appendix – Calculation Engine User Guide of this guide for more information.
Synchronized measures are in effect, views of two or more other measures where changes and lock to those other measures are immediately reflected in the synchronized measure (and vice versa).
Example:
A closing stock (cs) measure may be synchronized with a season opening stock (sos) measure and an opening stock (os) measure so that a change to opening stock in week 3 will immediately cause the same change to be applied to closing stock in week 2 (since closing stock in week 2 and opening stock in week 3 are the same). Synchronized measures require a synchronization type in the View Type property, which must be one of sync_first_lag, sync_lead_last, sync_first or sync_last, and a list of measures to synchronize with in the Sync With property.
-
none – The measure is calculated normally.
-
view_only – The measure is calculated when viewed.
-
sync_first_lag – Period 1 is from the first measure (no calendar). Periods 2...N are from the second measure 1...N-1 (lag) [for example, bop synchronized with os and eop].
-
sync_lead_last – Periods 1...N-1 are from the first measure 2...N (lead). Period N is from the second measure (no calendar) [for example, eop synchronized with bop and cs].
-
sync_first – Gets Period 1 from the measure (similar to pst along calendar dimension) [for example, os synchronized with bop].
-
sync_last – Gets Period N from the measure (equivalent to pet along calendar dimension) [for example, cs synchronized with eop].
Sync With
A comma-separated list of measures used for synchronization. This depends on the View Type.
Insertable
This field indicates whether the measure can be inserted as an extra measure in workbooks built from templates that are not configured to contain the measure. Insertable measures can be added to a workbook during the wizard process on the Extra Measures wizard page before a workbook is built, or by inserting the measure in the Show/Hide window in the RPAS CE Client inside a built workbook. Measure security must also be defined for Insertable measures in the RPASCE Security Administration workbook template. Possible values are true and false. See the Oracle Retail Predictive Application Server Cloud Edition Administration Guide for additional information about measure security.
Note:
The Extra Measures wizard is not available by default for every workbook; it must be configured as a custom wizard page.
Non-Translatable
The selected value of true will represent that a measure should be omitted from generated translation resources. The false or unspecified value will represent that a measure should be included in these resources and all legacy configurations will therefore treat all measures as translatable unless further configuration is performed.
UI Type
The UI Type property affects how the user interacts with a measure within the client. There are two supported values for UI Type; by default, UI Type is unspecified, meaning that the measure exhibits no special behavior within the client.
-
Picklist – When a measure is given a UI Type of picklist, it will no longer accept edits within the client. Instead, the user will be provided with a drop-down box that contains a set of valid values. Selecting an item in this drop-down will set the cell of the measure to the appropriate value. For picklist measures, the contents of the drop-down box are determined by the range attribute.
-
Media – When a measure is given a UI Type of media, the RPASCE Client will not display the values of the measure's cells. Instead, it will examine the contents of a cell to extract image location information, retrieve the appropriate image resource and display that image in the cell. For a measure to have a UI Type of media, that measure must be a string type measure.
Note:
For information regarding the values that should be loaded into a media UI Type measure; see the Media Measures section of the Oracle Retail Predictive Application Cloud Edition Administration Guide.
Range
Specify an allowed range for the measure at edit time. For numeric values, the syntax is specified as Lower Bound:Upper Bound. If the RPASCE UI user attempts to enter a value in the RPASCE Client outside of this range, the modification is rejected. For string measures, any entry in this field is ignored.
For date measures, the lower and upper bounds specify both the date and the time. The default time for the lower bound is 12:00:00 AM. The default time for the upper bound is 11:59:59 PM. The time portion of the bounds is included regardless of the style setting because users can change the style setting on the client side.
For numeric or string measures with a UI Type of picklist (numeric and string), values are comma separated value/label pairs, where the label is given in brackets, such as a(labela), b(labelb), and c(labelc). If a label is not specified (for example, a, b, c, d), the value is also used as the label. The value of the cell is used in calculations; however, labels (if specified) will be displayed in the user interface, both in the grid and in the picklist.
Note:
The symbols of , (comma) and : (colon) are reserved characters for picklist and range definitions of a measure with a UI Type of picklist. These characters cannot be used to define the Label part of a picklist Value/Label pair.
If a cell contains a value that is not valid for the picklist, the value is displayed in the grid. When the measure's range is specified in this manner, all cells in the RPASCE Client will display these same values as valid options for the picklist. The valid set of options for a picklist measure can also be defined in such a way that they are context sensitive, which means that they vary from position to position. For example, a picklist measure with a base intersection at the SKU dimension could have valid values that vary according to which class the SKU belongs. The configuration administrator sets this up by setting the range property of the picklist measure as measurerange = measS where measS is the name of a string measure that holds the valid picklist options (in the valid formats described earlier) in each of its cells. The measure that holds the valid picklist values (in this example, measS) can have a base intersection at any of the dimensions in the hierarchies and the values shown in the picklist measure for any intersection are effectively “looked up" using normal ‘nonconforming measure' handling.
The valid values for a picklist for a cell are referenced from a measure dynamically. If required, it is possible for the valid values of picklists to change during the life of the workbook as a result of calculations or end-user edits. The value used will always be that of the last calculate, so direct or indirect (through calculation) edits to the picklist value measure are ignored when a calculation is pending.
Purge Age
The number of days (without a load) before measure data is purged. See the Oracle Retail Predictive Application Server Cloud Edition Administration Guide for details of how this property is used in the loadmeasure utility.
Lower Bound and Upper Bound
If the range of valid values for a numeric (real or integer) measure applies across the whole application, the range property can be used to specify valid values for data entry validation. If the range of valid numeric values varies according to positions in the hierarchies, the Lower Bound and Upper Bound must be used instead. If specified by the configuration administrator, the Lower Bound and Upper Bound properties must be a valid, realized measure name that provides the bounding values for this measure's data cells. These properties must contain measure names (not numeric values).
Note:
If one (but not the other) of Lower Bound and Upper Bound is specified, only one limit is checked. For example, if a Lower Bound is set, but an Upper Bound is not, valid values are greater than or equal to the value held in the Lower Bound measure, but with no upper limit. The Lower Bound and Upper Bound measures can be non-conforming with respect to the measure that has bounds, and the value to be used will be obtained by normal non-conforming processing (that is, replicated down from higher levels or aggregated up from lower levels).
Sp Value Type and Sp Value
These two properties specify the special value type and the special value value. They are used to define the way in which special values are handled by RPASCE. These two properties can be used together to specify how to display cell values in the User Interface (UI) that have a value equal to the naval of the measure. In particular, it supports solutions that want to interpret cells with the naval as meaning "no value" by displaying a null value to the end user.
The SP Value Type property specifies the type of value that will be shown. Valid values for this property are Null, Cell Value, and User Entered. The default behavior is that such cells will have their cell value shown, which is what the value of Cell Value in the SP Value Type property means. However, these properties can be used to override the default to either show null, which is defined later, or to display a specific value. To configure the values to display null, assign Null as the SP Value Type property. When Null is configured, the cell will be blank in the RPAS CE Client when the value equals the naval for a numeric, a date, or a string measure. For Boolean measures, it will be a grayed-out check box. When a specific value is required, you should select User Entered for the SP Value Type and enter the value to be displayed in the SP Value field.
For the Special Value field, the entry in this field must be of the same data type as the measure, and validation is enforced in this field.
-
For a Boolean measure, when the Special Value Type field is set to User Entered, the only valid entry for the Special Value field is either true or false.
-
For a Date measure, when the Special Value Type field is set to User Entered, a date in the format of YYYYMMDD can only be entered by the user.
-
By default, each measure will be registered with Cell Value as the default Special Value behavior. For cases where a Special Value Typesetting other than User Entered is used, but a Special Value entry is provided, the Special Value entry will not be used. Instead, the measure will be registered with Cell Value as the default behavior.
-
When Special Value Type is set to User Entered, but a Special Value entry is not entered, the Special Value Type will not be used. Instead, the measure will be registered with Cell Value as the default behavior.
-
When a PDS has been built that includes a measure with a special value setting, and that special value setting for that measure is removed. When the PDS is patched the measure will get updated with Cell Value as the default special behavior.
-
RPASCE allows for the special value measure property to be updated.
Dim Attr Type
This check box option is used to indicate that the measure must be registered as a 1-dimension attribute. Dimension attributes allow for additional information to be defined for the positions of a given dimension. This is commonly used to define and display an alternate label for a position (other than the loaded position label) or to display supplemental information about a position (such as the status of a given position).
The following requirements must be met for a measure to be eligible to be a dimension attribute:
-
The measure must be realized.
-
The measure must be 1-dimensional, which means that its base intersection must only have one dimension.
-
The measure must be stored, which means that it must have a defined database.
Dim Attr Name (optional field)
This is only to be used if the measure is set to be a dimension attribute measure. When a dimension attribute is displayed within the RPASCE Client, the Dim Attr Name will be used in place of the measure name. If no Dim Attr Name is supplied, the RPASCE Client displays the measure name.
Dim Attr Label (optional field)
This is only to be used if the measure is set to be a dimension attribute measure. When a dimension attribute is displayed within the RPASCE Client, the Dim Attr Label will be used in place of the measure label. If no Dim Attr Label is supplied, the RPASCE Client displays the measure label.
Allowed Aggs
The set of the allowable aggregation methods for the measure based on the measure data type. You can add so called extended measures to RPASCE Client views that are normal measures, but with aggregations based on different aggregation methods. The aggregation methods that are available for selection are based on the Allowed Aggs of the base measure. The same base measure can have multiple extended measures based on different aggregation methods.
Style
One of the styles defined within the style tool may be specified as the default style to be used to display measures based on this component inside the User Interface. See the section on the Style Manager for details on the specification of style information.
Single Hier Select
This property is only valid for components that have a Type (data type) of string and non-picklist. It specifies that cell contents are to be entered by users using the Single Select Widget. This is a widget in the RPASCE Client that presents the end user with a view of the positions along the dimension set in the configuration. The user may then select any single position. When a user double clicks the Single Hier Select field, a Select a Dimension window pops up where the user must select the hierarchy and dimension whose positions will be displayed to the user in the RPASCE Client.

For the Single Hier Select measures that have both Agg State and Base State properties set to READ, the pop-up dialog box contains an additional Multi List check box. Users can select the Multi List check box to enable the Multi Item Display on RPASCE UI, so users can see a concatenated list of positions that meet different criteria for a measure (For example, alert or promotion) so that users can see which positions have alerts or offers and what details that apply to them.
Figure 4-13 Measure Definition Table
Filename (read only)
Measures included into the Data Interface Manager have a filename specified. This field displays the value, if one exists, for the filename of the measure. See the section on the Data Interface Tool for details on data interface properties. This property cannot be modified and is displayed for diagnostic purposes.
Load Intx (read only)
Measures included in the Data Interface Manager have a load intersection [Load Intx] specified. This field displays the value, if one exists, for the load intersection of the measure. See the section on the Data Interface Tool for details on data interface properties. This property cannot be modified and is displayed for diagnostic purposes.
Load Agg (read only)
Measures included in the Data Interface Manager will have a load aggregation method [Load Agg] specified. This field displays the value, if one exists, for the load aggregation method of the measure. See the section on the Data Interface Tool for details on data interface properties. This property cannot be modified and is displayed for diagnostic purposes.
Materialized (read only)
Certain measures may be registered as display only measures in order to improve performance within a workbook. This marking is done automatically at the time of installation. If the measure is marked as display only, that fact will be reflected in this field. This property cannot be modified and is displayed only for diagnostic purposes.
Creator (read only)
Certain extensions make use of plug-ins to the RPASCE Configuration Tools to automatically generate configuration content. This field displays the creator of the given measure. The value user represents content generated by a user of the Configuration Tools. A different value represents content generated by a plug-in. This property cannot be modified and is displayed for diagnostic purposes only.
Signature (read only)
The signature of a measure is used to resolve ambiguity that may result from overriding the name property of a measure. This field contains the value of the measures signature property. The contents of this field are created and maintained automatically by the Measure Manager. This property cannot be modified and is displayed only for diagnostic purposes.
Shared Fact Name (read only)
Measures included in the Data Interface Manager can have a Shared Fact Name specified if these measures are shared measures. This field displays the name of the common fact shared among measures from multiple applications. See the section on the Data Interface Tool for details on data interface properties. This property cannot be modified and is displayed for diagnostic purposes.
Shared Fact Base Intx (read only)
Measures included in the Data Interface Manager can have a Shared Fact Base Intx specified if these measures are shared measures. This field displays the base intersection of the fact shared among multiple measures. See the section on the Data Interface Tool for details on data interface properties. This property cannot be modified and is displayed for diagnostic purposes.
Report Category
The report category field is used for data visualization and reporting with Oracle Analytic Server. Users select measures that will be potentially reported on, with each measure assigned a reporting category. The report category can be set at the Measure Component level, Measure, or Realized Measure level. If configured at the component levels, the values will be concatenated into the Report Category field of the final realized measure. The Report Category value of each realized measure can be overridden by directly editing in the Measure or Realized Measure field.
Requirements for Report Category
-
The value of the Report Category field must follow the Measure Naming Conventions, such as always starting with a letter and no special characters allowed except "_". The value length must not exceed 21 characters because the value is used to construct the view name later during the OAT Task.
-
The measure must have a storage database.
- Measures of the same report category must have the same measure base intersection; if the measures are shared measures, the shared fact base intersection must be the same.
If no storage database is specified while the report category is being configured, the report category will be overridden to null during the integration configuration generation to prevent later OAT task failure when creating schema objects for data visualization.
If the same category has different fact base intersection, a hard error will be generated during integration configuration generation to halt the process. Otherwise, the OAT task will fail during the creation of schema objects for data visualization.
Enable Viewing Fact Data by Dimension Attributes in Data Visualization (DV)
Figure 4-14 An Example of Viewing Sales Data by Color Attributes in DV

The one-dimensional and two-dimensional attribute measures must have the Report Category values configured; the following assumptions and requirements apply.
| 1 | View generation based on Attribute measures. The views only contain the base dimension levels (no roll up levels). |
| 2 | The configurator must assign Report Category for the attribute
measures:
|
| 3 | In the application configuration, multiple levels of the same hierarchy can have their own two-dimensional attribute measures. So, one hierarchy may have multiple two-dimensional attribute measures with different measure base intersection. |
| 4 | In PDS, one hierarchy may have multiple attribute hierarchies that come from different applications. For example, PROD may have attribute hier PAT1 in app1 and PAT2 in app2. The dimensions within PAT1 and PAT2 must have different dim names. |
| 5 | In PDS, the two-dimensional attribute measures of the same measure base intersection (due to multiple applications) must not have the same report category. If they do, the integration configuration generation will fail. |
| 6 | In PDS, if the two-dimensional attribute measures are shared measures, then they are just the same fact; if they are not shared, then their requirements are covered above. |
Source Fact (Read Only)
Measures included in the Data Interface Manager can have a Source Fact flag set to True to indicate that the data for these measures can be updated by the ORDS Put service. See the section on the Data Interface Tool for details on data interface properties. This property cannot be modified and is displayed for diagnostic purposes.
Customer Managed
The measure property customer managed has a value of true or false. By default, this property has a value of false. Users can explicitly configure this property to true to indicate that this measure is writable in the PL/SQL procedures added by customers.
Customer managed measures are writeable in the PL/SQL procedures added by customers. All other measures in the configuration are read-only from the customer's PL/SQL.
-
Must have the db field specified.
-
Cannot be shared measures.
- Should not be used in cycle groups or the left-hand side of special expressions, as these measures must be in the same fact group. Making part of these measures as customer-managed measures/facts will split this fact group since customer-managed measures are assigned to a separate fact group.
Edit Components
Navigate: In the Configuration Components pane, select Project, then Solution, and then Measures. The Measure Manager window opens in the workspace.
Move Components
-
From the Measure Manager navigation tree, select the component to be moved.
-
Drag the component to the new location and release it.
Note:
A minor component cannot be moved to a different major component.
The configuration administrator cannot move a component so that it would be a descendent of another component that is used in the specification of a realized measure.
Push Components Down
-
From the Measure Manager navigation tree, select the component to be pushed down.
-
Right-click in the Measure Definition menu and select Push Down.
Note:
The component is pushed down one level in the component hierarchy, and a new component is created to take the place of the pushed down component.
Note:
A major component cannot be pushed down.
Pull Components Up
-
From the Measure Manager navigation tree, select the component to be pulled up.
-
Right-click and select Pull Up. The component is pulled up one level in the component hierarchy.
Note:
A minor component cannot be pulled up to become a major component, nor can a major component be pulled up.
Display or Hide Components
-
To display information about a component, select the check box next to the component name.
-
To hide information about a component, clear the check box next to the component name.
Note:
Selecting or clearing a check box for a major or minor component causes the check boxes for all minor components underneath it to be selected or cleared. This check box is also used to enable a component so it becomes active when measures are generated.
Find a Component
-
Right-click in the Measure Manager navigation tree and select Find Component. The Input window opens.
-
Type in the name of the desired component and click OK. The tree will scroll to bring the specified component into view.
-
Select the desired component.
Note:
The full name (case sensitive) of the component is required in order to find it. If there is no component with the exact name entered, the tree will not scroll.

Rename a Component
Navigate: From the Measure Manager navigation tree, select the component to be renamed.
Choose one of the following methods:
-
Right-click in the Measure Manager navigation tree and select Rename. Type the new name for the component.
-
Double-click the component and type the new name.
-
Select and change the name of the component in the Measure Component tab.
Note:
Changing the name of a component results in a change in the name of any measure that inherits from the component unless the measure has overridden the name property.
Remove Components
Navigate: From the Measure Manager navigation tree, select the component to be removed.
Choose one of the following methods:
-
Click Remove Component.
-
Press Delete.
-
Right-click in the Measure Manager navigation tree and select Delete.
-
The component is removed from the solution.
Note:
It is not possible to remove a component that is used (or that has a descendent component that is used) in the specification of a measure.
Measure Validation within the Measure Manager
The Measure Manager performs large amounts of validation on the properties of the measures that are created within it. Much of this validation involves dependencies of one property of a measure upon another property of the measure. Some validation involves dependencies of a property of a measure upon the hierarchies that are defined in the Hierarchy Tool. These forms of validation are performed automatically as edits are made in the Measure Manager.
In addition, the validity of rules, rule groups, and workbooks depends on the properties of the measures that they contain. Validation of the measure content of the rules, rule groups, and workbooks of a large solution can take a significant amount of time.
To facilitate the configuration process, this second form of validation does not occur as edits are made in the Measure Manager. Instead, this validation is deferred until Measure Manager is closed by selecting a different tool/option from the Configuration Components pane. Then, a window briefly displays to indicate the validation process is running.
Figure 4-16 Validation Configuration Window

Description of "Figure 4-16 Validation Configuration Window"
When the full suite of solution level measure content validations is complete, the window is no longer displayed and the selected tool is activated.
Note:
For fast performing validations, a window may only display for a few seconds. If the validation process is lengthy, the window displays for a considerably longer time.
Disabling Measure Content Validation
For some cases you may disable the full validation (for instance, when performing a number of changes to measure properties that require switching back and forth between multiple tools). Validation can then be manually initiated from the Rule Definition window by selecting Perform measure content validation from the Rule Definition toolbar. Complete the following procedure to turn off real-time validation.
-
Select File and then Tools Preferences. The Workbench Preferences window opens.
Figure 4-17 Workbench Preferences – General Tab

Description of "Figure 4-17 Workbench Preferences – General Tab" -
Clear the Enable Measure Content Validation check box.
-
Click OK.
Working with Measures
Measure Manager Overview
The Measure Manager allows you to create and name measures by selecting major and minor components that are already defined. By default, the measures inherit the properties that are defined for the components. To create a measure, select the components that will be used to construct measures. The Measure Manager will generate measures for all of the combinations of selected components. This saves you from the tedious task of manually creating all required measures.

You may then override the properties for individual measures by entering them the same way as on the Measure Components tab. Once properties are overridden at the measure level, changes made at the component level will no longer spread down to that measure as it will retain the overridden value. An overridden value can also be restored to its inherited value or you may override an inherited value to be unspecified.
When a measure is auto-generated by the Measure Manager, it cannot be edited or used in any other configuration component such as rules and workbooks until it is realized. A measure does not need to be realized if it is not going to be used.
The Measures tab displays all auto-generated measures for the selected components.

The Realized Measures tab only displays those measures that are realized.
Figure 4-20 Measure Manager Realized Measures Tab

Description of "Figure 4-20 Measure Manager Realized Measures Tab"
Realized and Unrealized Measures
Complete the following steps to access the Measure Manager window - Measures Tab.
Navigate: In the Configuration Components pane, select Project, then Solution, and then Measures. The Measure Manager window opens in the workspace.
-
Select the Measures tab.
-
In the components tree, select the check boxes for the components that will be filtered. The Measure Manager will show measures using all the combinations of selected components. This process filters the list of prototype measures that are shown from all combinations of components to the combinations of components that have been selected. It uses those components to determine which prototype measures to show.

Rename a Measure
Navigate: In the Configuration Components pane, select Project, then Solution, and then Measures. The Measure Manager window opens in the workspace.
-
Select the components that are used in the measures to be renamed.
-
In the Measures tab, or the Realized Measures tab, click the name of the measure that is to be renamed.
-
Type the new name for the measure.
Note:
The measure must be realized before it can be renamed.
Show All Measures
Navigate: In the Configuration Components pane, select Project, then Solution, and then Measures. The Measure Manager window opens in the workspace.
Right-click in the Measure Manager window and select Show All.
Note:
Due to memory constraints when working with very large numbers of components, all auto-generated measures may not be displayed. In this case, the configuration administrator will receive an error message indicating that some measure components should be cleared.
Hide Measures by Component
Navigate: In the Configuration Components pane, select Project, then Solution, and then Measures. The Measure Manager window opens in the workspace.
-
In the Measure Manager window, select the Measures tab.
-
Choose one of the following methods:
-
Clear the check boxes next to the components to hide.
-
Select the component used in the measures to hide.
-
-
Right-click in the Measure Manager navigation tree and select Hide or press the spacebar.
Hide All Measures
Navigate: In the Configuration Components pane, select Project, then Solution, and then Measures. The Measure Manager window opens in the workspace.
-
In the Measure Manager window, select the Measures tab.
-
Right-click the Measure Manager navigation tree, and select Hide All.
Sort Measures by Property Value
Navigate: In the Configuration Components pane, select Project, then Solution, and then Measures. The Measure Manager window opens in the workspace.
In the Realized Measures tab, measures can be sorted by property value.
-
Select the Realized Measures tab.
-
Hold down the control key (Ctrl) and click in the filter field at the top of the table for the property of the measures to be sorted.
The measures are sorted in alphabetical order according to the value of the property.
Filter Measures by Property Value
Navigate: In the Configuration Components pane, select Project, then Solution, and then Measures. The Measure Manager window opens in the workspace.
In the Realized Measure tabs, the configuration administrator can filter measures by property value.
-
In the Realized Measures tab, click in the filter field at the top of the table for the property of the measures to be filtered.
-
Enter the value on which ti filter the measures.
Note:
This field is case sensitive.
External Measures
Under most circumstances, measures exist only within the solution in which they are defined. When working with a project with multiple solutions, it is sometimes desirable to make use of a measure defined in a different solution. The Measure Manager allows the import of a measure defined in a different solution (but not a different project) into the current solution. These measures (called external measures) then become visible in the External Measures tab of the Measure Manager. Within this tab, it is possible to modify certain measure properties so that the use of the measure in the Solution into which it has been imported will differ from its use in the Solution in which it was originally defined. For example, the configuration administrator may want to modify a writable measure so that it is read-only in the solution into which it is imported.
Figure 4-22 Measure Manager External Measures Tab

Description of "Figure 4-22 Measure Manager External Measures Tab"
Within the Measure Selectors present in the Rule and Workbook tools and the Expression Builder, there is a check box named Include External Measures. When this check box is selected, the Measure Selector will include those measures that were imported into the solution in addition to those that are present due to component selections in the Measure Selector.
The following properties may be overridden for an external measure:
-
Label
-
Description
-
Base State
-
Agg State
-
UI Type
-
Range
Import a Measure
Note:
You may only import a measure into a solution for a project that has at least one other solution.
Navigate: In the Configuration Components pane, select Project, then Solution, and then Measures. The Measure Manager window opens in the workspace.
-
Select the External Measures tab, and click Import Measure on the toolbar. The Figure 4-23 opens.
-
In the Add External Measures window, select the solution in which the desired measure is defined.
-
Use the measure selector (left-hand side) to select the measures to import.
Figure 4-24 Selecting Measures to Be Imported

Description of "Figure 4-24 Selecting Measures to Be Imported"External measures that are already imported display in bold.
-
From the right-hand list, select the measure to import and click OK. The selected measures display in the External Measure tab.

Remove an Imported Measure from a Solution
Navigate: In the Configuration Components pane, select Project, then Solution, and then Measures. The Measure Manager window opens in the workspace.
-
Click the External Measures tab, and select the measure to remove.
-
Click Remove Imported Measure from the Measure Manager toolbar, or right-click and select Remove Import. The selected imported measure is removed from the External Measures tabs.
Rule Sets
A rule set is a collection of rule groups. It is used as a placeholder for containing rule groups, which makes the visual display of rules easier. A workbook uses the rule groups specified in one rule set.
Note:
A rule set is a tools concept only. It does not appear in the configured solution.
A rule set is created along with the following default rule groups: load, commit, calc, and refresh.
The rule group names are prefixed with the name of the rule set followed by an underscore. After the default rule groups are created, the configuration administrator can create additional rule groups as necessary. The configuration administrator can also rename the rule groups that were automatically generated, but these rule groups cannot be deleted.
Create a Rule Set
Navigate: In the Configuration Components pane, select Project, then Solution, and then Rules. The Rule Definition window opens in the workspace.

-
From the toolbar, click New and select Rule Set, or select Create/Rule Set from the right-click menu. The Figure 4-26 opens.
-
Complete the following:
-
In the Name field, enter the name of the rule set.
Note:
A rule set name can be a maximum of ten alphanumeric or underscore characters. It must not have a name that is the same as any other rule set that exists in the project.
-
In the Description field, enter a description of the rule set.
-
Click OK to save any changes and close the window. The rule set displays in the Rules navigation tree.
-

Delete a Rule Set
Navigate: In the Configuration Components pane, select Project, then Solution, and then Rules. The Rule Definition window opens in the workspace.
-
In the Rule Definition window, select the rule set to be deleted.
-
Choose one of the following methods:
-
From the toolbar, click Delete, and select Delete Rule Set.
-
Right-click in the Rule Definition window select Delete/Remove, and select Delete Rule Set from the list.
Note:
When a rule set is deleted, any rules that were used in rule groups in that rule set will still be in the rule pool, but they will be unused. The rules will be permanently lost when the project is closed unless they are used in another rule group.
-
Edit Rule Set Properties
Navigate: In the Configuration Components pane, select Project, then Solution, and then Rules. The Rule Definition window opens in the workspace.
-
In the Rule Definition window, select the rule set, right click, select Edit Properties, then select Rule Set. The Rule Set Properties Window opens in the workspace.
-
In the Rule Set Properties window, Click Add to open the Edit Attribute window in order to add a new rule set attribute.
Figure 4-28 Rule Set Edit Attribute Window

Description of "Figure 4-28 Rule Set Edit Attribute Window" -
To edit an existing rule set attribute, select the attribute/value pair and then click Edit. The Edit Attribute window opens in the workspace. The window is pre-populated with the selected rule set attribute and value that the users can edit.
-
To remove an existing rule set attribute, select the attribute/value pair and then click Remove.

Rule Groups
In RPASCE, a rule group is an ordered collection of rules that are treated as a unit by the calculation engine with the integrity of all the rules in the rule group being maintained together.
Rules within a rule group are given a priority. The calculation engine uses this to select a calculation path that follows business priorities. It does this by using rule priorities to determine which rule to enforce when there is a choice to be made. Although there may only be one active rule group at any time, multiple rule groups can be defined to satisfy different calculation requirements.
Types of Rule Groups
Rule groups may be one of four different types:
-
Load – The RPASCE application automatically uses the load rule group when loading data into a workbook from the PDS.
-
Calculate – The RPASCE application uses a calculate rule group to apply the effects of user changes to cells. RPASCE supports multiple calculation rule groups. Menu options may be configured to allow for the transition through different calculation rule groups in order to support special processes, such as authorizations. RPASCE ensures a smooth transition from one rule group to another.
-
Refresh – The RPASCE application uses a refresh rule group to refresh the data from the PDS (for example, to update actuals). Multiple refresh rule groups can be specified and selected by the user.
-
Commit – The RPASCE application automatically uses the commit rule group when committing data from the workbook to the PDS.
A measure that does not have data in the PDS may be loaded into a workbook by using a rule in the load rule group to calculate it based on other measures that are loaded. Similarly, a measure that exists in a PDS, but not a workbook, may be committed by using a rule in the commit rule group that calculates it from other measures that are in the workbook.
Rule Group Validation
Within a solution, there may be many rules defined, and each rule is validated individually. Rules within a rule group are also validated in the context of all the other rules in that rule group. While a rule may be perfectly valid syntactically, it may not be valid within the context of a particular rule group. In Rule group validation, each rule in a rule group must represent a completely different measure relationship, which means that the following restrictions apply:
-
No two rules in a rule group may use exactly the same collection of measures. If such a condition were allowed, the calculation engine would be unable to calculate either of the rules, because they would be dependent upon each other, so neither could be calculated first. This is explicitly validated in the rule tool.
-
For similar reasons, a rule normally does not use a collection of measures that is a subset of the collection of measures in another rule. If the measures that are only in the larger rule were all changed, the situation would be equivalent to the previous one. There are circumstances where this technique is valuable. For example, in a load rule group where there may be a rule to load a measure from the PDS, but other rules that include that measure. In this case, this condition is not explicitly validated.
-
There must be one (and only one) expression that calculates a recalc measure used in a rule group.
-
Other than in the special circumstance of a rule constructed from multiple result functions or procedures, a measure may only be on the left-hand side of one expression in a rule.
Note:
When performing validation on rules in RPASCE Configuration Tools, a proxy sandbox is used that only contains a small portion of information that is present in a the PDS. This proxy sandbox does not contain any information about the positions that exist in various hierarchies and dimensions. Therefore, when performing rules validation, any rule that contains a reference to a position will not be properly validated within Configuration Tools and will be marked as invalid, despite the fact that it will execute in the final PDS.
Multiple Refresh Rule Groups
The Refresh Rule Group updates (supplies new values for) data, which can generally be thought of as being external to the workbook. An example would be actuals:
-
If a workbook is built in week 5, the user would have actuals for weeks 1-4.
-
In week 6, the user can refresh the actuals to get the actuals for week 5.
The Configuration Tools and RPASCE support the use of multiple refresh rule groups. Within the rule tool, there is the ability to create multiple refresh rule groups within a rule set. These multiple refresh rule groups can then be assigned to a workbook template using the Workbook Designer, and they will be available for selection within the RPASCE Client.
-
A workbook contains all of the rule groups in a single rule set, so if multiple refresh rule groups are required in a workbook, they must all be in the same rule set.
-
You may consider naming rule groups so the usage of the refresh rule groups are reflected in their names, such as
refresh_all,refresh_actuals, andrefresh_manager.
Rule Group Transitions
Although only a single rule group may be active at any time, RPASCE supports the transition from one rule group to another, so the active rule group may be changed. The calculation engine ensures the integrity of measure relationships at all times, so this transition process is not merely a case of switching from one rule group to another, because there are no guarantees that the integrity of the rules in the rule group being transitioned into would have been maintained. There are different forms of rule group transitions. When designing rule groups, you must consider the impact of anticipated rule group transitions.
Automatic rule group transitions occur under the following circumstances:
-
On workbook building – Data is loaded using the load rule group. This typically loads measures by calculating them from the data values held on the PDS using the master modifier but may also calculate other measures that are not explicitly loaded. When the load is complete, the system automatically runs a full transition to the calculate rule group.
-
On data refreshing – Data refreshing causes some measures to be updated from values held in the PDS. The measures that are affected by the refreshed measures are treated as affected in the calculate rule group, and a normal calculation of that rule group follows. Effectively, data refreshing causes a calculation using the calculate rule group as if the cells that were refreshed were directly changed by the user.
-
On data committing – There is a full transition from the current calculate rule group to the commit rule group. This typically commits measures by calculating them on the PDS by using the master modifier. There is then a null transition back to the calculation rule group (that is, no transition process is executed since the assumption is that nothing in the workbook has changed), so no transition is required.
-
On executing custom menus – There is a full transition between each rule group in the custom menu, which is followed by a full transition back to the default calculate rule group. An optimal custom menu transition type is implemented to handle the rule group transition between the custom menu rule groups and the calc rule group of the workbook. The goal is to skip all rules in the calc rule group that are not impacted by the rules in the custom menu action, directly or indirectly, when transition back to the calc rule group from custom menu rule groups.
Create a Rule Group
Navigate: In the Configuration Components pane, select Project, then Solution, and then Rules. The Figure 4-29 opens in the workspace.

-
In the Rule Definition window, select the rule set to be used to create a new rule group.
-
From the toolbar, click New and select Rule Group, or select Create – Rule Group from the right-click menu.
The Figure 4-31 opens.
-
Complete the following:
-
In the Name field, enter the name of the rule group.
Note:
A rule group name can be a maximum of 16 alphanumeric or underscore characters. It must not have a name that is the same as any other rule group that exists in the project.
-
In the Description field, enter a description of the rule group.
-
Click OK to save any changes and close the window. The new rule group displays in the Rule Definition tree window.
-


Delete a Rule Group
Navigate: In the Configuration Components pane, select Project, then Solution, and then Rules. The Figure 4-29 opens in the workspace.
-
In the Rule Definition window, select the rule group to be deleted.
Note:
Only user-created rule groups within a rule set can be deleted. You cannot delete the default load, commit, calc, and refresh rule groups. If Delete is selected for one of the default rule groups, it will not be deleted, but all of the rules will be removed from the rule group. In either case, the rules will still exist within the rule pool, but they will be lost when the project is closed if they are not used in another rule group.
-
From the toolbar, click Delete, and select Rule Group. The group is removed from the Rule navigation tree.
Copy a Rule Group
If two rule groups are similar, it may be beneficial to copy one rule group into the other to prevent having to create a rule group from scratch. When copying the rules of a rule group into another rule group, it is possible to specify whether existing rules will be used or copies of the rules will be created. The Use Existing Rules check box defaults to using any existing rules in the rule pool. If this check box is selected, the copy rule group operation will use the same rules that the source rule group has. If this check box is unchecked, the copy rule group operation will create copies of the rules and use those copies for appending to or replacing rules in the destination rule group.
Note:
The rule group to be copied into must already exist. A new rule group cannot be created through this process.
Navigate: In the Configuration Components pane, select Project, then Solution, and then Rules. The Figure 4-29 opens in the workspace.
-
In the Rule Definition window, select the rule group to be copied.
-
From the toolbar, click Advanced, and select Copy Rule Group. The Copy Rule Group window opens.
-
Complete the following:
-
Using the Rule Set list, select the destination rule set.
-
From the Rule Group area, select the desired destination rule group.
-
Using the Replace or Append Rules list, select either:
Replace – To overwrite all rules that already exist in the destination rule group.
Append – To add to the rules already in the destination rule group.
-
Click OK. The Confirm Operation window opens.
-
-
Click OK. The rules are copied to the selected rule group.

Edit Rule Group Properties
Navigate: In the Configuration Components pane, select Project, then Solution, and then Rules. The Figure 4-29 opens in the workspace.
-
In the Rule Definition window, find the rule set containing the rule group to be modified. Select the rule group, right click, select Edit Properties, then select Rule Group. The Figure 4-33 opens in the workspace.
-
In the Rule Group Properties window, click Add to open the Edit Attribute window in order to add a new rule group attribute.
Figure 4-34 Rule Group Edit Attribute Window
Description of "Figure 4-34 Rule Group Edit Attribute Window" -
To edit an existing rule group attribute, select the attribute/value pair and then click Edit. The Edit Attribute window opens in the workspace. The window is pre-populated with the selected rule group attribute and value that the user can edit.
-
To remove an existing rule group attribute, select the attribute/value pair and then click Remove.

Measure Validation in the Rule Definition Window
If Enable Measure Content Validation is not selected in the Workbench Preferences window, measure content validation is turned off in the Measure Manager. Measure validation must be manually initiated in the rule tool. See Measure Validation within the Measure Manager.
From the Rule Definition window, click Perform Measure Content Validation on the Rule Definition toolbar.
Rule Definition
The Rule Definition tool allows the configuration administrator to define, organize, and manage rule sets, rule groups, and rules. It also allows for the creation of expressions and addition of expressions to rules.
Rules are groups of expressions that describe the relationship between measures.
When a rule has multiple expressions, those expressions are given a priority sequence to help the calculation engine select a calculation path that follows business priorities. When given a choice, the calculation engine will always select the highest priority expression in the rule that is available to be selected. Considerable care should be taken in the design of rules to ensure that appropriate expression priorities are established. The business priority may vary from implementation to implementation, and it may vary from one type of plan to another in the same implementation.
Rules are also given a priority sequence within a rule group to help the calculation engine select a calculation path that follows business priorities. When given a choice, the calculation engine will always select the highest priority rule that needs to be calculated.
Those who are configuring the calculation requirements of a solution are expected to fully understand the operation of the RPASCE calculation engine.
Create a Rule and Add It to a Rule Group
Complete the following steps to create a rule and add it to a Rule Group.
Navigate: In the Configuration Components pane, select Project, then Solution, and then Rules. The Figure 4-29 opens in the workspace.
-
In the Rule Definition window, select the rule group in which you want to create a rule. If you want the rule to be created in a particular position in the sequence of rules in the rule group, select the rule before which you want the new rule to be placed. The new rule will be created higher than the selected rule.
-
Choose one of the following methods:
-
From the toolbar, click New and select Rule.
-
Click Create..., then Rule from the right-click menu.
-
Press Ctrl+R.
The Figure 4-36 opens.
-
-
In the Name field, enter the name of the rule.
Note:
A rule name can be a maximum of 24 alphanumeric or underscore characters. It must not have a name that is the same as any other rule that exists in the project. Rule names may start with a letter or an underscore but may not start with the letter r or R followed by a number.
-
In the Description field, enter a description of the rule.
-
Click Next. The Expression Builder window of the Add Rule window opens.
Figure 4-37 Specify Expression for Add Rule

Description of "Figure 4-37 Specify Expression for Add Rule" -
Type the expression in the input box or complete the following to use the Expression Builder.
-
Click Expression Builder (located to the right of the text box). The Expression Builder window opens.
-
In the upper left-hand pane, select the measure components to filter measures to be visible for pasting into the expression. If External Measures are required in the expression, check the Include External Measures check box. Realized measures meeting the filtering conditions are displayed in the lower left-hand pane.
Figure 4-39 Include External Measures Check Box

Description of "Figure 4-39 Include External Measures Check Box" -
In the lower left-hand pane, double-click any measures to be used in the expression to get the measure name pasted at the insertion point in the expression.
Note:
Place the mouse over the name of a function, procedure, keyword, or modifier to see a tooltip that explains its function.
-
From the drop-down list, select a category of functions, procedures, keywords, or modifiers. Double-click on a specific function, procedure, keyword, or modifier to be used in the expression, and (if appropriate) outline syntax pasted at the insertion point in the expression.
The outline syntax of a function, procedure, keyword, or modifier is pasted with components of the syntax separated with braces {}. When the insertion point is in a component of the outline syntax in the expression, you will see a description of the component at the bottom of the expression window. When the insertion point is in a component of the outline syntax, anything that is entered or pasted replaces the whole component.
If the function, procedure, keyword, or modifier that is pasted has optional arguments (for example, the cover function has optional arguments for an offset expression and a wrap-around expression), you will be presented with the following window to select which of the optional arguments to use in the expression. Note that all arguments are positional, so if a later argument is selected, all earlier arguments will be automatically selected. If an earlier argument is cleared, then all later arguments are automatically cleared.
Figure 4-44 Select Optional Arguments Window

Description of "Figure 4-44 Select Optional Arguments Window"If the function, procedure, keyword, or modifier that is pasted has repeating arguments (for example the min function finds the minimum of a variable number of expressions), a window opens to select how many of the repeating arguments to use in the expression.
-
Use the keyboard or buttons to add the appropriate mathematical operators and constants to construct the expression.
-
When you have defined the expression as needed, click Finish and close the window.
Note:
If an invalid expression is created, a warning message is displayed.
-
-
To add further expressions to the rule, click Add, and repeat the process of entering an expression.
-
Click OK to save any changes and close the window.
-
If the newly defined rule's expressions use exactly the same measures as another rule that already exists in the Rule Pool, the Figure 4-45 opens. The window shows all rules that use exactly the same measures as the newly defined rule. This provides you with an opportunity to use an existing rule from the Rule Pool or to continue with the new rule. The Similar Rules Found window allows you to view rules, associated expressions, and rule groups that contain the rules. The rule table may be filtered based on the rule name or by measure. Click Use Existing Rule or Use New Rule to save changes and close the window.
The new rule is placed preceding the rule that was selected at the start of the process in the sequence of rules in the rule group or at the end of the rule group if no rule was selected.
Note:
If Use Existing Rule or Use New Rule is not selected and the window is closed manually, a new rule is created.


Add an Existing Rule to a Rule Group
Using the Add Existing Rules window, you may select multiple rules to add to a rule group. If at least one of the selected rules is already in the rule group, the OK button will gray out disallowing the operation until that rule is cleared. When multiple rules are selected, the expression and rule group displays will go blank. However, if there is only one selected rule, the rule's expressions and the list of rule groups that use the rule will be displayed.
Navigate: In the Configuration Components pane, select Project, then Solution, and then Rules. The Figure 4-29 opens in the workspace.
-
In the Rule Definition window, select the rule group to be used to add an existing rule. If the rule is to be placed in a particular position in the sequence of rules in the rule group, select the rule in which the new rule is to precede.
-
Choose one of the following methods:
-
From the toolbar, click New and select Using Existing Rule.
-
Select Create – Using Existing Rule from the right-click menu.
-
Press Ctrl+P.
The Figure 4-46 opens.
-
-
Filter by Rule Name or by Measure and view the associated expressions to find the correct rule. Filtering means that all data are compared, but only matching data is allowed to pass through. In order to filter by Rule Name or by Measure, type a filter string (for instance, ExCpSls in the input box directly under the Title Bar. Click Filter by Measure, and only those measures with ExCpSls display.
-
Click the rule in the table to select it.
-
Click OK to save changes and close the window.
The rule is placed higher than the rule that was selected at the start of the process in the sequence of rules in the rule group or at the end of the rule group if no rule was selected.


Apply a Rule Pattern to Create New Rules or to Update Existing Rules
The Apply Rule Pattern functionality allows you to create new rules or update existing rules according to a pattern established by a selected base or template rule. The rule tool recognizes inherent similarities or patterns in measure components used in some rules when compared to the base or template rule. Based on these similarities, the rule tool allows for the creation of new rules or update of existing rules to fit the pattern set by the base or template rule.
When the Apply Pattern capability is enabled, there is a possibility that some of the New or Updated rules will have the same expressions as a rule that already exists in the rule pool. If this happens, the Similar Rules Found window opens and provides the option of using the existing rule or actually creating a new one.
Navigate: In the Configuration Components pane, select Project, then Solution, and then Rules. The Figure 4-29 opens in the workspace.
-
In the Rule Definition window, select any rule group that contains the rule to use as the pattern basis.
-
Select the rule whose pattern is to be used as a basis for creating or updating rules.
-
From the toolbar, click Advanced and then select Apply Pattern, or right-click and select Advanced and then, Apply Pattern.
A Figure 4-48 opens containing a set of rules that are presented for selection. This set is composed of rules whose measures follow the selected rule's pattern in terms of the individual measure components used. The set of rules are composed of potential new rules or potential updated rules.
Example:
Consider a configuration with three components in the measure naming scheme:
-
a version (such as Wp)
-
a metric (such as Shrink)
-
a unit of measure (such as V)
If the selected base rule is:
{ WpShrinkU WpShrinkAUR | WpShrinkV }
...then the rules:
Rule1: { WpSlsU WpSlsV WpSlsAUR | }
...and
Rule2: { WpRecU WpRecV WpRecC | }
...would fit the pattern and be included in the list.
Rule1 fits the pattern because its measures use the same measure components with the exception of the metric component. For the Metric component, the base rule uses Shrink, and Rule1 uses Sls consistently. In this case, the tool will present the rule:
{ WpSlsU WpSlsAUR | WpSlsV }
...as a possible update for Rule1.
The update results in the conversion of Rule1 to a rule that uses the same measures as the original Rule1, but it has the expression pattern of the base rule.
Rule2 fits the pattern because it uses the same Version as the base rule. For the Metric component, the base rule uses Shrink, and Rule2 uses Rec consistently. Unlike Rule1, Rule2 uses C as the Unit of Measure in one of its measures. This is not an exact fit like Rule1. In this case, the tool will present the rule { WpRecU WpRecAUR | WpRecV } as a possible new rule. Notice that this rule is forced to be an exact fit as Rule1 was.
-
-
Select the rule replacement policy in the Use Existing Rules drop-down menu. This allows the user to select, on a rule-by-rule basis, which rules to reuse and which to re-create. By default, this is set to Always.
-
When Always is selected, rules that already exist elsewhere in the configuration will always be used in place of the newly generated rules.
-
When Never is selected, new rules will always be created, even if an identical rule already exists elsewhere in the configuration.
-
When Prompt is selected, the Rule Locator window will be presented for each rule whose expressions already exist elsewhere in the configuration.
-
-
From the list of possible new and updated rules, select those to be updated or added to the rule group. In either case, if rule reuse is specified in Step 4, a new rule will not be created, but the rule existing elsewhere in the configuration will be used in its place.
-
Click OK.
A selected rule that is labeled New Rule will be added to the end of the rule group. The new rule's name will default to the template rule's name suffixed with a number to keep the name unique. A selected rule that is labeled Update Rule is already in the rule group and will be replaced. This means that the old rule will be removed and replaced with a new rule whose expressions follow the base rule's expression pattern. In both cases, the rule will follow the pattern of the base rule's expression.

Delete a Rule from All Rule Groups
This procedure deletes the rule from all rule groups that contain this rule as well as from the Rule Pool. If the desired action is to remove the rule from a rule group, but to retain it in other rule groups, follow Remove a Rule from a Rule Group.
Navigate: In the Configuration Components pane, select Project, then Solution, and then Rules. The Figure 4-29 opens in the workspace.
-
In the Rule Definition window, select any rule group that contains the rule to be deleted.
-
Select the rule to be deleted.
Note:
If multiple rules are selected, only the last selected rule is deleted.
-
From the toolbar, click Delete and select Delete Rule, or select Delete, then Remove, and then Delete Rule from the right-click menu. The Figure 4-49 opens.
-
Verify that the rule selected in the table is the rule to be deleted or click to select a different rule in the table.
-
Click Delete Rule to delete the rule and close the window.

Remove a Rule from a Rule Group
This procedure removes the rules only from the currently selected rule group. If the desired action is to delete the rules from all rule groups and the rule pool, see Delete a Rule from All Rule Groups.
Navigate: In the Configuration Components pane, select Project, then Solution, and then Rules. The Figure 4-29 opens in the workspace.
-
In the Rule Definition window, select the rule group that contains the rules to be removed.
-
Select the rules to remove.
Note:
Multiple rules can be selected by holding the Control (Ctrl) key as the individual rules are selected, or by clicking one rule and holding Shift key as another rule is selected, which selects all rules between the two that were clicked. A selected rule is indicated by a bold rule name
-
From the toolbar, click Delete and then select Remove Rules, or select Delete, then Remove…, and then Remove Rules from the right-click menu.
The rules are removed from the rule group but are still in the rule pool. The rules are permanently lost when the project is closed, unless they are used in another rule group.
Edit Properties of a Rule
Complete the following steps to edit the properties of a rule.
Navigate: In the Configuration Components pane, select Project, then Solution, and then Rules. The Figure 4-29 opens in the workspace.
-
In the Rule Definition window, select any rule group that contains the rule to edit.
-
From the rule group, select the rule to edit.
-
From the toolbar, click Edit and then Select Rule, or select Edit Properties..., then Rule from the right-click menu. The Figure 4-50 opens.
-
To edit the name of the rule, enter a new name in the Name field.
Note:
A rule name can be a maximum of 24 alphanumeric or underscore characters. It must not have a name that is the same as any other rule that exists in the project. Rule names may start with a letter or an underscore but may not start with the letter r or R followed by a number.
-
To edit the description of the rule, enter a new description in the Description field.
-
To edit attributes for a rule:
-
Select the attribute to edit.
-
Click Edit. The Figure 4-51 opens.
-
Update the information as necessary.
-
Click OK to save any changes and close the window.
-
-
To remove attributes from a rule:
-
Select the attribute to delete.
-
Click Remove. The attribute is removed from the display box.
-
-
Click OK to save any changes and close the window.


Rename All Rules in a Rule Group
Complete the following steps to rename all rules in a Rule Group.
Navigate: In the Configuration Components pane, select Project, then Solution, and then Rules. The Figure 4-29 opens in the workspace.
-
In the Rule Definition window, select the rule group that contains the rules to rename.
-
From the toolbar, click Advanced and select Rename All Rules, or select Advanced – Rename All Rules from the right-click menu. The Figure 4-52 window opens.
-
In the Prefix field, enter a prefix up to ten characters in length, which is the start of all rule names.
-
Click OK. The Figure 4-53 window opens.
-
Click Yes.
Note:
All of the rules in the rule group are renamed with the prefix followed by a 4-digit numeric identifier generated by the rule tool. The rule tool will maintain the order that the rules were in before they were renamed, and it uses that order in generating the numeric identifier.
Note:
Since rules may appear in more than one rule group, use of this feature may generate rule names that look out of place in other rule groups, especially if the prefix implies the rule group.


Filter Rules in a Rule Group
Complete the following steps to filter rules in a Rule Group.
Navigate: In the Configuration Components pane, select Project, then Solution, and then Rules. The Figure 4-29 opens in the workspace.
-
In the Rule Definition window, select a rule group.
-
In the Rule Definition window, click Rule Filtering.
Figure 4-54 No Filtering Button in Rule Definition Window

Description of "Figure 4-54 No Filtering Button in Rule Definition Window"Note:
This is a dynamic button, and the text changes depending on the current filter mode.
-
Select one of the following options:
-
Disable Filtering – All rules display.
-
Filter by Measure – Works in conjunction with the measure components box in the bottom left corner of the screen. Rules are filtered to show those whose measures conform to the selected component scheme.
-
Filter by Size – Rules are filtered to show those with more than one expression.
-
Filter by Validity – Only invalid rules display.
Note:
When rule filtering is active, the buttons used to reorder rules in the rule group are unavailable.
-
- Include External Measures
For the Filtering by Measure option, users can further toggle the check box of Include External Measures to control whether or not external measures of this solution are considered when filtering rules based on measures. When the Include External Measures check box is not selected, only rules containing the internal measures that conform to user-selected measure components are displayed in the right rule panel.
When Include External Measures check box is selected:-
If at least one external measure conforms to the measure components selection, then the rules containing realized measures, both internal and external, that conform to the user measure component selection, are displayed.
-
If no external measure conforms to the measure components selection, then the rules containing either the conforming, internal realized measures or any external measure for this solution are displayed.
-
Reordering Rules in a Rule Group
Complete the following steps to reorder rules in a Rule Group.
Navigate: In the Configuration Components pane, select Project, then Solution, and then Rules. The Figure 4-29 opens in the workspace.
-
In the Rule Definition window, select the rule group that contains the rules to reorder.
-
Select the rule to reorder.
-
Complete the following as needed:
-
Use the Up or Down arrows on the Rule Definition toolbar to move the rule up or down the list.
-
Click the up or down arrows to the left of the rule name to move the rule up or down the list.
-
Auto Generate Load and Commit Rules
Complete the following steps to auto generate Load and Commit Rules.
Navigate: In the Configuration Components pane, select Project, then Solution, and then Rules. The Figure 4-29 opens in the workspace.
Rules for the load and commit rule groups in a rule set can be auto-generated based on the calc rule group. The measures referenced in the calc rule group are assumed to be all of the measures in a workbook (if there are others, manually add their load and/or commit rules). A load or commit rule is generated for all of those measures that have a database allocated (those that are physically stored).
-
Select the rule set for which load or commit rules are to be auto generated or select any rule group in that rule set.
-
Complete one of the following methods:
-
From the toolbar, click Advanced and select Generate Load Rules or Generate Calc Rules
-
Select Advanced then Generate Load Rules or use the right-click menu to select Advanced then Generate Calc Rules.
The Figure 4-55 window opens to inform you that this process cannot be undone.
-
-
Click Yes.
Rules are automatically generated and named for the load or commit rule group. There is one rule with a single expression that is generated for each measure used in the calc rule group for the rule set that has a database assigned.
In the load rule group, the rules are named
<rulesetname>Lnnnwhere nnn is a 3-digit order number. The rules in a commit rule group are similarly named<rulesetname>Cnnn. The expression in a generated rule in a load rule group is of the form:<measurename> = <measurename>.masterand in the generated commit rule group are of the form:
<measurename>.master = <measurename>
Copy Selected Rules to Another Rule Group
Complete the following steps to copy selected rules to another Rule Group.
When copying selected rules of a rule group into another rule group, it is possible to specify whether existing rules will be used or copies of the rules will be created. The Use Existing Rules check box defaults to using any existing rules in the rule pool. If this check box is selected, the copy selected rules operation will use the same rules that the source rule group has. If this check box is not selected, the copy selected rules operation will create copies of the rules and use those copies for appending to or replacing rules in the destination rule group.
When the user uses the Find/Replace feature, it is possible that a changed rule will have the same expressions as a rule that already exists in the rule pool. If the Use Existing Rules check box is selected, the Similar Rules Found window opens. You have the option of using the existing rule or creating a new one.
Navigate: In the Configuration Components pane, select Project, then Solution, and then Rules. The Figure 4-29 opens in the workspace.
-
Select the Rule Group that contains the rules to copy, and select the individual rules to be copied.
Note:
To select multiple rules, press the Ctrl key and click the rules to select, or click one rule and hold Shift key as selecting another rule, which selects all rules between the two that have been selected. A selected rule is indicated by a bold rule name.
-
Complete one of the following methods:
-
From the toolbar, click Advanced, and select Copy Selected Rules.
-
Select Advanced – Copy Selected Rules from the right-click menu.
-
Press Ctrl+C.
The first Figure 4-56 opens.
Figure 4-56 Copy Selected Rules Window (1)

Description of "Figure 4-56 Copy Selected Rules Window (1)" -
-
In the Rule Set field, select the copy's destination rule set.
-
In the Rule Group area, select the desired copy's destination Rule Group.
-
Check the Use Existing Rules check box if the rules should be added to the destination Rule Group. If the User Existing Rules check box is clear, copies of the selected rules are created for the destination Rule Group instead.
Note:
If the Find or Replace functionality is used, copies are created for affected rules even if the Use Existing Rules check box is checked.
-
In the Replace or Append Rules field, select:
-
Replace – To remove all rules that already exist in the destination rule group before the copy.
-
Append – To add to the rules already in the destination rule group.
-
-
Click Next. The second Figure 4-57 opens. This window allows you to select or clear rules from those originally selected to copy when the check box beside the rule name is selected.
Figure 4-57 Copy Selected Rules Window (2)

Description of "Figure 4-57 Copy Selected Rules Window (2)"
Find and Replace Measures in the Copied Rules
The ability to find or replace in the copy rules is a very powerful and useful feature. This feature can be used to build a collection of rules and clone them to a very similar collection of rules. For example, a collection of rules that calculate a series of variances with one version can be cloned to produce rules that calculate a series of variances with another version.
-
Click Find/Replace. The Figure 4-58 opens.
-
In the Find field, enter the portion of the measure to replace.
Note:
The Find function is case sensitive.
-
In the Replace With field, enter the string to replace the portion of the measure name.
-
Complete one of the following:
-
Select Forwards to search the rules in order
-
Select Backwards to search the rules in reverse order.
Note:
Searching Forwards proceeds from left to right starting with the first measure of the first expression of the first selected Rule and will go through all expressions in all selected Rules. Similarly, searching Backwards flows in the reverse direction starting with the right most measure of the last expression in the last Rule selected.
-
-
Click Find Next. The first candidate measure to be replaced displays in the bottom left field.
-
Complete the following as needed:
-
Click Replace/Find Next to replace the current candidate measure and display the next candidate measure.
-
Click Replace All to replace all instances in all the selected Rules of the current candidate measure. For example, if a search for Wp finds WpRecV, click Replace All to complete a replace on all instances of WpRecV in all the selected Rules.
-
Click Find Next to skip over that occurrence of the portion of the measure name and go onto the next one.
The Figure 4-59 opens.
-
-
Replace the rules.
Using the Figure 4-59, you can replace a portion of the rules (for instance a prefix) either for all instances of the rules or only for the new instances (where the old instances are not affected).
Example:
Suppose you create a series of rules for the Executive (Ex) Calc Rule Group and you want to use these as a model for the Manager (Mg) Calc Rule Group. Each of these original rules contains expressions with the Ex prefix. Each such instance needs to be replaced with Mg.
-
Click Use Existing Rules to replace every instance of Ex.
-
Click Use New Rule to replace the new instances of Ex without affecting the previous rules that contain Ex.
-
-
Click X to close the Figure 4-58.
-
Click OK.
-
Click Yes to confirm.
The copies of the rules are placed in the target rule group. These copies have names that start with as many characters as possible from the name of the original rule and end with an underscore and number.


Expressions and Rules
An expression describes and solves the relationship between measures in a way that causes a measure to be calculated through the expression. They form the basis for all calculations of the relationships between measures, and they are evaluated by the calculation engine during a calculation. In some cases, there may be business reasons for wanting more than one of the measures in a relationship to be calculable or solvable through that relationship. Expressions are written in a syntax that allows for the calculation of a single measure from other measures, constants, and parameters by using standard arithmetical functions and a rich set of mathematical, technical, and business functions. Expressions have multiple results.
Example:
Expression 1: ReceiptUnits = ReceiptsValue / ReceiptsPrice
This expression specifies the way ReceiptUnits are calculated. ReceiptUnits are calculated by dividing ReceiptsValue by ReceiptsPrice.
Note:
Measures are not only calculated based on expressions. They are also calculated based on spreading and aggregating.
Reorder an Expression in a Rule
Complete the following steps to reorder an expression in a Rule.
Navigate: In the Configuration Components pane, select Project, then Solution, and then Rules. The Figure 4-29 opens in the workspace.
-
In the Figure 4-29, select any rule group that contains the rule whose expression is to be reordered.
-
Choose one of the following methods:
Expand the rule to view the expressions associated with the rule. Click Toggle from the Rules toolbar and select Expand All Expressions.
Click Plus for the rule.
Figure 4-60 Expand All Expressions Options

Description of "Figure 4-60 Expand All Expressions Options" -
Use the up and down arrows to move the expression up or down the list.
Edit an Expression in a Rule
Complete the following steps to edit an expression in a Rule.
Navigate: In the Configuration Components pane, select Project, then Solution, and then Rules. The Figure 4-29 opens in the workspace.
-
In the Figure 4-29, select the rule whose expression is to be edited.
-
Choose one of the following methods:
-
From the toolbar, click Expression Builder.
-
Select Edit Expressions from the right-click menu.
-
Press Ctrl+E.
The Figure 4-61 opens.
-
-
Choose one of the following methods to edit an expression:
Edit the expression in its text box.
Click Expression Builder for the expression to edit. The Figure 4-62 opens. Use the Expression Builder to make necessary changes and click Finish when complete.
-
Click OK to save the changes and close the window.


Delete an Expression from a Rule
Complete the following steps to delete an expression from a Rule.
Navigate: In the Configuration Components pane, select Project, then Solution, and then Rules. The Figure 4-29 opens in the workspace.
-
In the Rule Definition window, select the rule whose expression is to be deleted.
-
Choose one of the following methods:
-
From the toolbar, click Expression Builder.
-
Select Edit Expressions from the right-click menu.
-
Press Ctrl+E.
The Figure 4-61 opens.
-
-
Click Delete (located to the left of the expression in the Edit Expressions window.
-
Click OK to delete the expression. The expression is permanently deleted from the rule.
Note:
If the only expression in the rule is deleted, the rule will be flagged as being invalid, because it has no expressions.
Add an Expression to a Rule
Complete the following steps to add an expression to a Rule.
Navigate: In the Configuration Components pane, select Project, then Solution, and then Rules. The Figure 4-29 opens in the workspace.
-
In the Rule Definition window, select the rule that will have an expression added.
-
Choose one of the following methods:
-
From the toolbar, click Expression Builder.
-
Select Edit Expressions from the right-click menu.
-
Press Ctrl+E.
The Figure 4-61 opens.
-
-
Click Add to add a new expression in the Edit Expressions window.
-
Choose one of the following methods:
-
Enter the expression in its text box.
-
Click Expression Builder for the expression to edit. The Figure 4-62 opens.
Use the Expression Builder to define the rule and click Finish when complete.
-
-
Click OK to add the expression.
Named Rule Pattern
The named rule pattern functionality allows user to simplify rule generation by defining rule patterns explicitly and then generate large quantity of similar rules from them. Two steps are required: First, define rule patterns using tokens and expressions, and give a unique name for each pattern; second, provide token values and generate rules from the selected pattern.
The named rule patterns are saved into a separate rulepattern.xml file. When user opens the application configuration in ConfigTools, the saved rule patterns are loaded and can be used to generate new rules.
When applying the pattern, users need select which pattern, which realized measures or measure components to replace tokens in the pattern definition.
Note: Although example below show sophisticated rule generation, currently RPASCE limits support to only Load and Commit rules, while other types might be supported in future releases.
Mandate Requirements
-
The rule pattern name must be unique across the application. The name can be a maximum of 16 alphanumeric or underscore characters.
-
Rule pattern name may start with a letter or an underscore, but may not start with the letter r or R, and must be immediately followed by a number.
-
The token used in a rule pattern is wrapped between $$ and $$. For example, for rule pattern rp1, the pattern definition for a load rule is $$M1$$=$$M1$$.master.
-
One rule pattern must contain only one expression.
-
The realized measure name token must start with M, for example, $$M1$$.
-
The measure component token must start with C, for example, $$C1$$$$C2$$$$C3$$$$C4$$ can be used for the measure ADDVMkdMn, ADDVMkdMx etc, while C1 for measure component AD, C2 for DV, C3 for Mkd or Nsls, and C4 for Mn.
-
The generated rules have the naming convention of rulePatternName +"_" + ID (left padded with 0 to help sorting), for example., rp1_00001, rp1_00002 etc with rp1 as the rule pattern name.
Navigate
In the Configuration Components Pane, select Project, then Solution, and then Rules.
-
Open the Pattern menu
Figure 4-63 New Rule Pattern Menu

-
Select Define rule pattern. Use the pop-up that is displayed to add, modify or remove rule patterns.
Figure 4-64 Named Rule Patterns

-
Pre-select a rule group where the rules are to be added or modified. When you select the Apply Rule Patterns menu item, the Named Rule Pattern dialog box is displayed.
Figure 4-65 Named Rule Pattern Dialog Box

Select a named rule pattern rp3 from the drop-down list. The pattern definition is shown in the Read-Only text area below.
-
Click the Apply button to display the Build Rules dialog box..
Figure 4-66 Build Rules Dialog Box

-
In the above dialog box, the user can either type token values directly into the blank text field, or click Select to display the Select Measures dialog box..
The check box for Include External Measures is enabled for M tokens, that is, realized measure tokens. The user must explicitly check it to include external measures for this solution into selection.Figure 4-67 Select Measures Dialog Box

Use the top tree pane to select measure components. The bottom pane displays the selected realized measures for M tokens or leaf measure classes for C tokens. For C tokens, all leaf measure classes of the selected measure components are displayed in the bottom pane. As shown, multiple leaf measure classes Mkd and Nsls are selected for token C3.
-
Once values for all tokens are selected, the user must click OK to accept them. Then, the Build Rules dialog box displays these values.
Figure 4-68 Build Rules Dialog Box

-
Click OK to accept the token values. You see the Named Rule Pattern dialog box with the candidate rules generated.
Figure 4-69 Generated Candidate Rules
 The candidate rules are generated based on the permutation of all selected token values.
Figure 4-70 Permutation of Selected Token Values

All generated candidate rules are displayed in the bottom Rule list pane, with the check box in front of each rule. By default, the check box in front of each rule is selected. The invalid rules are displayed in RED. The users can inspect and deselect candidate rules that they do not want to include in the pre-selected rule group.
If the pre-selected rule group already contains a rule having same rule signature (the same left hand side measures and the same right hand side measures) as the candidate rule, then this candidate rule has status of Update Rule instead of New Rule. Select this kind of candidate rule to update the existing rule in the rule group with the new rule definition.
The generated candidate rules rp3_00001 and rp3_00002 shown above have the status of Update Rule as they have the same rule signature as in existing rules rp4_00001 and rp4_00002 in the rule group AD_POC_LOAD.
-
Once the candidate rules are selected, click OK to confirm it. Then, the pre-selected rule group will contain the new and updated rules.
Figure 4-71 New and Updated Rules

The invalid rule rp3_00003 is highlighted in RED. Its validation error/warning message is displayedin the bottom Task List Pane so that the user can inspect and correct this rule.
RPASCE Functions, Procedures, Keywords, and Modifiers
RPASCE functions, procedures, keywords, and modifiers are mechanisms for completing operations within an expression that are controlled and executed by the calculation engine. There is a rich collection of available functions, procedures, keywords, and modifiers that can be further extended for an implementation if required.
See Appendix – Rules Function Reference Guide for details about RPASCE functions, procedures, keywords, and modifiers.
Workbooks
A workbook is an easily viewed, easily manipulated multidimensional framework that is used for interactive business functions in the configured solution. To present data, a workbook can contain any number of multidimensional spreadsheets, called worksheets, as well as graphical charts and related reports. All these components work together to allow you to view and analyze business functions.
The Workbook Designer allows for the creation selection, and integration of the various components of a workbook template, which is a pre-designed workbook that is formatted for RPAS CE users to view and manipulate data. It contains workbook tabs, worksheets, rule groups, wizards, and workflow processes.
Take the time to design a well-planned workbook. Workbooks must be laid out in a logical format and must be easy to navigate. When configuring a workbook, think about how the workbook will be used by the users in the RPASCE Client. Understand the business process flow and what end users will need to access most. Most likely, this information must be contained in the first workbook tab and worksheet.
The names of all of the workbook components must be intuitive to an end user.
Note:
The internal RPASCE names need to be unique across all workbook components in a project. This includes workbook, tab, worksheet, wizard, and custom menu names.
Workbook Components
The following sections describe components found in workbooks:
Note:
- Workbook Transitions, defined within the Workbook Properties Panel, are not supported in RPASCE.
- The use of the Library, Use Custom Wizard, and Custom Wizard in the General tab of the Workbook Properties Panel is not supported in the RPASCE platform.
- While Style Overrides, configured within the Worksheet Properties Panel, are still supported in RPASCE, many properties of a configured style cannot be honored within the RPASCE platform.
- The RPASCE platform does not support the use of worksheets with a view type of Detail Popup or Tiled View.
- The use of the Auto PQD or Lock PQD Dimensions properties within the General tab of the Worksheet Properties Panel is not supported in the RPASCE platform.
Workbook Tabs
A workbook tab is a major subdivision of a workbook. Each workbook contains at least one workbook tab by default, but additional tabs can be added for organizing workbooks to support business needs. The workbook designer allows you to define and name tabs and to specify their order in the workbook.
Worksheets
Worksheets are multidimensional spreadsheets that are used to display workbook-specific information. Workbooks can include one or many worksheets. Worksheets can present data in the form of numbers in a grid, or the numeric data values can be converted to a graphical chart.
Workbook Designer
The Workbook Designer provides a visual represent of your workbooks, workbook tabs, and worksheets.

The Workbook Designer contains the following areas:
-
Workbook Tree - The workbook tree provides a visual representation of the workbooks, workbook tabs, and worksheets. In the example provided, Executive Planning and Manager Planning are workbooks. Inventory and Sales are workbook tabs. Beginning/Ending Inventory and Sell Through are worksheets, which are contained in the Inventory and Sales workbook tabs.
-
Workbook Toolbar - This toolbar is used to complete common tasks. The buttons available depend on the item selected in the Workbook Designer window.
Note:
Users can toggle the collapse and expand of all workbook template trees using the – or + button in the Toolbar. -
Workbook Tabs - The workbook tabs are used to define property at the workbook level. The tabs displayed depend on whether a workbook, workbook tab, or worksheet is selected from the Workbook tree. In Figure 4-72, Executive Planning (a workbook) is selected. The seven workbook tabs displayed are available to define specific properties for your workbook. For information on these tabs, refer to Workbook Tabs.
Participation Measures Overview
An extended measure or participation measure is a measure that contains the value of the current positions as a proportion of the value at a Parent level, for example, sales as a percent of the class sales. These measures can be viewed and edited, and they may be preconfigured through the RPASCE Configuration Tools or dynamically defined in the RPASCE Client in a worksheet.
Typical uses of this functionality are to define measures that are percentage participations of sales measures. Typically, these are either to a fixed level (such as class) so the participation of each item to the class can be viewed and manipulated, or they are to the next level up in the product hierarchy.
The following procedures use the sample product hierarchy structure as shown in Figure 4-73
Figure 4-73 Sample Product Hierarchy Structure
Description of "Figure 4-73 Sample Product Hierarchy Structure"
Note the following important points when using this feature:
-
Changing the percentage of the extended measure will cause the values of the underlying measure to change to reflect the newly set percentage.
-
Multiple extended measures can be defined for the same underlying measure; however, only one extended measure or the underlying measure can be edited before calculation occurs. All other versions will be protected.
-
The value of an extended measure is a fraction between zero and one. You must format the measure to be displayed as a percentage if desired.
Create a Workbook
Complete the following steps to create a workbook.
Navigate: In the Configuration Components pane, select Project, then Solution, and then Workbooks. The Figure 4-72 opens in the workspace.
-
Choose one of the following methods:
-
From the Workbook Designer toolbar, click New Workbook.
-
Right-click in the Workbook tree area and select New Workbook.
-
Select an existing workbook and press Insert.
A new workbook is created.
-
-
Enter information for the tabs displayed across the top of the Workbook Designer window as necessary. Refer to Defining Workbook Properties for more information.
Note:
Double-click on the fields in the Value column to enter the information.
Patch Workbook with New Attributes
RPASCE can receive new positions and attributes from other systems via scheduled batch jobs and sometimes on demand. The PDS patching process incorporates this new information into existing PDSs, but not for existing workbooks. Existing workbooks must usually be re-built to pick up the new information, but if the existing workbooks have uncommitted data, that data will be lost.
One way to alleviate the problem is to patch the dimension attributes within existing workbooks from the RPASCE client. To do this, the user must pre-configure the workbook via the Dim Attr Setup Date Measures property in the General tab of the Workbook Design Window. For more information about this property, see the Defining Workbook Properties. Note that this approach only enables patching the defined two-dimensional attributes within the workbook.
Edit Workbook Properties
Complete the following steps to edit workbook properties.
Navigate: In the Configuration Components pane, select Project, then Solution, and then Workbooks. The Figure 4-72 opens in the workspace.
-
Select the workbook and click on the tab to edit. For information on these tabs, see Defining Workbook Properties.
-
Update the information as appropriate.
-
To remove information from any of the tables:
-
Select the row.
-
Right-click and select Remove.
-
Defining Workbook Properties
When a workbook is selected from the Workbook Designer window, the following tabs display in the workspace:
Refer to these topics for information on using these tabs to define the workbook properties.
General Tab
This section describes the default fields that display on the General tab.

Group
In the RPASCE Client, workbooks are grouped together under tabs (workbook template groups) to make it easier for the end user to find and select the needed workbook when solutions have multiple workbooks. This is the internal RPAS name of the group that this workbook belongs to.
Group Label
In the RPASCE Client, workbooks are grouped together under tabs (workbook template groups) to make it easier for the end user to find and select the needed workbook when solutions have multiple workbooks. This is the label the end user sees of the group to which this workbook belongs to. If different labels are entered for the same workbook group against different workbooks, the workbook group label shown to the end user will effectively be arbitrary.
Workbook Type
This property is reserved for use when custom extensions are written. It enables the custom extension to determine the type of the template where the template type has a meaning defined by the custom extension writer. When there is no custom extension, this field is set to the value DynamicTemplate by default.
Library
When the Workbook Type is not DynamicTemplate, it needs to be associated with a relevant custom shared library. This field holds the name of that library. When there are no custom extensions, this field is set to Template by default. The name entered here needs to be consistent with the custom extension. For example, if a value of ABCTemplate is entered in this field, the custom library needs to be named ABCTemplateLib and the directory where the custom extension looks for configuration files in the application will be repos/ABCTemplates.
Wizard Only
The Wizard Only option is only used under circumstances when custom code is to be executed in a batch job at the end of the wizard process (which typically uses custom wizards) instead of building and opening a standard workbook. The selections made in the wizards are passed to the custom code. Therefore, a workbook with the Wizard Only option selected is not a workbook. However, the workbook infrastructure is used so that the process can have a name and label and be assigned to a workbook group. This allows end users to select a Wizard Only template using the same process as workbooks. Workbooks that have the Wizard Only option selected do not need tabs or worksheets defined, but they do need a name, label, and workbook group.
Rule Set
Selects the rule set to use with the workbook. The list of rule sets to select from includes all the rule sets in the same solution as the workbook template.
Use Default Rules
Select this option to use the default rules (Load, Commit, Calc, and Refresh) associated with the rule set. If this option is selected, the Load Rules, Commit Rules, Calc Rules, and Refresh Rules properties are unavailable. If the option is not selected, the Load Rules, Commit Rules, Calc Rules, and Refresh Rules properties are enabled.
Load Rules, Commit Rules, and Calc Rules
Select the rule group to apply for each rule group type. Only rule groups from the selected rule set are offered.
Refresh Rules
When the Use Default Rules option is not checked, Refresh Rules is enabled. Select the rule groups to use as refresh rule groups. When enabled, click in the Refresh Rules field. The Figure 4-75 opens.
Figure 4-75 Select and Order Multiple Rule Groups Window

Description of "Figure 4-75 Select and Order Multiple Rule Groups Window"
Use this window to specify which groups are available and used to refresh the workbook.
Partial data in a workbook can be refreshed by refreshing with a rule group that only updates some of the measures in the workbook. The order that the rule groups appear is the order in which they display to the end user when presented with a choice of refresh rule groups within the workbook.
-
In the Available Rule Groups column, select the rule group to add, and drag it to the Selected Rule Groups column.
-
Click OK to save any changes and close the window.
X Axis, Y Axis, Z Axis and Unassigned
These properties are used to define the default axis layout of the worksheets in the workbook (that is, which hierarchies appear in each axis). Before the hierarchies appear in the Axis window, you must make sure that the database and base intersection have been assigned from the Measure Manager.
The measures must also be made viewable.
-
To make measures viewable, right-click in Default and select Add Matching.
-
Click in the X-Axis, Y-Axis, Z-Axis, or Unassigned field. The Figure 4-76 opens.
-
Drag the hierarchies to the appropriate axis column.
-
Click OK to save any changes and close the window.
Note:
The hierarchies that appear in this process are the hierarchies used by measures placed on worksheets in the workbook. If no worksheets have yet been built, then no hierarchies appear in this process.

Use Custom Wizard
This determines the type of wizard to use for the workbook template. Select the check box to enable the Custom Wizard property and disable the Standard Wizard Property. Clear the check box to disable the Custom Wizard property and enable the Standard Wizard Property.
Custom Wizard
Select the custom wizard that to use to build the workbook. This field is only enabled when the Use Custom Wizard check box is selected. This field allows you to select a wizard from a list of wizards created in the Wizard Designer.
Standard Wizard
Select the dimensions to be selected by the end-user in the standard wizard, which presents a series of two tree selection panes to select the positions in the scope of the workbook to be built.
-
Click in the Standard Wizard field. The Figure 4-77 opens.
Note:
Hierarchies used in the lowest base intersection for the measures used in the rule set assigned to the workbook will be displayed. For each hierarchy, there will be a choice of dimensions. The dimensions offered will be the lowest dimension in that hierarchy that is used in the base intersection of a measure in the rule set assigned to the workbook, plus all higher dimensions.
For a hierarchy in the workbook for which a wizard is not available, all the positions in the PDS will be pulled into the workbook. If position level security has been applied to the user, a subset of the position will be pulled in.
-
Select the check boxes next to the hierarchy names to enable the hierarchies for which that the end user in the RPASCE Client should select positions.
-
Dimension: Select the desired dimension from each of the enabled hierarchies.
Note:
The dimension selected is the lowest dimension offered to the end-user in the scope selection wizard during the workbook build process. However, the workbook requires positions at the lowest dimension offered. Therefore, if the selected dimension is higher than the lowest dimension offered, the scope of the workbook includes all of the positions in that lowest dimension that are descended from the positions selected from that higher dimension.
-
Left Label and Right Label: (Optional) Enter the left and right labels for each hierarchy. These labels will be displayed on the left and right trees of the corresponding 2-tree wizards during the workbook build process. If these fields are left blank, no labels will be displayed over the hierarchy trees.
-
Restricted Dim and Max Positions: For applications such as pricing, a retailer might want to restrict the selection of SKUs in a planning workbook to only one category. A planner may be allowed to plan several categories within a department, but only one category per plan. Per the retailer's business process, a category would establish a coherent set of SKUs, the cross-item effects of which could be considered meaningful for a price optimization algorithm. Mixing in SKUs from two or more categories could be considered as polluting the cross-item effects, and therefore an undesirable situation. What may also be required for this application is the ability to select SKUs or Classes that comprise a subset of possible SKUs or Classes within the Category, but not the whole category.
With this latter requirement, a single-select wizard at the category level would not allow the user to filter subsets of SKUs or Classes. What is required is the ability to make multiple selections at the SKU or Class levels in a standard RPASCE Two Tree selection wizard, while still ensuring that only one Category is used. Even though this can be achieved through the disciplined selection of SKUs and Classes in a Two Tree Wizard, RPASCE allows for setting up a hard constraint so that the wizard itself can keep the user from selecting subsets in more than one Category by displaying an error message and preventing the user from proceeding to the next wizard page until the constraint has been satisfied.
The constraint can be easily established within the Standard Wizard definition window in the Workbook Definition tool of the Configuration Tools. Two new fields are available for every Two Tree selection page in the standard wizard, one where the user selects the level from the hierarchy (Restricted Dim field), and another where the user enters the maximum number of selectable positions from that level (Max Positions field). These fields are optional, and if left empty, there is no limit on the number of positions that may be selected using the wizard. These fields are also available for Two Tree pages used in custom wizards.
Another possible business application of this feature is to constrain the length of the planning period. A retailer may want the planners to never plan more than 12 weeks at a time, and it may not matter whether these weeks belong to the same quarter or not. In such a case, the retailer will want to establish the constraint of 12 at the week level, the lowest level where the selection is made. The planner may select at the quarter level, thus automatically selecting all the weeks in the Quarter; however, RPASCE will ensure that whatever the definition of the Quarter is, it does not contain more than 12 weeks.
Apart from the functional ability to restrict selections to coherent set of positions provided by the Max Positions feature, this feature also allows system designers to constrain the size of workbooks by limiting the maximum number of positions that a user can add to a workbook. In the past, users have been known to add all positions to a workbook because such a selection is easy to make. They may only require 5-10% of those positions, but they still add them all because they can easily work with the desired subset in the workbook. System designers would like to prevent such abuse of the flexibility that workbooks provide, primarily because such abuse leads to wastage of disk space and because it slows down online performance due to the extra work that RPASCE has to do with unnecessary positions. System designers may therefore constrain the workbook to, for example, not include more than 500 SKUs at a time. The number 500 may not have any functional meaning but may be chosen because it does not constrain functionality in any way while still helping to constrain the size of the workbooks.
Note:
This is a patchable feature, for example, existing configurations can be enhanced to benefit from this feature.
-
Wizard Label: To attach a custom label to a wizard page, enter the desired label in this field. If this field is left blank, the wizard page will be given the default label.
-
Order: Adjust the order of the hierarchies as necessary by dragging them in the order pane. This will be the order that the position selection wizards are presented during the workbook build process.
-
Click OK to save any changes and close the window.
Note:
If any of the offered hierarchies are not enabled in the Standard Wizard window, the end user will not be presented with a position selection wizard to define the scope of the workbook being built for that hierarchy. All positions in the lowest dimension offered in that hierarchy that the end user has access rights to will be automatically selected.
For a hierarchy in the workbook for which there is not a wizard, all the positions in the PDS will be pulled into the workbook. If position level security has been applied to the user, then a subset of the positions is pulled in.


Enable Image Modification
Select this option to allow users the ability to add, modify, or delete image paths for all image enabled dimensions in this workbook.
Note:
The commit rule group will receive additional rules when the Image Modification flag is selected for a workbook template. The load/refresh rule groups will receive additional rules if the workbook contains image enabled dimension levels, regardless of the Image Modification flag. If no refresh rule group is assigned to a workbook template, RPASCE will automatically create an internal rule group and assign that as the workbook's default refresh rule group.
Hierarchy Pre-Ranging
Hierarchy pre-ranging allows you to filter available positions for selection in two-tree wizards based on relationships established at a specific intersection between the positions of two or more hierarchies. For example, you can set pre-ranging up so that when users select the time period Fall 09 in the wizard, the subsequent SKU selection screen will only display Fall-specific products, such as sweaters and jackets.
Hierarchy pre-ranging can be enabled for both standard wizards and for two-tree wizards in custom wizards; however, in custom wizards the behavior is guaranteed only if two-tree wizards are used as is, that is, their code is not overridden by the implementation team.
Pre-ranging is achieved by setting up one or more Pre-range Mask measures for the workbook. Each hierarchy in the workbook template can be optionally assigned a pre-range mask measure. Each of the hierarchy-specific mask measures must contain a dimension that ties back to one or more hierarchies that display in the wizard, along with one or more dimensions along which we want to pre-select relevant positions. Multiple hierarchies can share a common mask measure. The masking function is applied in the order of the wizard pages such that the selections of a wizard page may affect the list of available positions on any subsequent wizard page, but the selections of wizard page do not affect the list of available positions on a previous page if you click Back to return.
This approach allows:
-
One or more hierarchies within the workbook template not to be ranged, reducing the processing time and storage space.
-
The mask measure only needs to contain the target hierarchy plus optional conditioning hierarchies at its base intersection, reducing the number of hierarchies per mask measure and thus storage space as well.
-
The same mask measure can be used to range a common set of hierarchies in different workbook templates.
Example:
In a workbook template that contains PROD, LOC, and CLND hierarchies,
two different mask measures are used: measure prodmaskloc (sku,str) to range down the positions that display in the LOC wizard,
and measure locmaskclnd (str,week) to range down
the positions that display in the CLND wizard. In the ConfigTools,
“PROD:,LOC:prodmaskloc,CLND:locmaskclnd are specified in the Pre-Range Mask field under the General tab
in the Workbook Designer tool.
Assuming the order of the wizard pages is PROD, LOC, and CLND, this is how the masks are applied:
-
All positions in the PROD hierarchy are available for selection as PROD is not masked.
-
Available positions for LOC hierarchy depend on the PROD hierarchy selections combining with the masking values of measure
prodmaskloc. -
Available positions for CLND hierarchy will solely depend on the LOC hierarchy selections combining with the masking values of measure
locmaskclnd. The PROD selections do not affect the CLND page directly.
The following sections describe additional components of Hierarchy pre-ranging:
Hierarchy Specific Pre-Range Mask Assignment
To assist in the configuration of the pre-range mask use the Figure 4-79 for the pre-range mask attribute. If you click in the field, the Figure 4-79 opens.
Figure 4-79 Set Pre-Range Mask Measures Window

Description of "Figure 4-79 Set Pre-Range Mask Measures Window"
The use of this tab is optional. It is used to create a workbook specific, customized menu-driven process within
The Figure 4-79 consists of a set of rows, one for each hierarchy in the application, each row lists the name of the hierarchy associated with the row and provide a field in which a measure name can be entered.
Finally, each row has a button that allows the selection of a measure as opposed to typing in a measure name. Click Select CLND mask, Select PROD mask, or Select LOC mask to open a Mask Measure Selection window. Figure 4-80 shows the Select CLND Mask Measure window.

A Figure 4-80 has a list of hierarchies, a list of measures and a text field to accept a partial measure name as a filter.
By default, the list of measures will contain all Boolean measures in the application that meet validation criteria for the hierarchy being configured. Typing text in the filter text field will filter the measure list to remove those measures that do not meet the pattern. Additionally, selecting a hierarchy in the hierarchy list will remove all measures that do not also contain the selected hierarchy or hierarchies within its base intersection.
These controls are designed to handle the values present in an upgraded version of the configuration in which the older and simpler format for pre-range masking is present.
Mask Measure's Type and Properties
All pre-range masking measures must be of Boolean measure type,
must have an aggregation method of or or and, and cannot be a scalar measure. Measure intersection can be
equal, higher than, or lower than the wizard intersection (intersection
constructed from the base dimensions of the wizards). The RPASCE server
uses normal non-conforming measure handling if the measure intersection
is different from the wizard intersection. In other words, an aggregation
is performed using the given agg type when the measure intersection
is lower than the wizard intersection. On the other hand, if it is
higher than the wizard intersection, then cells are mapped using the
replicate method (the measure spread type is ignored). A measure whose
intersection contains a mixture of dimensions higher than the wizard
intersection and lower than the wizard intersection (for example, sku_rgn_week for measure intersection versus sku_str_mnth for wizard intersection) cannot be used as a Pre-Range Mask measure.
Driving Hierarchies Based on the Mask Measure's Base Intersection
Any additional hierarchies in the mask measure's base intersection are automatically assumed as conditioning hierarchies. For example, if a measure that has PROD, LOC, and CLND is assigned to range LOC wizard, then PROD and CLND are assumed to be conditioning hierarchies, and the positions selected in these hierarchies will determine the position available in LOC wizard.
Evaluation of a Pre-Range Mask in the Wizard
The masking intersection for the mask measure during evaluation is based on ordering of the wizards. It will only gather intersection and positions information from previous wizards. For example, if the wizard ordering is CLND, LOC, PROD, then at the LOC wizard, even if the user navigated to PROD wizard and then went back to LOC wizard, the masking evaluation only considers the selections made in the CLND wizard. Other hierarchies in the mask measure at the time of evaluation are considered all selected (unfiltered).
Hierarchy Without the Wizard
A workbook template can omit a wizard for a hierarchy where all the positions in that hierarchy will be included in the workbook by default. A mask measure can still be assigned for such a hierarchy and the positions to be included in the workbook will be determined by the masking evaluation. This operation is performed at the end of wizard process.
Mask Measure Error
Since the mask measure is set for each hierarchy, in the case when measure properties were changed from the backend, any error during the execution, like incorrect measure type, intersection, or agg type, will only disable the ranging for that hierarchy. A warning message will be logged but the workbook build operation will continue. The hierarchy where the error occurs will become un-masked.
Backward Compatibility with Existing Workbook Templates
When RPASCE has been upgraded but the PDS has not yet been patched,
the field prerangemask in the template configuration
file (tmpl.cfg) is still using the old format with
only one single measure in it. The masking result is the same as before
the RPASCE upgrade. It is essentially equivalent to assigning the
single masking measure to all hierarchies in the workbook template.
No Available Position after Pre-Ranging
If there is no available position in a wizard during the workbook build process after masking evaluation, a CancelWizardException with an appropriate error message is thrown which can be displayed to the end user. The workbook building process ends.
DPM Like-Item Measure
RPASCE supports the use of one-dimensional string measures to store like-item information for newly added DPM positions. Such measures are called “DPM like-item measures" and must be configured in the workbook General Property tab. Once the like-item information, such as the like-item position names, is stored in the like-item measures, it can be used during workbook calculations or custom operations to populate other attribute measures.
Note:
Dynamic Position Maintenance is referred to as Placeholder Maintenance in the Oracle Retail Predictive Application Server Cloud Edition User Guide and several other documents. Both terms refer to the same functionality.
A DPM-like item measure must meet the following criteria:
-
It is a one-dimensional, string type measure.
-
Its base dimension cannot be a workbook-only dimension since such a dimension does not exist in the PDS and cannot have the like-item measure configured.
-
Its base dimension is one of the workbook's DPM-enabled dimensions.
-
It can be a workbook-only measure and is used to satisfy workbook calculation or custom menu operations. However, this measure must be part of the workbook and must be in the workbook rule set.
The DPM like-items are configured in the workbook General Property table. A window is displayed once the user presses either the mouse or the keyboard in this field. In this window, the user can select one like-item measure for each DPM-enabled hierarchy in the workbook. The DPM-enabled hierarchy in the workbook is determined by the configuration in the Dynamic Position Maintenance tab.
Example:
In a workbook template, DPM is enabled for the styl (PROD Hierarchy) and str (LOC Hierarchy) dimensions
in the Dynamic Position Maintenance tab. Two string measures, LikeItemMeasProd (styl) and LikeItemMeasLoc (str), are configured and added to the workbook
load rules.

In the ConfigTools, LOC:LikeItemMeasLoc, PROD:LikeItemMeasProd is specified in the DPM Like-Item Measuresfield under the
General tab in the Workbook Designer tool.
Hierarchy Specific DPM Like-Item Measure Assignment
In order to assist in the configuration of the DPM like-item measure, use the Figure 4-82. If you click in the DPM Like-Item Measures field, the Figure 4-82 opens.
Figure 4-82 Set DPM Like-Item Measures Window

Description of "Figure 4-82 Set DPM Like-Item Measures Window"
This Figure 4-82 consists of a set of rows, one for each DPM-enabled hierarchy in the workbook. Each row lists the name of the hierarchy associated with the row and provides a field in which a measure name can be entered. If the user enters an invalid measure name and clicks OK, the invalid measure displays as red text in the General Property table.
If an existing DPM like-item measure contains a reference to a hierarchy that does not exist in the current workbook, when you bring up the Figure 4-83, this hierarchy reference is hidden.
As shown in Figure 4-82, each row has a button that can be used to select a measure instead of typing in a measure name. Click the button next to the measure to open a Figure 4-83 for that measure. Figure 4-83 shows the Select PROD Like-Item Measure window.
Figure 4-83 DPM Like-Item Measure Selection Window

Description of "Figure 4-83 DPM Like-Item Measure Selection Window"
The Figure 4-83 contains the hierarchy name, a list of measures, and a text field to accept a partial measure name as a filter.
By default, the list of measures contains all one string measures in the application that meet the validation criteria for the hierarchy being configured. Typing text into the filter text field filters the measure list to remove those measures that do not meet the pattern.
Patch and Upgrade Considerations
If a PDS instance is patched with a template for which a new like-item-measure has been configured, then the old workbooks built with the pre-patch template will no longer work. These workbooks must be rebuilt. On the other hand, if the like-item-measure configuration is removed from a template, the like-item-measure is not updated in the old workbook and no exception is thrown.
Dim Attr Setup Date Measures
The Dim Attr Setup Date Measure stores the dates of the last attribute update for the workbook hierarchy that has the Attribute Hierarchy defined in the application. This workbook hierarchy is referred as “Attribute-enabled hierarchy" here.
A Dim Attr Setup Date measure must meet the following criteria:
-
It must exist in the application but is not required to be in the workbook rule set.
-
It must be of Date type with storage database.
-
It can be either one-dimensional or two-dimensional.
-
If it is a one-dimensional, the measure base dimension must be the Attribute Name dimension of the Attribute Hierarchy of the Workbook Hierarchy.
-
If it is a two-dimensional, the second base dimension of the measure must be from the workbook hierarchy that owns the attribute.
The Dim Attr Setup Date Measures are configured in the workbook General Property table. A window is displayed once the user presses either the mouse or the keyboard in this field. In this window, the user can select one dimension attribute setup date measure for each Attribute-enabled hierarchy in the workbook. The Attribute-enabled workbook hierarchy is determined by the configuration of the Attribute Hierarchy in the application Hierarchy Definition window.
Example:
Figure 4-84 shows an application and a workbook. In the application, the product hierarchy has the Attribute Hierarchy set to PATH, and PATN is the Attribute Name dimension of PATH. The workbook product hierarchy contains the dimensions DEPT and STYL. The workbook also contains LOC and CLND hierarchies, but they do not have the Attribute Hierarchy defined.
Users must configure the Dim Attr Setup Date measure for the workbook so that the workbook product dimension attributes are patchable. Application Measures having a base intersection of PATN, PATN/DEPT, or PATN/STYL are valid candidates. Application measures having a base intersection PATN/STR, PATN/WEEK, or PATN/DEPT/WEEK cannot be used as Dim Attr Setup Date measures in this example.
Figure 4-84 Dim Attr Setup Date Measures
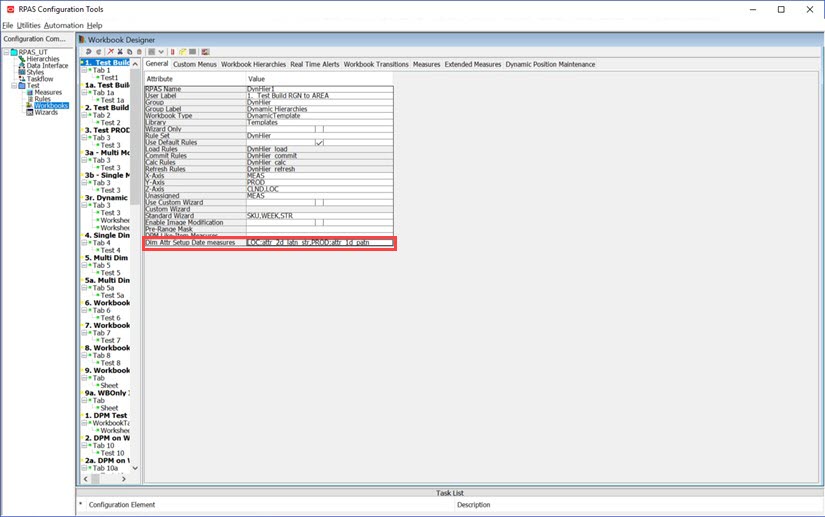
In Figure 4-84, LOC:loc_1d_latn, PROD:sku_2d_patn_sku is
specified in the Dim Attr Setup Date measures field under the
General tab in the Workbook Designer window.
Hierarchy Specific Dim Attr Setup Date Measure Assignment
In order to assist in the configuration of the Dim Attr Setup Date measures, use the Workbook Designer window. Click in the Dim Attr Setup Date measures field, to open the Figure 4-85.
Figure 4-85 Dimension Attribute Setup Date Measures Configuration Window

Description of "Figure 4-85 Dimension Attribute Setup Date Measures Configuration Window"
The Figure 4-85 consists of a set of rows, one for each Attribute-enabled hierarchy in the workbook. Each row lists the name of the hierarchy associated with the row and provides a field in which a measure name can be entered. If you enter an invalid measure name and click OK, the invalid measure displays in red text in the General Property table.
If an existing Dim Attr Setup Date measure contains a reference to a hierarchy that does not exist in the current workbook, when you open the Figure 4-85, this hierarchy reference is hidden.
Each row has a button that can select a measure instead of typing in a measure name. Click the button next to the measure to open the Figure 4-86 for that measure.
Figure 4-86 Dimension Attribute Setup Date Measure Selection Window

Description of "Figure 4-86 Dimension Attribute Setup Date Measure Selection Window"
The Figure 4-86 contains the hierarchy name, a list of measures, and a text field to accept a partial measure name as a filter.
By default, the list of measures contains all date measures in the application that meet the validation criteria for the hierarchy being configured. Typing text into the filter text field filters the measure list to remove those measures that do not meet the pattern.
Use Rolling Calendar
Some applications such as IPOCS-Demand Forecasting prefer that the workbook calendar range automatically advances relative to the workbook build date instead of using a static set of calendar positions. The Rolling Calendar functionality can help them to achieve this goal.
First, the workbook template must be configured to use rolling calendar. The Use Rolling Calendar property determines if Rolling Calendar is allowed for the workbook template. Select the check box to enable the Rolling Calendar Range Measures property. Clear the check box to disable the Rolling Calendar Range Measures property. See Rolling Calendar Range Measures for more information about Rolling Calendar.
Once the workbook template is configured with Rolling Calendar and the PDS build/patch is complete, users can then enable and select Rolling Calendar during the workbook wizard process. See the Oracle Retail Predictive Application Server Cloud Edition User Guide for details.
Rolling Calendar Range Measures
This field is only available when the Use Rolling Calendar check box is selected. This field allows you to select up to four rolling calendar range measures, which represent the time period threshold used within the Rolling Calendar wizard process. These time periods are the:
-
Maximum periods into the future (MaxF)
-
Minimum periods into the future (MinF)
-
Maximum periods into the past (MaxP)
-
Minimum periods into the past (MinP)
When no range measure is specified during the workbook template configuration, the RPASCE UI will default to 0 time periods in the case of MinF and MinP and the no-limit for MaxF and MaxP.
A qualified Rolling Calendar Range measure must meet the following criteria:
-
It must exist in the application but is not required to be in the workbook rule set.
-
It must be of Integer type with a valid storage database.
-
It must be a scalar measure.
The Rolling Calendar Range measures are configured in the Workbook General Property table. A window is displayed once the user selects this field using either the mouse or the keyboard. In this window, the user can select up to one range measure for each Maximum Future Periods (MaxF), Minimum Future Periods (MinF), Maximum Past Periods (MaxP), and Minimum Past Periods (MinP) in the workbook.
Note that the rolling calendar settings in the workbook template configuration are patchable for the PDS, but not for existing workbooks, since the rolling calendar wizard process is not patchable.
Example:
Figure 4-87 shows an application and a workbook. In the application, there are four scalar, integer type measures with valid storage databases with measure names scalar1, scalar2, scalar3, and scalar4, respectively.
Figure 4-87 Use Rolling Calendar and Rolling Calendar Range Measures

Description of "Figure 4-87 Use Rolling Calendar and Rolling Calendar Range Measures"
Setting the Rolling Calendar Range Measures Assignment
In order to configure the Rolling Calendar Range measures, use Figure 4-88. From the General Properties Table, when you click in the Rolling Calendar Range Measure field, the Figure 4-88 opens.
Figure 4-88 Set Rolling Calendar Range Measures Window

Description of "Figure 4-88 Set Rolling Calendar Range Measures Window"
The Figure 4-88 consists of four rows, one for each Time Periods category. Each row lists the name of qualified range measures in the application and provides a field in which to enter a measure name. If you enter an invalid measure name and click OK, the invalid measure shows a validation error in the Task List Panel.
Each row has a button that you can use to select a measure instead of typing in a measure name. Click the button next to the measure to open the Figure 4-89 for the selected measure.
Figure 4-89 Rolling Calendar Range Measure Selection Window

Description of "Figure 4-89 Rolling Calendar Range Measure Selection Window"
The Figure 4-89 contains the Time Periods Category name such as MaxF in the top window label, a list of measures, and a text field to accept a partial measure name as a filter.
By default, the list of measures contains all scalar, integer type measures in the application. Typing text into the filter text field filters the measure list to remove those measures that do not meet the pattern.
Note:
If the value of the maximum Rolling Calendar Range Measure is less than the corresponding minimum measure, for example, if MaxP is 8 while MinP is 5, or MaxF is 6 while MaxF is 8, RPASCE will not flag it as a user error; instead, RPASCE resets the maximum range measure to the maximum available value in the application during the wizard process.
Login User Only
Some applications, such as A&IP FSL, prefer that the workbook USER dimension only contains the login user so that when users define a measure with the base intersection containing the USER dimension for storing the user preferred values, only the login user, instead of all users, has the data committed when users commit the data from the workbook to the PDS. For example, store the user selection for product attribute rollups in the workbook. The Login User Only property can help users to achieve this goal. When this property is set to true, the workbook template, if not ranged by wizard explicitly, should only include the login user within its USER dimension.
The row Login User Only contains a check box. By default, this check box is not selected. The user must select this check box to indicate that the User dimension of this workbook will only contains the login user and no other user will be included.
Dynamic Dimension Label Override Measures
RPASCE supports the use of scalar, string measures to override the dimension labels for the dynamic dimensions defined within the Workbook Hierarchies tab. Such measures are called "Dynamic Dimension Label Override" measures and must be configured in the workbook General Property tab. The value of such scalar, string measures are calculated as part of the Custom Menu operation that invokes the RPASCE function dynHierRefresh, and the value of this override measure will be used as the dynamic dimension label afterwards.
A Dynamic Dimension Label Override measure must meet the following criteria:
-
It is a scalar, String type measure.
-
It can have a storage database or can be a workbook-only measure and is used to satisfy the custom menu operations. However, this measure must be part of the workbook and must be in the workbook rule set.
The Dynamic Dimension Label Override measures are configured in the workbook General Property table. A dialog box is displayed once the user clicks this field. In this dialog box, the user can select one label override measure for each dynamic dimension in the workbook. The dynamic dimension in the workbook is determined by the modified dim configuration in the Dynamic Hierarchies table within the Workbook Hierarchies tab. If the workbook does not contain any dynamic dimension, the warning message shown in Figure 4-90 is displayed when the field is clicked.
Figure 4-90 Warning Dialog Box Displayed When Workbook has no Dynamic Dimensions

Description of "Figure 4-90 Warning Dialog Box Displayed When Workbook has no Dynamic Dimensions"
Example
In a workbook template, the dynamic dimensions are WD41, WD11 and WD22. Three string measures, t_scalar2, status and t_scalar3, are configured and added to the workbook rules, as shown in Figure 4-91.
Figure 4-91 Dynamic Dimension Label Override Measure

Description of "Figure 4-91 Dynamic Dimension Label Override Measure"
General Properties Table of the Workbook Showing Dynamic Dimension Label Override
In the Dynamic Dim Label Override field under the General tab in the Workbook Designer tool, the measure t_salar2 is configured to contain the override label for dynamic dimension WD41, the measure status for dimension WD11, and the measure t_scalar3 for dimension WD22.
Dynamic Dimension Label Override Measure Assignment
In order to assist in the assignment of these measures, a dialog box has been created. If the user clicks in the field, the dialog box shown in Figure 4-92 is displayed.
Figure 4-92 Dynamic Dimension Label Override Measure Configuration Window

Description of "Figure 4-92 Dynamic Dimension Label Override Measure Configuration Window"
This dialog box consists of a set of rows, one for each dynamic dimension in the workbook. Each row lists the dynamic dimension and provides a field in which a measure name can be entered. If the user enters an invalid measure name and clicks OK, the invalid measure will be shown in red in the General Property table. Each row has a button that can be used to select a measure from a qualified candidate list instead of typing in a measure name. Clicking this button displays a secondary dialog box shown in Figure 4-93.
Figure 4-93 Dynamic Dimension Label Override Measure Selection Window

Description of "Figure 4-93 Dynamic Dimension Label Override Measure Selection Window"
This secondary dialog box contains the dynamic dimension name, a list of qualified measures, and a text field to accept a partial measure name as a filter.
By default, the list of measures contains all scalar, string measures in the workbook. Typing text into the filter text field filters the measure list to remove those measures that do not meet the pattern.
Patch and Upgrade Considerations
If a PDS instance is patched with a template for which a new dynamic dimension label override measure has been configured, then the old workbooks built with the pre-patch template will no longer work. These workbooks must be rebuilt. On the other hand, if the override-measure configuration is removed from a template, the dynamic dimension label override will not be updated in the old workbook and no exception will be thrown.
Sync DPM Positions to Virtual Dimension
Some applications, such as APCS, prefer to create the DPM positions for both original and virtual hierarchies in a single workbook template. The workbook property Sync DPM to Virtual Dimension, once configured to True, enables this. The DPM positions defined in the original dimension are automatically synchronized onto the corresponding virtual dimension at the end of each DPM process in a single workbook. It does not require rebuilding the workbook or building two workbooks.
The Sync DPM to Virtual Dim is configured in the workbook General Property table by selecting the check box. By default, this check box is not selected. Users must select the check box explicitly to set the property to True.
-
The workbook must have both the original and corresponding virtual dimensions.
-
The workbook must have the DPM dimensions configured.
-
DPM is enabled on the original dimension.
-
The original dimension must not have any dynamic hierarchy defined on itself or its parent dimension(s), except for the dynamic hierarchy definition for the Workbook Only dimensions.
For example, if the workbook has an LOC rollup relationship such as stor-regn-area, and stor-storecluster,
where storecluster is a dynamic hierarchy defined in the workbook.
Stor is the original dimension which has DPM enabled in the workbook.
Stor has a corresponding virtual dimension StorR and the workbook contains StorR dimension.
If the dynamic hierarchy Store Cluster has no virtual dimension in the workbook, then the Sync DPM To Virtual Dim property can be set.
If the dynamic hierarchy store cluster has a virtual dimension that is contained in the workbook, then this property cannot be set. Otherwise, the DPM process will fail.
-
The position set for the original dimension must be the same as for the virtual dimension. Usually, users configure a Pre-Range Mask in the workbook property table to guarantee the same set of positions are selected for both dimensions. If the Pre-Range Mask is used, the mask may need to be recomputed before the next workbook build
.Note:
Users must only select the Sync DPM to Virtual Dim check box after completing all the other configurations for this workbook, such as Worksheet, DPM, Workbook Hierarchy configuration, and so on.
Figure 4-94 Configure the Workbook Sync DPM to Virtual Dim Property

Custom Menus Tab
The use of this tab is optional. It is used to create a workbook specific, customized menu-driven process within the workbook where the defined menu options execute rule group transitions (which cause a series of calculations to be performed) and external scripts. Custom menus are typically used to define processes, such as an approval process.

Create a Custom Menu
Complete the following steps to Create a Custom Menu.
-
Select the Custom Menus tab.
-
In the Menu Label field, enter the name of the menu that will be displayed in the RPASCE Client. This menu option displays as a top-level menu option, between the Window and Help menu options.
-
Right-click in the table area and select Add.
-
Enter the following information:
-
Label: The label that displays in the menu in the RPASCE Client. These labels display beneath the top-level menu option named in the Menu Label property, in the order that they are displayed in this window.
Note:
Duplicate menu names are not allowed.
-
Function: This field defaults to RuleGroupProcessor and cannot be changed.
-
Arguments: The processes that are to be executed by the menu option are specified in the argument's property. There may be several processes specified in the order they are to be executed and separated by commas. There should be no gap after the comma between any two adjacent arguments, with each string assumed to be the name of a rule group.
When the end user selects the menu option in the RPASCE Client, RPASCE runs the processes from the argument's property in the specified sequence. RPASCE waits until each process has finished before executing the following process. After all the processes have been run, RPASCE runs a final transition using the full transition type back to the calc rule group for the workbook. This transition does not have to be explicitly specified in the argument's property.
Rule groups are executed with a full transition from the previous rule group, and the calculations apply to the whole scope of the workbook (that is, they use full (batch) mode rather than incremental mode). These terms are explained in Appendix – Calculation Engine User Guide. The rule group transitions ensure that the integrity of all rules is enforced in the new rule group.
-
Condition Measure: This field is used to specify a scalar, Boolean condition measure in the workbook that will be checked by the custom menu to decide whether it must execute or not.
For a measure to be a candidate for the condition measure of a custom menu item, the measure must meet the following criteria:
- In the workbook. The measure must exist within the rule groups for the workbook.
- Scalar
- Boolean
In the workbook. The measure must exist within the rule groups for the workbook.
If the value of the measure is True, the custom menu runs, but if the value is False, the menu does not execute and displays a message relating that the custom menu could not execute because the conditions were not met. (For more information on how this message can be customized, see the Message Measure bullet.)
If the condition measure is not specified, meaning the field is empty, the custom menu always runs. Table 4-1 specifies the behavior of custom menu execution and the display of custom messages based on whether a measure name has been entered (available) in the field and whether the measure's value has been set (True in case of the condition measure and a non-zero length string in case of the message measure).
Table 4-1 Behavior of the Custom Menu
Condition Measure Return Message Measure Behavior Available & Set
Available & Set
The Custom Menu runs and displays the Custom Menu Response pop-up containing the value of the Return Message measure.
Available but Not Set
The Custom Menu runs and displays the default message.
Not Available
The Custom Menu runs and displays the default message.
Available but Not Set
Available & Set
The Custom menu does not execute but does display the Custom Menu Response pop-up containing the value of the Return Message measure.
Available but Not Set
The Custom Menu does not execute and displays a Warning pop-up message reading Conditions for executing the Custom Menu have not been met!.
Not Available
The Custom Menu does not execute and displays a Warning pop-up message reading Conditions for executing the Custom Menu have not been met!.
Not Available
Available & Set
The Custom menu runs and displays the Custom Menu Response pop-up containing the value of the Return Message measure.
Available but Not Set
The Custom menu runs and displays the Custom Menu Response pop-up containing the value of the Return Message measure.
Not Available
Custom Menu runs and displays the default message.
-
Message Measure: This field is used to specify the scalar, String measure, the value of which displays by the custom menu in a window upon the menu's successful or failed execution. If the field is empty, RPASCE displays the default message that it historically displays. If a measure is specified, but the value is empty, RPASCE again displays the default message. If the value is a non-zero length string, then the value displays.
For a measure to be a candidate for the return message measure of a custom menu item, the measure must meet the following criteria:
- In the workbook. The measure must exist within the rule groups for the workbook.
- Scalar
- String
To effectively use this feature, it is important to understand the execution of a custom menu. When you select a custom menu from the menu, RPASCE first checks if there is a condition measure available for controlling the execution. If there is none, it continues to run the rule groups or scripts in the argument of the custom menu. If a condition measure is available, RPASCE checks the value of the measure for controlling the execution of the custom menu. If the value is false, it checks the availability of the return message measure. If the message measure is unavailable, RPASCE displays a default message informing the user that menu could not be executed because the conditions were not met. However, if the measure is available, RPASCE examines its value. If the value is empty, it defaults to the same behavior as when the message measure was not available. If the value is not empty, it displays the custom message.
If the custom menu can execute, either because the condition measure is unavailable or because it is set to true at the time the custom menu is invoked, RPASCE runs the rule groups in the argument of the custom menu specification. RPASCE will then look for the value of the message measure, and if the value is empty, it informs the user that the menu was successfully executed using the default message. If the value is not empty, it displays the value of the message measure. It then transitions to the Calc rule group and completes execution.
-
Commit ASAP: It is possible to include commit rule groups (rule groups that include commit rules) in the list of rule groups that forms the arguments of a custom menu item. Normally, these commit rule groups execute synchronously, meaning that after submitting a commit request, the user must wait until the commit process ends. It is also possible to mark a custom menu item as Commit ASAP.
When marked as Commit ASAP, a custom menu item runs the commit rule group asynchronously, returning the control to the user immediately. The commit ASAP process creates a temporary copy of the workbook and places a commit request in a queue. The commit rule group is executed as soon as the measure databases become available.
In this manner, it is possible to commit certain measures within the workbook without halting work on the workbook until the commit has been processed and without having to deal with contention issues associated with immediate commits.
Note:
When a custom menu item is marked as Commit ASAP, that menu item may only have a single commit rule group in its list of arguments. Furthermore, it is recommended that the commit rule group be the last rule group in the custom menu item's list of arguments, as any subsequent rule groups that execute will not affect the values committed and any side effects of the commit rule group execution will not apply to the workbook.
Note:
The commit button in the Fusion UI always commits ASAP. This is independent of how the commit works in a custom menu.
-
Intraday Concurrent: This field is used to flag the custom menu as one that can run concurrently with any intraday process running on the application. The default setting is false which means that the custom menu will not run when an intraday process is running. See the Oracle Retail Predictive Application Server Cloud Edition Administration Guide for more details on intraday processes.
A custom menu that is configured to run intraday concurrent should be something that only accesses workbook data and/or runs commits via the commit ASAP functionality. Custom menus that update or read directly from the PDS should not be configured as intraday concurrent as this would conflict with the ride process.
-
Is Success Measure: This field is used to specify a scalar, Boolean measure that exists within the rule groups of the workbook. User can select such a measure from the candidate measure list or leave it empty. This measure's value is set during the custom menu rule group execution and indicates whether or not the custom menu execution is successful. The rule groups defined for the custom menu action need include rules that populate the Is Success while processing the action.
When a user initiates a custom action, the system performs that action through the execution of one or more rule groups defined in configuration for the workbook in which they are performing the task. This operation can require significant amount of time but cannot be performed asynchronously, as all data in the workspace could potentially be modified in the operation. Once the operation is complete, the user receives a notification that reports the completion of the custom action. Using Is Success Measure and the Is Success Message Measure (explained next), an action-specific response message can be used to alert the user whether the action completed successfully or whether it encountered problems and was not able to execute.
Depending on the Boolean value contained within the Is Success measure, the RPASCE client displays the Custom Menu execution response message accordingly. If the Is Success Measure is not set by users, then the RPASCE UI displays the default message. For details, see Figure 4-97.
-

Note:
wWhen configuring the Condition Measure, Message Measure, Is Success Measure or Is Success Message Measure for the Custom Menu, the candidate measures are listed in alphabetic order in the Select Measure dialog box. The sorting is case-insensitive.Summary of Custom Menu Response Notification
The following figure summarizes the flow when either a generic message or customized message is displayed for custom menu execution.
Figure 4-97 Custom Menu Response Notification Diagram

Description of "Figure 4-97 Custom Menu Response Notification Diagram"
Workbook Hierarchies Tab
This tab is optional. Use this tab to configure hierarchical relationships whose parent-child relationships are not defined in the Hierarchy Definition Window or the loadHier process, but are data driven.
Note:
Virtual hierarchies and virtual dimensions cannot be modified inside the Workbook Hierarchies tab.
For instance, you can:
Hide individual dimensions or whole branches of a hierarchy by excluding them from the dimensions that are available to the workbook. (For more information, see Remove Dimension.)
Create mappings between dimensions that are not directly related in the hierarchy structures. (For more information, see Change Rollup.)
Create dynamic hierarchical relationships that are built using measure data during the workbook build process, and may vary each time a workbook is built, but the relationships within a workbook are constant. (For instructions on creating dynamic hierarchies, see Make Rollup Dynamic, Add Workbook Dimension, and Insert Workbook Dimension. For in-depth examples, see the Appendix – Dynamic Hierarchies.)

Any hierarchies that do not have dimension relationships specified will use the full hierarchy specified in the Hierarchy Definition Window, with the lowest dimension in that hierarchy used as the base intersection of a measure used in the rule set for the workbook as its root.
Dimension relationships are specified as hyphenated child-parent pairs. In these pairs, the child is listed first (for example scls-clss). More than one child-parent pairs are separated by commas, as shown in Figure 4-99.
Note:
The hierarchy fields in the Hier Mods section are read-only. The child-parent pairs displayed cannot be edited there.
Every parent-child relationship in the workbook must be explicitly specified. Only dimensions that have been defined in The Hierarchy Definition Window can be used and must be specified by name. The Configuration Tools validates the dimension relationships to ensure that valid dimension names are used. It prohibits the use of the same dimension name in both the child and the parent dimensions. In addition, the Configuration Tools prohibits pairs where the child's Aggs attribute is the same as the parent's attibute. For example, Clss-Scls is not allowed, but Scls-Clss is.
Modify a Hierarchy in a Workbook
To modify a hierarchy in a workbook, complete the following steps:
-
Click the Workbook Hierarchies tab. In this tab you can see all hierarchies used in the base intersection of measures used in the rule set in the workbook.
-
Right-click a hierarchy or dimension and choose one of the following options:
Important Note About Using Hier Mods Options
The use of mappings that are non-structural should be carefully managed to ensure they are only used where the non-structural mapping work. For example, consider a product hierarchy where a subclass may be supplied by multiple vendors (with a style always supplied by a single vendor), but in some parts of the business, subclasses are only supplied by a single vendor.
Example:
Figure 4-100 shows an example of a product hierarchy that includes a branch for vendor analysis is:
Sku-Style-Subclass-Class-Department-Division-Company
With a branch of:
Subclass-VendorClass-VendorDept-VendorDiv-Vendor-Total

If you want a workbook that includes measures with a lowest base intersection of subclass that required the vendor branch but not the division dimension, you could specify the Hier Mods as follows:
scls-clss, clss-dept, dept-comp, scls-vcls, vcls-vdep, vdep-vend, vend-tot
The workbook would contain the subclass, class, department, and company dimensions, as well as a branch that contains the VendorClass, VendorDept, Vendor, and Total dimensions.

In Figure 4-101, if this workbook is accessed by a user in a part of the business where a subclass only includes styles from a single vendor, the hierarchy built in the workbook will work correctly. However, if it is used in a part of the business where a subclass includes styles with multiple vendors, RPASCE determines (by looking at the VendorClasses that the SKUs in the subclass belong to) that the scls-vcls relationship is ambiguous because the subclass should belong to multiple VendorClasses. In these circumstances, RPASCE builds the hierarchy using one of the valid scls-vcls relationships. As far as the end-user is concerned, the choice of VendorClass for the subclass is likely to be seen as arbitrary, and (in any case) the vendor branch is of little or no practical value in this case.
Remove Dimension
This option allows you to remove existing dimensions from a specific workbook. For instance, if you have an application that has a product hierarchy with the following dimensions:
subclass > class > department > division > company
You want a specific workbook to stop at the department dimension and not include the division and company dimensions. You can make that workbook's product hierarchy end at department by completing the following steps:
Note:
You cannot remove the lowest child-parent relationship (the last two dimensions) of a hierarchy.
-
Select the workbook in the Workbook Designer window.
Figure 4-102 Workbook List in Workbook Designer

Description of "Figure 4-102 Workbook List in Workbook Designer" -
Navigate to the Workbook Hierarchies tab. The available hierarchies in the workbook are displayed.
Figure 4-103 Displayed Hierarchies and Dimensions in the Workbook Hierarchies Tab

Description of "Figure 4-103 Displayed Hierarchies and Dimensions in the Workbook Hierarchies Tab" -
Right-click the dimension you want to remove. From the right-click menu, select Remove Dimension.
The dimension no longer displays and the hierarchy name becomes italicized to show that the hierarchy has been modified.
-
Repeat Step 3 for other dimensions if desired.
To bring back a removed dimension, use the Restore Dimension option described in the next section.


Restore Dimension
To restore a removed dimension, complete the following steps:
-
Right-click the hierarchy or any dimension within the hierarchy of the removed dimension.
-
In the right-click menu, click Restore Dimension.
-
The Figure 4-107 opens. From the list, select the dimension you want to restore. Click OK.
The Figure 4-107 closes. In the Workbook Hierarchies pane, the dimension higher than the restored dimension has an expand icon next to it. Click the icon to see the restored dimension.


In general, when a new alternate dimension is added into a hierarchy at the application definition window, and the workbook does not have hier mods or dynamic hiers defined on this hierarchy, this new dimension automatically shows up in the workbook's hierarchy tree when the user clicks the Workbook Hierarchies tab.
However, if the workbook does have this hierarchy modified, this new dimension is not automatically added since the workbook hierarchy is different. The user must explicitly use the Restore Dimension operation to bring this new level into the workbook hierarchy tree. In addition, DPM can be enabled on the new dimension since the workbook hierarchy has the same topology as in the PDS.
However, things get complicated when the workbook's all measure base intersection is below all worksheets’ base intersection. For example, in a workbook, the workbook's worksheet base dimension of PROD is on SKUP while the measures' base dimension is lower, at SKU.
If the user adds a new dim D12 above SKUP in the application with the rollup relationship as CLSS->D12: The user can use Restore Dimension to add D12 into the workbook.The D12 dim will show up in the PROD tree and hier mods of the wb Hiers.
If the user adds a new level just above SKU, such as SKU->D72: Since D72 is not the same as SKUP or above SKUP, D72 cannot be brought into the workbook hierarchy tree using Restore Dimension. However, since the sub-branch of SKU->SKUP->SKG is a full sub-branch of PROD, DPM can still be enabled for SKU, SKUP, and SKUG dimensions in this workbook.
Change Rollup
You can make a dimension rollup to a different dimension by using the Change Rollup feature. For instance, if you want the company dimension to roll up from subclass rather than division, complete the following steps:
Right-click the dimension you want to change.
In the right-click menu, click Change Rollup.

The Figure 4-110 opens. Select the dimension that you want the original dimension to roll up from. (Only dimensions lower than the original are available.) Click OK.

The Figure 4-110 closes. In the Workbook Hierarchies pane, the dimension now rolls up from the new dimension.

Make Rollup Dynamic
Use this option to create a dynamic hierarchy entry for a dimension. Dynamic hierarchical relationships are built using measure data during the workbook build process and may vary each time a workbook is built, but the hierarchical relationships within the workbook remain constant. Dynamic hierarchies can be based on two or more other hierarchies.
For example, the cluster dimension may be an alternate parent of the store dimension in the location hierarchy, and the cluster that a store belongs to may vary by the class dimension in the product hierarchy. In one workbook, a clustering process may determine the store-cluster relationships for each class, and store that information in a measure. A second workbook could then use that relationship to build a dynamic hierarchy. In this example, if the rollup of store to cluster is different for each class, and the user brings more than one class into the workbook, the rollup of store to cluster used in the workbook is based on the data from the first class in the hierarchy.
The dynamic hierarchy process cannot invent a new dimension; it can only change the parent-child relationships of the existing dimensions. In the example, the cluster dimension must be a normal dimension defined through the Hierarchy Definition window and maintained through the loadHier or user-defined dimension processes. The dimension is normal, so it may be used in the base intersection of measures.
Important Dynamic Hierarchy Notes
If the branch of a hierarchy that has parent-child relationships defined by the dynamic hierarchy process only has a business meaning when the dynamic hierarchy process is used, you must use the Remove Dimension option to remove the dimensions in other workbook templates. For example, in the previous cluster example, if the store-cluster relationship only exists in the context of a class, use the Remove Dimension option to hide that relationship in a workbook template that does not include the product hierarchy.
It is your responsibility to ensure that the position names contained in the measure that drives the dynamic hierarchy are real positions that exist in the parent dimension. If not, positions with those names are present in the workbook, but data for them cannot be committed to the PDS, and it is lost when the workbook is deleted.
The resulting dynamic hierarchy is created at the end of the wizard selection process and before the actual workbook build. Therefore, the end product is only visible inside the workbook and not in the wizards.
Note:
For in-depth examples and explanations about dynamic hierarchies, see Appendix – Dynamic Hierarchies.
Make a Rollup Dynamic
To make a rollup dynamic, complete the following steps:
-
Select the dimension you want to change.
-
In the right-click menu, click Make Rollup Dynamic.
The selected dimension is now italicized, and a dynamic hierarchy displays in the Dynamic Hierarchy pane. The dimension you selected in Step 1 is populated in the
modifieddimattribute. -
In the Dynamic Hierarchy pane, set the following properties:
-
name – The name of the dynamic hierarchy. Duplicate names are not allowed. This is an internal name used as a handle to the dynamic hierarchy. It is not visible to the end user.
-
label – The label of the dynamic hierarchy entry that represents the workbook-only dimensions that can be configured with an external label. This external label is displayed within the RPASCE Client in place of the dimension name. Only dynamic hierarchy entries that represent workbook-only dimensions have editable label properties.
-
measure – This is the name of the measure that holds the name of the parent position. Click Select Measure to see the list of the sorted measures that are used in the solution. Type the first few characters of the measure name in the box at the top of the list to go to the required measure or scroll to find it. Double-click to select the desired measure. The measure's base intersection must contain the dimension that is the child of the child-parent relationship (dvsn in the example) or is lower than it (dept, clss and scls in the example) and one or more dimensions which the dynamic position assignment is dependent on (such as comp). The content of the measure is the name of the parent position in the relationship (in the example, this would be the name of the comp that the dvsn belongs to for this comp). This measure may or may not be included in the workbook. If the measure is included in the workbook, changes to the measure within the workbook do not change the parent-child relationships within the workbook, which are static after the workbook is built.
-
label measure – This is the name of the measure that holds the label of the parent position. The process to select the label measure is the same as the process to select the measure. The base intersection of the label measure must be the same as the measure. The content of the label measure is the label of the parent position in the relationship.
Note:
If a given parent position name has different labels specified for different child positions, the label for the parent position used in the built workbook is one of the different labels, which are arbitrarily selected.
-
dim – This is the name of the dimension that is the child in the parent-child relationship. It is the dimension in the modified hierarchy that is used to resolve the modified roll-up relationship represented by the dynamic hier entry. It is stored within the measure and the label measure. The hierarchy that the dynamic hierarchy belongs to is derived from this property.
Note:
A dimension that is the modified dimension of one dynamic hierarchy entry cannot be used as the dim attribute of another dynamic hierarchy.
-
modified dim – This is the name of the dimension that is the parent in the parent-child relationship. It is the dimension within the modified hierarchy whose roll-up behavior is being modified by the dynamic hierarchy entry. Note that, for dynamic hier entries that represent workbook-only dimensions, the modified dim attribute is the name of the dynamic hier entry and the name of the workbook only dimension that this entry represents.
-


If you want to remove this new hierarchy, use the instructions described in Remove Dynamic Rollup.
Remove Dynamic Rollup
If you have added a dynamic rollup with the Make Rollup Dynamic option, you can remove it with the Figure 4-114.
To remove a dynamic rollup, complete the following steps:
-
Right-click the dimension with the dynamic rollup. The dimension's name is in italics.
-
In the right-click menu, select Remove Dynamic Rollup.
The dynamic rollup is removed from the Dynamic Hierarchies pane and the dimension name is no longer in italics.


Add Workbook Dimension
Use this option to add a workbook-only dimension to the workbook. Workbook-only dimensions are driven by measures just like regular dynamic dimensions. The difference is that workbook-only dimensions exist only in the workbook and never in the PDS. They can also be used to support a dynamic number of roll-ups and levels. If the workbook dimension does not have data in the measures, it is not displayed as a dimension in the workbook.
To add a workbook dimension, complete the following steps:
-
Right-click the dimension that you to add a higher dimension to.
-
In the right-click menu, click Add Workbook Dimension.
Figure 4-116 Add Workbook Dimension Option

Description of "Figure 4-116 Add Workbook Dimension Option"The new workbook dimension displays underneath the selected dimension as well as in the Dynamic Hierarchies table.

To continue editing the workbook dimension hierarchy, see the instructions in Make Rollup Dynamic. To remove it, see the Remove Dimension.
Insert Workbook Dimension
Use this option to insert a workbook-only dimension between existing dimensions in the workbook. Workbook-only dimensions are driven by measures just like regular dynamic dimensions. The difference is that workbook-only dimensions exist only in the workbook and never in the PDS. They can also be used to support a dynamic number of roll-ups and levels. If the workbook dimension does not have data in the measures, it is not displayed as a dimension in the workbook.
To insert a workbook dimension, complete the following steps:
-
Right-click the dimension where you want to insert a lower dimension.
-
In the right-click menu, click Insert Workbook Dimension.
Figure 4-118 Insert Workbook Dimension Option

Description of "Figure 4-118 Insert Workbook Dimension Option"The new dimension displays higher than the selected dimension as well as in the Dynamic Hierarchies table.

To continue editing the workbook dimension hierarchy, see the instructions in Make Rollup Dynamic. To remove it, see Remove Dimension.
Real Time Alerts Tab
The use of this tab is optional. It allows you to create real time alerts within a workbook that update dynamically. Real time alerts will re-evaluate every time the measures upon which they depend are modified. Real Time Alerts are not two-state (either a hit or not a hit); any number of discrete conditions can be defined for a Real Time Alert. When the alert is evaluated, whichever condition applies will be used (for example, a Real Time Alert defined on an inventory measure could define one condition for low stock and a more severe condition for no stock). The RPASCE Client provides the following support for real time alerts:
-
A Real Time Alert can be set as the active alert. When an alert is active within the RPASCE Client, users can navigate between hits for that alert.
-
A Real Time Alert can define one or more styles for a Real Time Alert. Every cell of the target measure which evaluates as an alert hit for the Real Time Alert will use the alert's style for that cell in place of the measure's default style. As Real Time Alerts evaluate, the cell styles will update to reflect changes in which cells are hits and which are not.
-
One or more messages can be defined for a Real Time Alert. These messages will be displayed in the info pop-up for the current active alert.
-
The layout and view positioning used in RPASCE Alert Navigation mode can be defined for Real Time Alerts. If not defined, the RPASCE client will use the default layout based on the number of Alert Worksheets configured, and the Primary view used for navigation is always the one in the first position.
The default layout for the number of selected alert worksheets is as follows:
Table 4-2 Default Layout for the Number of Selected Alert Worksheets
| Number of Worksheets | Default Layout |
|---|---|
|
1 |
Full View |
|
2 |
2 Horizontal |
|
3 |
1X2 Horizontal |
|
4 |
4 Tiled |
The Real Time Alert configuration specifies which layout is to be used in Navigation Mode and which of the Alert Worksheets listed is the primary one.
The number of selected Alert Worksheets determines which layouts are available for selection.
Table 4-3 Layouts for the Number of Alert Worksheets
| Number of Alert Worksheets | Layout Label |
|---|---|
|
1 |
Full View |
|
2 |
2 Vertical 2 Horizontal 7:3 Vertical 3:7 Vertical |
|
3 |
1x2 Vertical 2x1 Vertical 1x2 Horizontal 2x1 Horizontal 2x1 Horizontal (7:3) 2x1 Horizontal (3:7) 1x2 Horizontal (7:3) 1x2 Horizontal (3:7) |
|
4 |
4 Tiled |

Condition Definition Interface
The Condition table allows users to create, remove and modify the conditions that are used in alerts for the current workbook. This table contains columns to allow the specification of the following properties:
-
Condition Name – The name is the value populated within the alert measure to identify which condition, if any, has been triggered for a given cell in the target measure. The condition name will also be used to create a key to allow translation of condition messages.
-
Condition Label – The label is the externalized label used to represent a condition to users of the client. This label is used to identify the condition within the client. The condition label is internationalized so that it can be translated using the RPASCE multi-language functionality.
-
Condition Style – The style is the name of a style configured within the Style Definition tool that describes the formatting that should be applied to those cells which are evaluated as hits for the condition.
-
Condition Message – The message is the text message that is supplied to describe the condition that has been triggered when the workbook alert evaluates a ‘hit' on a given cell of the base measure. This message is internationalized so that it can be translated using the RPASCE multi-language functionality.

Alert Definition Interface
The Alert table allows users to create, remove and modify workbook alerts used within the selected workbook. Selecting the row corresponding to an alert will cause the alert conditions of that alert (if it has any defined) to be populated within the condition table. The alert table contains columns to allow the specification of the following properties:
Note:
If you define two or more alerts with the same alert measure and target measure, you will only be able to see the alert formatting for one of them.
-
Alert Name – The name is used as an internal key by RPASCE.
-
Alert Label – The label is an external identifier that is used to represent the alert to users of RPASCE.
-
Target Measure – The target measure is the measure over which alert hits will be evaluated and to which the formatting will be applied. Boolean measures cannot be used as target measures for real time alerts. Target measure must be defined within the Viewable Measure Profiles of the workbook. When the user clicks the Target Measure field within the Alert Table, a Figure 4-122 opens that is pre-populated with measures from the workbook viewable measure profiles.
-
Alert Measure – The alert measure is a String measure that is used in the alert evaluation process. It is this measure that will hold the information about what cells in the target measure are considered hits and which condition a given cell has triggered. The intersection of the alert measure must be identical to the alert intersection property of the workbook alert. The alert measure must be included in the workbook rule groups, usually in the calc rule group. The alert measure can be either a hidden measure or in the workbook viewable measure profile. When the user clicks the Alert Measure field within the Alert Table, a Select Measure dialog box pops up that is pre-populated with qualified measures from this workbook. The qualified measures have following characteristics:
-
String type.
-
Measure base intersection is the same as the alert intersection.
-
The measure is used within the workbook rule groups.
-
The measure defagg type is either ambig or popcount. The measure defspread type is none.
The alert measure with defagg at popcount is used to show alert formatting on rollup cells, along with a badge of the count of alert hits at the alert intersection. This is done by using a popcount aggregated Alert Measure value at the rollup intersection to format the Target Measure cell at the same intersection. See the "Creation of Alert Badge at Rollup Intersection" section below for details on how to use the popcount alert measure to configure alert badge.
-
-
Alert Intersection – The alert intersection is the intersection on which the workbook alert is defined. It is possible to define multiple workbook alerts over a single target measure, each at a different intersection. Because an alert can only register hits at the intersection of the alert measure, it may be desirable to create multiple alerts for a single target measure so that users can evaluate the target measure at different intersections within the client.
-
Alert Conditions – The alert conditions field contains the list of conditions (of the full set of defined conditions for a workbook) that are associated with a given workbook alert. This list is used to identify which conditions should be grouped with an alert when a workbook is registered or built.
-
Alert Priority – The alert priority is validated to be unique for the same target measure. The alert priority controls which real time alert formatting is shown in RPASCE Client if multiple alerts are triggered on the same measure. When more than one alert has been created for a single target measure, some cells of the target measure may trigger alert hits for more than one alert. When this is the case, the alert with the lower priority is applied to that cell of the target measure.
The alert priority also controls the order that real time alerts are displayed in the Alert Navigation drop-down list in the RPASCE Client. The alerts are displayed in the ascending order of the alert priority, with the lower priority (that is, lower number) at the top of the drop-down list.
-
Alert Worksheets - The alert worksheets field contains the name of one or more worksheets contained within the alert step that should be displayed when the user enters alert navigation mode for this alert in the RPASCE Client. Between one and four worksheets may be selected and ordered within the view layout. The first worksheet will be the primary view for purposes of alert navigation if Primary Worksheet is not specified in the other column.
Figure 4-123 Select Alert Worksheets Window

Description of "Figure 4-123 Select Alert Worksheets Window" -
Alert Layout - The alert layout field contains the layout that RPASCE utilizes in the alert navigation mode for this alert. If not specified, the default layout type will be used in RPASCE, as described in the prior section. In the Select One Layout Type window, the drop-down list contains the labels of the available Alert Layouts that are appropriate for the number of selected alert worksheets.
Figure 4-124 Select One Layout Type Window

Description of "Figure 4-124 Select One Layout Type Window" -
Primary Worksheet - The primary worksheet specifies which of the selected alert worksheets is the primary one. If not specified, the first worksheet in the Alert Worksheets field will be used as the primary one. The drop-down list in the Select Alert Primary Worksheet window contains the names of the selected alert worksheet. The Primary Worksheet must contain the Target Measure.
Figure 4-125 Select Alert Primary Worksheet Window

Description of "Figure 4-125 Select Alert Primary Worksheet Window" -
Alert Step - The alert step field contains the name of the step which the RPASCE Client should move to when entering alert navigation mode for this alert. If more than one task makes use of this workbook, an alert step must be selected for each task. In the Figure 4-126, the drop-down list contains the labels of the available Alert Steps.
Once the Alert Steps are selected, their names are displayed in the Alert Step field, prefixed with identification keyword “####".
Note:
In older versions of RPAS, the Alert Step field displays the labels of selected Alert Steps. This is still supported in the current version. PDS patching does not require re-selecting Alert Steps for existing real time alerts. Since only newly selected Alert Steps have their names displayed, it is possible that the Alert Step column in one workbook may contain both names and labels for different real time alerts.
Figure 4-127 Real Time Alert Definition Table

Description of "Figure 4-127 Real Time Alert Definition Table"


Note:
The candidate measures displayed in the Select Measure window for either Target Measure or Alert Measure are sorted in alphabetic order, regardless of case.Operations within the Real Time Alerts Panel
The Real Time Alerts panel supports the following operations through the right-click menu:

Add Alert
Selecting the Add Alert action will create a new Real Time Alert and allow specification of properties within the Alert Table.
Remove Alert
Selecting the Remove Alert action will remove the currently selected alert and its conditions from the workbook. If no alert is currently selected, this option will be unavailable.
Add Condition
Selecting the Add Condition action will create a new Alert Condition within the currently selected real time alert and allow specification of properties within the Condition Table. If there is no currently selected Real Time Alert, this option will be unavailable.
Remove Condition
Selecting the Remove Condition action will remove the currently selected condition from the alert. If no condition is currently selected, this option will be unavailable.
Copy Condition
Selecting the Copy Condition action will allow users to copy an alert condition defined in another real time alert so that it can be used in the currently selected real time alert. When using the Copy Condition action, users must specify solution (for multi-solution configurations), workbook and source alert from which the condition will be copied. The user can then select the condition to be copied to the currently selected alert. If there is no currently selected Real Time Alert, this option will be unavailable.

Example of Workbook Configuration
The process of configuring a workbook alert requires multiple steps across several functional areas within the Configuration Tools. For this reason, an example provides details regarding the end-to-end process of the workbook alert configuration. For more information on Real Time Alert, refer to the Real Time Alerts chapter in Oracle Retail Predictive Application Server Cloud Edition User Guide.
For purposes of this example, assume the existence of an inventory measure. The desire is to create an alert to warn of low stock. Assume further that the process defines two conditions that would be considered as a low stock situation: first, if the inventory count falls below a projected sales figure for the period, and, second, if the inventory count falls below some static threshold. For our purposes, we will assume that the failure to meet projected sales is considered more important than falling below the static threshold.
Given these assumptions assume that the following three measures already exist in the application and have processes in place to be calculated or seeded:
-
InvU - base inventory count
-
ProjSls - projected sales
-
MinThrsh - low stock threshold
Assume also that the workbook in which the alert will be defined is already configured to contain all three of the above measure and that processes exist to load and/or calculate the values of the three measures. Given these inputs, the following steps illustrate the configuration of a workbook alert to evaluate low stock conditions.
Definition of the Condition Styles
Within the Style Definition tools, styles must be configured to represent the formatting to be applied for each condition within the alert. Given that we have defined two distinct conditions, it would be desirable to define two distinct styles so that it is possible to visually distinguish which condition is triggered for any given alert hit. Note that it is not necessary to create new styles for each condition; styles may be reused between conditions and may be used both for static formatting of measures and for alert hits.
For our example, we will assume that the following new styles are created.
Warning: Text color yellow, Font type: bold
Error: Text color red, Font type: bold
For more information on style configuration, see the section "Styles" earlier in this document.
Definition of Alert Measures
Within the Measure Definition tool, an alert measure must be defined for the Workbook alert. This measure must be a String-type measure and its base intersection should be identical to the intersection at which the alert is going to be evaluated. In addition, the naValue of the alert measure should always be the empty string, the aggregation type of the alert measure should be either ambig or popcount and the spread type of the alert measure should be none.
The following measure will be created within the Measure Definition tool:
LowStkAlrt - type: String, naValue: ""
Note that the new measure can be configured as by identical processes to normal measure configuration. For more information, see the section "Measures and Components" earlier in this document.
Creation of Alert Calculation Rule
Within the Rule Definition tool, a rule must be defined to evaluate the alert measure. This rule should be added to the calc group for the workbook so that it will be re-evaluated as a part of every calc cycle to allow the workbook alert to update as the data within the workbook changes. Because the alert in question contains two conditions, the rule must be able to evaluate either of the conditions.
The general form of alert calculation rules is one or more if statements that assign the name of a condition to the alert measure if the condition representing the alert is triggered. The assignment of a condition is handled by using a string literal that contains the name of the condition. For the example, the alert rule would be:
LowStkCalc:
LowStkAlrt = if (InvU < ProjSls, "Condition1", if (InvU < MinThrsh, "Condition2", ""))
For more information, see the section "Rules" earlier in this document.
Creation of the Workbook Alert
Within the Workbook Definition tool, a workbook alert must be created. This new alert should be configured according to the configuration already performed.
Figure 4-130 Configuration of Workbook Alert

Description of "Figure 4-130 Configuration of Workbook Alert"
Creation of Alert Conditions
Within the Workbook Definition tool, conditions must be defined for the workbook alert. These two conditions will correspond to the two triggers that will be a part of the alert. Note that it is not necessary to configure conditions before the creation of the alert rule but since the rule will make use of the condition names, it is suggested that they be created prior to the rule.
Figure 4-131 Configuration of Alert Conditions

Description of "Figure 4-131 Configuration of Alert Conditions"
At this point, the workbook alert has been configured. Upon the execution of the calculation cycle, the alert measure will be populated with the appropriate condition for any cell that is evaluated as an alert hit. This information will then be used by the client to display information about the workbook alert.
Creation of an Alert Badge at the Rollup Intersection
To show alerts at a rollup intersection in addition to the alert intersection, the alert measure must have popcount as the default agg type and the alert condition rollup must be defined.
Here is an example of the alert badge display in RPASCE UI:
Figure 4-132 Alert Badge at the Rollup Intersection
Description of "Figure 4-132 Alert Badge at the Rollup Intersection"
In this example, FcstAlertPC is the badge alert measure and shows the popcount of alert hits (2) at the higher rollup intersection using a badge of the number 2. FcstAlert is a regular alert measure that has ambig as the default agg and only shows alert hits at the alert intersection week_sku_str. The orange color of the alert hits -77 at the higher level is controlled by the style defined in the alert condition rollup, which is used for the badge alert FcstAlertPC at the higher rollup intersection.
Here are the configuration steps for the badge alert measure.
-
Configure the alert measure (AlFctAlertPC) with the default agg as the popcount.
-
The alert calc rule still produces the tooHigh and tooLow conditions:
-
In the workbook's Real Time Alerts tab, an additional rollup condition must be defined to provide the styles for the aggregated cells and must be configured as one of the alert conditions for the badge alert AlFcstAlertPC.
All of these defined conditions will appear in the Alert Info popup in RPASCE UI so that the user can match the styles to the condition.
At the alert intersection, the alert measure and its rule calculate the condition strings (tooLow, tooHigh, and so on) for the cells that have alert hits. These are used to format Target Measure cells based on the style defined for those conditions.
At rollup intersections, the Alert Measure cells contain a number based on the number of child populated cells. When a nonzero number is displayed here, the Target Measure cells are formatted with a special rollup style and display the numeric count as a badge on the cell. Normally, the cell's value is used to look up the condition name in the alert definition, and that style is used. For a popcount aggregation, the numeric value will not be found, so a condition name rollup is searched for in order to obtain the styles. If that is not found, the cell will be formatted in red like all alert measure values that do not match a configured condition.
In all cases, the alert display is subject to the following:
-
The alert must be selected for display in the Alert Popup dialog box on RPASCE UI.
-
When a cell is a hit for more than one alert, the priority is used and only the winner is displayed.
-


Measures Tab
The use of this tab is optional. It allows you to override certain properties of measures at the workbook level. Use this tab in cases when it is necessary to configure multiple workbooks for a solution and the processes implied by those workbooks require different measure behavior. For example, a measure must be writable in one workbook in a solution but read only in all other workbooks. By using this tab, you can override the following standard measure properties at the workbook level:
-
Label, Description
-
Base State
-
Agg State
-
UI Type
-
Single Hier Select
-
Range
In addition, there are two properties, LoadRange and LoadRangeMeas that are not standard measure properties that may only be set though the Measures tab.

Defining Measure Properties Override Settings for a Workbook
Complete the following steps to define the Measure Properties override settings for a workbook.
-
Click the Measures tab.
-
Right-click in the measure table area and select Add.
-
Select the newly added row.
-
Click Select Measure to get a list of the measures used in the workbook. The Figure 4-138 opens.
-
Type the first few characters of the measure name in the box at the top of the list to go to the required measure or scroll to find it. Double-click to select the desired measure. Measures that already have an entry in the Measures tab are listed but unavailable and cannot be selected.

Modifying Measure Properties Override Settings for a Workbook
Complete the following steps to modify the Measure Properties override settings for a workbook.
-
Click the Measures tab.
-
Modify the appropriate property information for the measure.
Removing a Measure Override Settings from a Workbook
Complete the following steps to remove the measure property override settings.
-
Click the Measures tab.
-
Right-click on the measure row you want to delete and select Remove.
Defining the LoadRange and LoadRangeMeas Properties
The LoadRange and LoadRangeMeas property fields can only be set in the Measure tab. They are used to specify dynamic picklists. Dynamic picklists are picklists whose valid values do not vary within a workbook but can be set dynamically during the workbook build process.
The LoadRange and LoadRangeMeas properties are retained for backwards compatibility purposes. In most cases context-sensitive picklists (that is, picklists using the measurerange = measS syntax in the range property) and single select wizards will be used instead.
Dynamic picklists are of two forms:
-
The first form has values that are set according to the data values in cells for another measure (using the same format as for the Range property of static picklists). As with static picklists, the value shown to the user in the UI is the label for the value. It is more usual to use context-sensitive picklists, where picklist values can vary according to context in the workbook.
-
The second form is to have values that are positions in a branch of a hierarchy. The value shown to the user in the UI is the label of the position, but the content of the cell is the name of the position. The single select wizard provides an alternative method for selecting a position, which is more commonly used.
Defining a Measure with a Dynamic Picklist
Complete the following steps to define a measure with a dynamic picklist.
-
Select the row for the measure.
-
Right-click in the row for the measure and select the Set Dynamic Picklist option.
-
If the picklist measure is to show hierarchy positions, an entry is required in the LoadRange property field (and not in the LoadRangeMeas property field). Click in the LoadRange field. The Figure 4-139 opens.
-
In the Range column, enter a name for the range. This name is used internally by RPASCE and needs to be unique across the application.
-
In the Hierarchy column, select the hierarchy from which the user is to select a position.
-
In the Dimension column, select the dimension from which the user is to select a position. The positions along this dimension, which are brought into the workbook, will be the available choices in the picklist in RPASCE Client.
-
Select the Sort by Label check box if the positions in the picklist are to be sorted alphabetically by their label. If this is not selected, the positions will be shown in their internal order, which is the order in which they were defined.
-
Click OK to save your changes and close the window.
Note:
When creating a dynamic picklist based on a dimension, you must ensure that the position labels for the source dimension do not contain opening or closing parentheses. Because dynamic picklists cannot parse label names that have parenthesis in them, using them in a label name will cause the system to encounter a run time failure when building or opening workbooks.
-
-
If the picklist measure is to display values based on the data values for a cell, an entry is required in the LoadRangeMeas property and in the LoadRange property fields. Click in the LoadRangeMeas field and click Select Measure. Type the first few characters of the measure name in the box at the top of the list to go to the required measure or scroll to find it. Double-click the measure whose contents are the valid picklist values. In addition, there should be an entry in the LoadRange field for each hierarchy in the base intersection of the selected LoadRangeMeasure. Each of the entries in the LoadRange field needs a name, hierarchy, and dimension as described previously, but the value for sort label is ignored. If the scope of the workbook is such that it covers multiple cells of the LoadRangeMeasure, the available picklist options in the workbook will be constructed from the content of the first cell of the LoadRangeMeasure when the dimensions are ranged to the positions selected during the workbook build process.

Make a Measure Editable during Elapsed Period
In RPASCE, the elapsed lock functionality locks historical cells of all measures along the calendar dimension based on the r_elapsed value, across the whole workbook. However, some applications such as IPOCS-Demand Forecasting require that certain measures be editable even in past or historical periods, while other measures must still be elapsed locked. The measures that can be edited and those that cannot are specific to the Workbook Template, so this setting is a Workbook Template customization rather than a measure property that applies across the whole application. The Workbook Measure Override table provides the Elapsed Lock Override column for users to achieve this goal.
By default, the Elapsed Lock Override column property is false. If users want to override the default value, users must add the measure into the Workbook Measure Override table if this measure row is not configured and set this new column field value to True.
Figure 4-140 Workbook Measure Override Table

Description of "Figure 4-140 Workbook Measure Override Table"
Make a measure editable during Elapsed Period using the Elapsed Lock Override column.
Note:
The configuration for Elapsed Lock Override is optional. If it is not configured, it defaults to false and the measure is locked within the Elapsed period and cannot be edited during the workbook. For automation, Applications such as IPOCS-Demand Forecasting can use Tools APIs to set the Elasped Lock Override property for their EditedMeasure object, to specify the set of measures that they are allowed to edit in history periods.
Extended Measures Tab
The use of this tab is optional. It allows for the configuration of extended measures that represent different usages of the underlying base measure. The following usages are supported for extended measures:
-
Creation of a measure that aggregates data using an alternate aggregation method from the default aggregation type of the measure. The aggregation types available are those configured as the Allowed Aggs of the measure.
-
Creation of participation measures, such as absolute and relative percent-to-parent measures.
-
Creation of a ranking measure, which assigns a rank in either ascending or descending order to the values of a measure.
-
Creation of a cumulative total measure, which contains a running total of a measure's values based upon an ascending or descending ranking.
-
Creation of a cumulative percentage measure, which contains a running percent-to-parent contribution total based upon an ascending or descending ranking.
Once defined, these extended measures can be added onto worksheet profiles to be viewed in the RPASCE Client.
Note:
Hybrid is not supported for extended measures.

Adding an Extended Measure
Complete the following steps to add an extended measure.
-
To add a measure, right-click in the table area and select Add. The row is inserted into the tab and is highlight in red until you define the Measure, Usage, and Argument fields.
-
Click Select Measure. The Select Measure window opens and is pre-populated with sorted candidate measures.
-
Double-click a measure to select it.
-
For Relative, Absolute, Ranking, Cumulative value and Cumulative percent extended measures, a label can be specified. This label will be used to display the extended measure within the workbook. If no label is entered, the label of the base measure will be used
-
In the Usage field, select Relative, Absolute, Ranking, Cumulative value, Cumulative percent, or an alternate aggregation type.
-
Click in the Arguments field and select the appropriate options. If the Usage is defined as Absolute the Figure 4-142 opens, set the appropriate options from the window and click OK. If the Usage is defined as Relative, select appropriate hierarchy from the list displayed. If the Usage is defined as Ranking, Cumulative value or Cumulative percent, the Figure 4-143 opens, set the appropriate options and click OK.
-
Within the Figure 4-142, the dimension that is used to determine the percent-to-parent contribution of an Absolute extended measure may be set. All dimensions higher than the dimension of the measure's base intersection for that hierarchy are available as well as the value AllDim, which represents all positions within the workbook.
-
Update the Figure 4-143 for these arguments that may be set for Ranking, Cumulative value and Cumulative percent extended measures:
Rank Order – Whether the ranking must be in ascending or descending order.
Display Type – Whether the ranking must be completed only on the base intersection of the measure, or at all aggregate intersections also.
Hierarchy – The hierarchy along which the values of the measure should be ranked or totaled.
Figure 4-143 Extended Measure Arguments Window

Description of "Figure 4-143 Extended Measure Arguments Window"Note:
Alternate aggregation extended measures do not require arguments.
-

Dynamic Position Maintenance Tab
If dimensions are enabled to support Dynamic Position Maintenance (DPM) in the Dimensions pane within the Hierarchy Definition tool, the configuration administrator will see those dimensions in the Dynamic Position Maintenance tab.
Note:
Dynamic Position Maintenance is referred to as Placeholder Maintenance in the Oracle Retail Predictive Application Server Cloud Edition User Guide and several other documents. Both terms refer to the same functionality.
The DPM Impact of the Dynamic Hierarchy User-Defined Dimension
When a user-defined dimension (UDD) is the modified dimension of a dynamic hierarchy definition in the workbook, the immediate child dimension of the UDD can be DPM-enabled if this immediate child dimension is DPM-enabled in the Hierarchy Definition configuration. See the section Workbook Hierarchies Tab and the Appendix – Dynamic Hierarchies, for more information on dynamic hierarchies. For example, USDK is both a user-defined dimension and a modified dimension of a dynamic hierarchy dH77. Its immediate child dimension SKU is DPM-enabled in the PDS, and so SKU and its parent dimensions (except USDK because UDD cannot be DPM-enabled) can be DPM-enabled in this workbook, as evidenced by the following Dynamic Position Maintenance figure.
Figure 4-144 Configuration of Dynamic Hierarchies in Workbook Hierarchies Tab

Description of "Figure 4-144 Configuration of Dynamic Hierarchies in Workbook Hierarchies Tab"
Figure 4-145 The SKU and Its Parent Dimensions in the Dynamic Position Maintenance Tab

Description of "Figure 4-145 The SKU and Its Parent Dimensions in the Dynamic Position Maintenance Tab"
Depending on how the workbook has been configured, some dimensions that support DPM within the PDS may not be available for DPM within the workbook. The following conditions will disqualify a dimension for DPM within a workbook:
-
Dimensions lower than the base intersection of the workbook will not be available for DPM. The base intersection of a workbook is the lowest base intersection of all measures within the workbook.
-
Dimensions belonging to a hierarchy that has been modified by the Remove Dimension or Change Rollup operations within the Workbook Hierarchies panel will not support DPM.
-
Dimensions more than one level higher than the modified dimension of a dynamic hierarchy will not support DPM.
-
Dimensions that are the modified dimension of a dynamic hierarchy will not support DPM if their immediate parent dimension (where week is the parent of day) does not support DPM.
-
Dimensions equal or above the PDS partitioning dim will not support DPM. The PDS partitioning dim is only available at the PDS deployment or patching time. During patching or deployment, the rpasInstall process will validate and catch such invalid DPM configurations, log warning messages, and overwrite the nonqualified dimensions to be DPM-disabled. The DPM like item measures configured on such dims will also be ignored.
In addition, if the workbook has been configured to contain workbook-only dimensions, those workbook-only dimensions support DPM if the dimension they aggregate supports DPM. See the “Workbook Hierarchies" section and the Dynamic Hierarchies Appendix for more information on workbook-only dimensions.
To enable DPM functionality in the workbook, select Enable Dynamic Position Maintenance. The configuration administrator may then select the highest dimension in the hierarchy in which the end user will add positions. See the Oracle Retail Predictive Application Server Cloud Edition Administration Guide and Oracle Retail Predictive Application Server Cloud Edition User Guide for more information on Dynamic Position Maintenance.
Figure 4-146 Dynamic Position Maintenance Tab

Description of "Figure 4-146 Dynamic Position Maintenance Tab"
Note:
Users cannot import positions from alternate hierarchies that are not already in the workbook to be used as parents for new DPM positions.
Remove a Workbook
Complete the following steps to remove a workbook.
Navigate: In the Configuration Components pane, select Project, then Solution, and then Workbooks. The Figure 4-72 opens in the workspace.
-
Select the workbook to remove.
-
From the toolbar, click Delete, or select Remove from the right-click menu.
-
Click Yes. The associated worksheets and tabs are removed.
Working with the Rule Group Simulator
The RPASCE calculation engine is powerful and complex. The rule group approach means that there are very many potential calculation paths. However, during any configuration exercise, there is a significant design verification cost to ensure that the behavior is as would be expected by an end user. The rule group simulator enables the verification of the interaction between measures from within the Configuration Tools. It cannot, however, enable the verification of the calculations themselves because that requires a full PDS to be built.
The Rule Group Simulator is integrated into the workbook tool, and it uses all of the measures used in the rule set in the workbook, which may be more than those mentioned in the rule group being simulated. Users of the rule group simulator are expected to understand the calculation cycle, especially with respect to measure protection processing and the process that determines which expressions will be evaluated. See Appendix – Calculation Engine User Guide for more information.
Note:
The rule group simulator is not able to simulate the expressions that will be evaluated as the result of a rule group transition, nor simulate the calculations that will follow if a rule group is evaluated in full mode, such as when evaluated from the mace utility, or the evaluation of the load rule group when a workbook is built.
About the Rule Group Simulator
The Rule Group Simulator feature is provided in a separate window with two areas: a measure table, and a tree view with Upstream and Downstream Dependencies panes.

The measure table displays all of the measures in the scope of the simulation. The Measure column displays the measure name. The measure status is reflected by color coding. A tooltip also displays the measure status when the mouse is placed over the measure name. All measures can be shown, or the list of measures can be filtered. Editable measures can have their status toggled (to or from Edited), and the simulator immediately updates all statuses, calculations, and trees. Figure 4-4 explains the meaning of the color coding used in the Figure 4-147.
Table 4-4 Color Coding Used in the Rule Group Simulator Window
| Color | Meaning |
|---|---|
|
Yellow |
Edited. If it is a recalc measure, it will be calculated by indirect spreading of another measure through a mapping rule and recalculation at aggregated levels. If the measure has another aggregation type, it will be calculated by spreading and aggregation. |
|
Pale Gray |
Editable. Although the measure is not forced, and thus is still editable, it will be calculated through the calculation engine having to select an expression in an affected rule. |
|
White |
Editable. Will not be calculated, so it will not change at all. |
|
Pale Blue |
Protected by protection processing. Although the measure is protected (usually this will be because it is the measure on the left-hand side of the only expression in a rule), it is not forced because none of the right-hand side measures are changed, so it does not need to be calculated, and it will not change at all. |
|
Mid Blue |
Protected by protection processing. Is forced, so it will be calculated. |
|
Dark Blue |
Read-only. The measure is set as being read only in the measure properties, so it will not change at all. A measure that is read-only but is going to be calculated will be shown as mid-blue. That status takes priority over read-only. |
Note:
The status of a measure encapsulates two concepts that are not as closely linked as they may seem:
Whether or not the measure can be edited (shades of blue = no, white/gray/yellow = yes)
Whether or not the measure will be calculated.
It is possible for a measure to be editable, but it would be calculated if a calculate were issued. Similarly, it is possible for a measure to be protected by protection processing that would not be calculated if a calculate were issued.
The Rule - Expression column of the table shows the calculation for each measure. For those measures that would be calculated if the end user issued a calculate with the current collection of edited measures, the rule and expression that would be used to calculate the measure is shown. For non-calculated measures, this column displays the measure status.
The tree view shows (in separate panes) the upstream and downstream measure relationships (that is, the expressions that will be evaluated) for the measure with focus. Measures in the panes are also color coded. If the measure with focus would be calculated, the upstream pane shows the expression to calculate it and all measures that it is dependent upon (calculated from) with their expressions, if appropriate. The downstream pane similarly shows measures that are dependent upon (calculated from) the measure with focus, if there are any. If the measure with focus is on the right-hand side of several expressions that will be calculated, each of the expressions can be viewed using the forward and backward arrows.
Invoking the Rule Group Simulator
Complete the following steps to open the Rule Group Simulator window.
Navigate: In the Configuration Components pane, select Project, then Solution, and then Workbooks. The Figure 4-148 opens in the workspace.

-
Select one of the workbooks in the Workbook Designer tree display.
-
Select the General tab of the Workbook properties table.
-
Right-click on Calc Rules and select Simulate Rule Group.
Figure 4-149 Simulate Rule Group Menu Option

Description of "Figure 4-149 Simulate Rule Group Menu Option" -
The Rule Group Simulator window opens.
Filtering the Measures Table
Complete the following steps to filter measures displayed in the rule group simulator.
-
Open the Rule Group Simulator. See Invoking the Rule Group Simulator.
Figure 4-150 Rule Group Simulator Showing Filter and Search Features

Description of "Figure 4-150 Rule Group Simulator Showing Filter and Search Features" -
To filter the measures table, select the one of the following options from the Filter list:
-
Select All to display all measures in the workbook.
-
Select Will Calculate (According to Calculation Order) to display only those measures that will be calculated. The sequence of the measures displayed is the sequence in which they will be calculated. Measures that are edited are not shown.
-
Select Will Not Calculate to display only those measures that will not be calculated will be shown. Measures that are edited are not shown.
-
Select Read Only to display only those measures whose status is read-only (that is, have a Base State and Agg State of read).
-
Select Contains String to type a case-sensitive string to filter by in the text box underneath the Filter list option. Only measures that include the string entered are displayed.
-
Select By Worksheet to select a worksheet from the current workbook using the list option underneath the filter list option. Only the default measures from that worksheet are shown. The Worksheet list option is unavailable until By Worksheet is selected from the Filter list.
-
-
If searching for a specific measure, set the filter to All, and enter a search string (case-sensitive) in the box underneath the Filter list. The first measure that includes the string will be shown and will become the measure with focus.
Changing the Edited Status of Measures
Complete the following steps to change the edited status of measures.
Note:
Only measures that can be edited (colors gray, white, and yellow) may have their status changed.
-
Select the name of the measure in the measure table.
-
If the status was previously Editable (gray or white), the status of the measure changes to Edited (yellow).
-
If the status was previously Edited (yellow), the status of the measure changes to Editable (either gray or white, depending on the rule group and the other edits currently applied).
After any change in status, the simulator updates all necessary statuses, calculations, and tree views.
-
-
To change the status of all Edited measures back to Editable (gray or white), click Reset.
Note:
Measures that are calculated in a cycle, which typically includes BOP and EOP inventory values, are indicated with an asterisk * next to their names in the measure table and Upstream and Downstream Dependencies panes.
Using the Upstream and Downstream Panes
Complete the following steps to use the upstream and downstream panes
-
To change the measure with focus for the upstream and downstream panes:
-
With the Filter list option set to All, enter a search string in the field under the Filter list option. The first measure that contains the search string will get focus.
Note:
Remember, when searching by measures, the text entered in the search text field is case-sensitive.
-
Click in the Calculation Column of the measure table for the measure.
-
Click on any occurrence of the measure in the Upstream or Downstream Dependencies panes.
When the focus changes, the tree panes are refreshed as appropriate based on the measure which currently has focus, and the measure table scrolls so the measure with focus is shown.
The measure with focus always displays at the top of the Upstream Dependencies pane. If it will be calculated, the Upstream pane shows the measures that it is dependent upon (calculated from, directly and indirectly). This is displayed using a parent-child tree structure with the measures used to calculate an individual measure showing as children of it. If the children are also calculated, they display with their dependent measures, and so on. Therefore, the expanded Upstream Dependencies tree view displays all the measure relationships that affect the measure with focus.
The Downstream Dependencies pane shows measures that are dependent upon (calculated from) the measure with focus, if there are any. Measure relationships (expressions) display in a parent-child tree structure. If the measure with focus is on the right-hand side of several expressions that will be calculated, the relationships cannot all be shown at the same time in a simple tree structure, so a single relationship is displayed. The number of such relationships, and the one being shown, is indicated at the bottom of the pane.
-
-
To collapse the detail of the dependencies for a measure in the Upstream or Downstream panes, click Minus next to the measure name. The Minus changes to a Plus, and the detail is collapsed. To expand the detail of the dependencies for a measure in the Upstream or Downstream Dependencies panes, click the Plus next to the measure name. The Plus changes to a Minus and the detail is expanded.
-
To change which measure relationship for the measure with focus is shown in the downstream pane, click the back or forward arrows beneath the Downstream Dependencies pane.
Note:
The Rule-Expression column of the measures table will display multiple result expressions with a note beside the rule name saying that it is a multiple result. Furthermore, the entire expression will be displayed showing all of the left-hand side measures that comprise the multiple results. If a measure that has focus is one of the multiple result measures, it will be shown in the Upstream and Downstream Dependencies panes as MeasA [+MeasB][+MeasC] where MeasA is the measure with focus and MeasB and MeasC are the other multiple result measures.
Working with Workbook Tabs
Workbook tabs are a feature in the RPASCE Client that enables the workflow to be separated into steps or business processes. The RPASCE Client can have tabs, but those are set up using the taskflow. Each workbook must have at least one tab. Users select the appropriate tab to use depending on the stage they have reached in the business process. A tab may contain one or more worksheets that allow the users to interact with the data in the workbook. The measures available, the orientation of the hierarchies, and the base intersection that data is available for may vary by worksheet within the tab.

Create a Workbook Tab
Complete the following steps to create a workbook tab.
Navigate: In the Configuration Components pane, select Project then Solution, and then Workbooks. The Figure 4-200 opens in the workspace.
Figure 4-153 Workbook Design Window with Create New Workbook Tab

Description of "Figure 4-153 Workbook Design Window with Create New Workbook Tab"
-
Select the workbook in which to create a new workbook tab.
-
Choose one of the following methods:
-
Click New Workbook Tab.
-
Right-click and select the New Workbook Tab.
-
Select an existing workbook tab in the workbook, and press Insert.
A new workbook tab is created.
-
-
In the RPAS Name field, enter RPAS internal name of the workbook tab.
-
In the User Label field, enter a description of the workbook tab that users will see on the tab in the RPASCE Client.
Edit Workbook Tab Properties
Complete the following steps to edit workbook tab properties
Navigate: In the Configuration Components pane, select Project then Solution, and then Workbooks. The Figure 4-200 opens in the workspace.
-
Select the workbook tab whose properties are to be edited.
-
In the General tab, type the RPAS Name and the User Label.
-
Complete one of the following to alter the order in which the tab is displayed in the RPASCE Client:
-
To change the order of the tabs, select the up button or down button as necessary.
-
Drag and drop the tab in the Workbook Designer tree display.
-
Remove a Workbook Tab
Complete the following steps to remove a workbook tab.
Navigate: In the Configuration Components pane, select Project then Solution, and then Workbooks. The Figure 4-200 opens in the workspace.
-
Select the workbook tab to remove.
-
Choose one of the following methods:
-
From the toolbar, click Delete.
-
Select Remove from the right-click menu.
-
Press Delete.
-
Click Yes.
The workbook tab and associated worksheets are removed.
Comprehensive Workbook Validation
In addition to the real-time validation of user inputs, the Workbook Designer has the capability to perform a comprehensive validation of all Workbook content in the solution. Upon performing comprehensive validation, the Task List will be updated with any validation issues present in the Workbooks of the Configuration.
Complete the following steps to complete comprehensive workbook validation.
Navigate: In the Configuration Components pane, select Project then Solution, and then Workbooks. The Figure 4-200 opens in the workspace.
-
From the toolbar, click Comprehensive Validation.
-
All Workbook content for the solution will be validated and any issues detected will be entered in the Task List.
Working with Worksheets
The following sections provide descriptions of the worksheet components.
Measures and Worksheets
A worksheet is a specific window into the data in a workbook. Worksheets are placed on workbook tabs. Using the Configuration Tools, you define the measures on a worksheet, the base intersection the worksheet uses, and the orientation of the hierarchies on the worksheet. The workbook measures can be organized in following categories for a worksheet:
-
Selected profile
-
Viewable profile
-
Hidden
-
Extended
Selected Profile Measures
The selected profile contains the list of measures that are initially displayed for this profile in the RPASCE Client. All worksheets have one profile that is marked as the default profile. This default profile is the profile that displays when a workbook is initially built. There must be at least one measure on each of the selectable profiles.
Viewable Profile Measures
The viewable profile contains the full list of measures that the RPASCE Client user can view in the worksheet by using the Show/Hide functionality within the RPASCE Client. It must contain all of the measures in the default profile, but it often includes further measures that are not initially displayed.
Hidden Measures
Hidden measures are those that are used in the rule set assigned to a workbook, but that are not assigned to any of the profiles in any of the worksheets contained in that workbook. This might include measures that are used purely for calculation purposes and would have no usefulness to the RPASCE Client user.
Extended Measures
Extended measures, which represent different usages of the underlying base measures, can be added to the default or viewable worksheet profile. You can add extended measures that are aggregated based on different aggregation methods. The aggregation methods available for selection are based on the Allowed Aggs of the base measure. The same base measure can have multiple extended measures based on different aggregation methods.
You can also add extended measures that represent the relative and absolute percent-to-parent contributions. The same base measure can have multiple extended measures based on different selections for relative and absolute percent-to-parent contributions.
You can add extended measures that rank the values of a measure in either ascending or descending order or that contain a running total of a measure's values based on an ascending or descending ranking.
Worksheet Types
There are two types of worksheets supported. The Pivot/Chart type worksheet type is supported for all Fusion Clients and RPASCE Clients.
Filterable Sheets
The RPASCE Client provides the capability to filter the visible positions of a worksheet based upon the selection context of a different worksheet. By default, this filtering is enabled for all worksheets. It is possible to exclude worksheets from the list of filterable worksheets. Selecting this attribute in the table opens the Figure 4-154.
Figure 4-154 Select Filterable Worksheets Window

Description of "Figure 4-154 Select Filterable Worksheets Window"
The Figure 4-154 contains the list of all candidates for filtering from the worksheet being edited. By default, all worksheets will be in the Filterable Worksheet column. By selecting one or more worksheets and moving them to the Unfilterable Worksheets column, those worksheets will not be able to be filtered from the worksheet being edited.
Create a Worksheet
Complete the following steps to create a worksheet.
Navigate: In the Configuration Components pane, select Project then Solution, and then Workbooks. The Figure 4-200 opens in the workspace.
Figure 4-155 Workbook Design Window with Create New Worksheet Option

Description of "Figure 4-155 Workbook Design Window with Create New Worksheet Option"
-
Choose one of the following methods:
Click New Worksheet to create a new worksheet.
Right-click and select New Worksheet.
Select another worksheet on the same tab.
-
Press Insert.
A new worksheet is created.
-
Assign the appropriate properties using the worksheet tabs (General, Position Queries, Measure Profiles, Style Overrides, and Window Formatting).
Defining Worksheet Properties for Pivot/Chart Worksheets
When the Pivot/Chart worksheet type is selected from the Workbook Designer window, the following tabs display in the workspace:
General Tab
Complete the following steps to update the General tab.

-
In the RPAS Name field, enter the RPAS internal name of the worksheet.
-
In the User Label field, enter a description of the worksheet that users will see.
-
In the Worksheet Type field, select Pivot/Chart.
-
Determine candidates for filtering from the worksheet, if any.
Figure 4-158 Select Filterable Worksheets Window

Description of "Figure 4-158 Select Filterable Worksheets Window" -
Define the axis layout of the worksheet.
-
Click the X-axis, Y-axis, Z-axis, or Unassigned field. The Axis window opens.
-
Drag the hierarchies to the appropriate axis column.
-
Click OK to save any changes and close the window.
Note:
The Hierarchies that appear in this process are those used by measures placed on the default and viewable profiles for the worksheet. If no measures have yet been placed in those profiles, no hierarchies appear in this process.
-
-
Click in the Base Intersection field. The Figure 4-160 opens.
Note:
The hierarchies and dimensions that appear in this process are those used by measures placed on the default and viewable profiles for the worksheet. If no measures have yet been placed in those profiles, no hierarchies appear in this process.
-
Select the dimension for each hierarchy. The base intersection of the sheet represents the base set of dimensions at which the window could be displayed. Data on the window can be viewed at any dimension/intersection higher than this. If the base intersection of a measure on the sheet is underneath the base intersection of the sheet, the measure's values are shown aggregated to the displayed intersection. If measure's base intersection is higher than the sheet intersection, the measures values are hashed out at all intersections lower than the base intersection of the measure.
-
Define the Hide Worksheet Meas property. This property is optional and can only be configured within the Grid/Pivot worksheets. Once the Hide Worksheet Measure is configured and has a value of TRUE, the worksheet is hidden within the RPASCE UI.
When the user clicks the Hide Worksheet Meas field, a dialog box is displayed where the user can select a measure from the pre-populated candidate measure list. The candidate measures are Boolean, Scalar measures that are defined within this workbook rule set. Whether or not this measure has storage database is not required.
This measure’s value must be computed at the workbook build time and remain static. The Hide Worksheet Measure can be within the workbook load rules and calculated then.
Figure 4-161 Select a Hide Worksheet Measure

-
Click OK.


Measure Profiles Tab
Complete the following steps to update the Measure Profiles tab.
Usage of this tab is optional. This tab allows users to configure additional measure profiles beyond the Default profile for the worksheet. These additional profiles may be populated with measures in the same manner as the default profile. When the workbook is built, these additional profiles will be available through the RPASCE Client to provide users a different set of measures or a different measure ordering for the measures of the worksheet.

Adding a Measure Profile
Complete the following steps to add a measure profile.
-
Click the Measure Profiles tab.
-
Right-click in the table area and select Add.
-
Enter the following information:
-
Name – The name for the measure profile used by RPASCE. This name must be unique across the worksheet.
-
Label – The label for the measure profile that is used internally by RPASCE. This label must be unique across the worksheet.
Note:
Duplicate label names are not allowed within the scope of the worksheet.
-
Copying a Measure Profile
Complete the following steps to copy a measure profile.
-
Click the Measure Profiles tab.
-
Select an existing measure profile.
-
Right-click in the table area and select Copy.
-
A new measure profile will be created that contains the same measure membership an ordering as the selected profile. This new measure profile must be saved under a new profile name.
Marking a Measure Profile as Default
Complete the following steps to mark a measure profile as default.
-
Click the Measure Profiles tab.
-
Select an existing measure profile that is not the default (the first profile in the table is always the default).
-
Right-click in the table area and select Make Default.
-
The selected measure profile becomes the default profile for the worksheet and moves to the first row in the measure profile table.
Removing a Measure Profile
Complete the following steps to remove a measure profile.
-
Click the Measure Profiles tab.
-
Selected an existing measure profile that is not the default.
-
Right-click in the table area and select Remove.
-
The selected measure profile is removed from the list of profiles for the worksheet.
Position Queries Tab
Usage of this tab is optional. This tab allows you to specify a worksheet where the positions that are shown in a query dimension are based on the current position in driving dimensions. The driving dimensions can be absent, such as in IPOCS-Demand Forecasting applications. If the driving dimensions exist, they must be in the slice area. The process uses a position query that is a Boolean measure dimensioned on the query dimension and the driving dimensions. Only positions in the query dimension that have the value TRUE for the position query measure for the positions in the driving dimensions are shown in the worksheet. All other positions are automatically hidden.
When more than one driving dimensions are present, all the driving dimensions have to be in Z-axis for the position query to execute. If one or more driving dimensions are taken out of the Z-axis and placed in X or Y axes, associated position queries will not be executed. A given window can have more than one position query, driven by one or more dimensions in the Z-axis and driving different dimensions in the X, Y, and Z axes.
Note:
Position Queries are referred to as Special Filters in the Oracle Retail Predictive Application Server Cloud Edition User Guide and several other documents. Both terms refer to the same functionality.
Figure 4-163 Position Queries Tab for a Worksheet

Description of "Figure 4-163 Position Queries Tab for a Worksheet"
Complete the following steps to update a Position Queries tab.
-
Click the Position Queries tab.
-
Right-click in the table area and select Add.
-
Enter the following information:
-
Name – The name for the position query used by RPASCE. This name must be unique across the project.
-
Label – The label for the position query that is used internally by RPASCE. This label must be unique across the project.
Note:
Duplicate label names are not allowed.
-
Measure – This defines the position query measure. This must be a Boolean type measure. Click in the field, and then click Select Measure to view a list of the Boolean measures used in the workbook. Type the first few characters of the measure name in the box at the top of the list to go to the required measure or scroll to find it. Double-click to select the desired measure.
-
Result Dimension - This defines the query dimension. Select a dimension from the list of dimensions for the selected measure.
Note:
While configuring position queries, it is important that the Boolean mask measure that drives the position queries be referenced in the workbook (by either referencing it in the load rule group or by setting it through the calc rule groups). Currently, there is no validation in Configuration Tools that checks for this, and no error is thrown at configuration time/PDS build time or workbook build time.
RPASCE does not support multiple PQDs with the same resulting dimension active at one time. If this condition exists, these PQDs overwrite each other rather than combine, so the results are not desirable.
-
PQD Always On – When this property is set to true, users cannot disable the PQD through the Special Filters filter list in the RPASCE client. It must be used for queries that are central to the process being performed in a worksheet to the extent that the process cannot be performed without the PQD.
-
-
To remove a row from the tab, select the row, right-click, and select Remove. The row is deleted from the Position Queries tab.
Style Overrides Tab
Usage of this tab is optional. This tab allows you to override the style property for a measure, so that measure uses a different formatting style in the worksheet. The Style Overrides tab can also be used to apply a formatting style to an attribute defined on any of the dimensions used in the worksheet. This formatting style will then be applied to the attribute where it displays within the worksheet.
Note:
The measures that appear in this process are those placed on the profiles of the worksheet. Attributes that appear are those that are defined at or higher than the intersection of the worksheet. If no measures have been placed on profiles and the worksheet has not been configured with an intersection, no entries appear in the Style Overrides tab.
Figure 4-164 Style Overrides Tab for a Pivot/Chart Worksheet

Description of "Figure 4-164 Style Overrides Tab for a Pivot/Chart Worksheet"
Complete the following steps to update the Style Overrides tab.
-
Click the Style Overrides tab.
-
Select an override formatting style for a measure. Measures whose styles have been overridden display in black. Those whose styles are defaulting display in gray.
Window Formatting Tab
Usage of this tab is optional. This tab allows you to specify the display attributes for the dimensions used within the worksheet. By default, dimensions display the position label within the RPASCE Client. If there are any additional attributes defined for a dimension, the client can display those attributes in addition or in place of position labels. Within the RPASCE Client, if a media UI Type attribute is added to the set of display attributes, the RPASCE Client will display the appropriate image in the position display area.
Figure 4-165 Window Formatting Tab for Worksheet

Description of "Figure 4-165 Window Formatting Tab for Worksheet"
Add Additional Display Attributes for a Dimension
Complete the following steps to add additional display attributes for a dimension.
-
Click the Window Formatting tab.
-
Right-click and select Add from the menu.
-
Within the Figure 4-166, specify the dimension to modify.
-
Select desired attributes from the list of available attributes for the dimension.
-
Click OK.

Modify Order of Existing Attributes
Complete the following steps to modify order of existing attributes.
-
Click the Window Formatting tab.
-
Select the dimension to modify from the hierarchy tree.
-
Within the Order column, use drag-and-drop to modify the attribute order.
Remove a Display Attribute
Complete the following steps to remove a display attribute.
-
Click the Window Formatting tab.
-
Select the dimension to modify from the hierarchy tree.
-
Select an attribute doe the dimension in the Order column or attribute table.
-
Right-click and select Remove from the menu.
Note:
All dimensions have the label attribute set by default and all dimensions must retain at least one display attribute.
Defining Worksheet Properties for Worksheets Tiled View
RPASCE supports a view within the RPASCE Client, called the Tiled View, that supplements the Pivot, Chart and Detail Pop-up views also supported by the RPASCE Client. This view allows for the display of a series of tiles. Each tile represents a position of the Tile Axis hierarchy, shown at the intersection formed by row and page axis positions. Each tile is displayed as a single visual block that contains the visible attributes for the tile position, and cells for visible dimensional measures, if any, at that tile's intersection.
For example, configuring the Product hierarchy to be the Tile Axis hierarchy will result in each position along the Product hierarchy being represented by a tile. This tile can display attribute values for the Product position. The tile may also display Measure values for the intersection of this Product position with whatever positions are on the row and page axis.
The Tiled View may be configured so that a tile is only displayed for an intersection based on the value of a Boolean tile measure. Drag and Drop and Remove operations can be configured to manipulate this Boolean value accordingly.
Tiled View Worksheet
The Workbook Designer of the RPASCE Configuration Tools allows the creation and modification of Tiled View worksheets. Users of the Configuration Tools are able, by using the Worksheet Type attribute located within the General Properties tab of a worksheet, to set a worksheet from the default of Pivot/Chart worksheet to the new Tile worksheet.
Once a worksheet has been set to a Tile Worksheet, the Workbook Tool user interface updates to present the user of the Configuration Tools with the options available for Tiled View worksheets in the same manner that it changes when a worksheet is configured to be a Detail Pop-up worksheet.
Properties of the Tiled View Worksheet
Tiled View Worksheets support a set of properties in the same manner as Pivot/Chart worksheets and Detail Pop-up worksheets. The configuration of these properties is managed through the General Properties tab of the Workbook Designer through the same table interface used to configure properties for existing worksheet types.
From a configuration standpoint, Tiled View worksheets are very similar to Pivot/Chart worksheets. The two views share many of the same sets of properties and optional configuration elements (implemented through the various tabs available within the Workbook Designer when a worksheet is selected.) However, some Pivot/Chart specific properties may not be configurable for Tiled View worksheets (as mentioned later). In addition, Tiled View worksheets support additional, Tiled View specific properties.
The set of configurable properties for the Tiled View worksheet and summary information on each property can be found in this section.
RPAS Name
The RPAS Name attribute is the internal name used by RPASCE to identify the worksheet. The value of this property must be a valid RPASCE name and is validated according to the rules for RPASCE names.
User Label
The User Label attribute is an external name used to identify the worksheet to the user of the RPASCE Client. The value of this property is displayed within the RPASCE Client for single language applications and is the resource exported for translation in multi-language applications.
Worksheet Type
The worksheet type attribute must be set to Tiled View in order to configure a Tiled View worksheet.
Filterable Sheets
As with Pivot Table Views, Tiled View worksheets support the ability to filter the visible positions of a worksheet based upon context supplied by the worksheet. The Tiled View supports only the existing show/hide position-based filtering; the application does not allow Tile Filtering based upon the Tile Measure to other views.
Tiled Axis, Row Axis, Page Axis and Unassigned Axis
The Tiled View worksheet contains an axis layout that is similar but not identical to the X-, Y- and Z-Axis layout schema used by Pivot worksheets. Like traditional axis layouts, the Tiled View axis layout requires the hierarchies present in the base intersection of the worksheet to be assigned to one and only one axis.
The Tiled View axis layout differs in the names and meanings of the axes used. Tiled View axis layout consists of:
-
Tile Axis – This Axis supports only one hierarchy and is the axis that corresponds to tiles; each visible position in the Tile Axis is represented by a single tile in the view.
-
Row Axis – The Row Axis may contain a single hierarchy. When configured, this hierarchy is used to create groupings of tiles where multiple blocks of tiles representing the Tile Axis hierarchy are organized according to the positions of the Row Axis hierarchy. Use of the Row Axis is optional; when no Row Axis hierarchy is configured there will be only a single block of tiles as determined by the Tile Axis hierarchy.
-
Page Axis – All hierarchies present in the base intersection of the worksheet that are not assigned to either the Tile Axis or Row Axis must be assigned to the Page Axis. This axis is functionally equivalent to the Page Axis, or Z-Axis, of Pivot Table views. Hierarchies assigned to the Page Axis are navigable using a set of controls that page the view as the selected position is modified by the user.
-
Unassigned Axis – As with Pivot Views, there are no valid cases in which hierarchies may be assigned to the Unassigned Axis. This attribute provides information to the user of the Configuration Tools that one or more hierarchies has not yet been assigned to a valid axis and details which hierarchies require axis assignment.
Base Intersection
As with Pivot Views, a Tiled View worksheet has a base intersection. Unlike Pivot View worksheets, which allow a number of valid intersections for any given view, Tiled View worksheets require the base intersection of the worksheet to be identical to the base intersection of the Tile Measure, if one is defined. Tiled View worksheets that do not make use of a Tile Measure support the configuration of a base intersection based upon the dimensional measures present in the view profiles.
Tile Measure
The Tile Measure is a measure used by the Tiled View worksheet to manage several behaviors associated with the view and its support of filtering and drag and drop operations within the RPASCE Client. Prior to using the Tiled View worksheet in conjunction with these functionalities, the Tile Measure must be configured with the name of the Boolean measure that will be used.
Tile Measure is an optional property. A Tiled View can be configured that does not specify a Tile Measure. However, Tiled View worksheets that do not specify a Tile Measure do not support the following behaviors:
-
Filtering of tiles based upon Tile Measure cell values
-
Drag and Drop operations
-
Formatting the Background Color of the Entire Tile
When a tile measure is specified, the cell contents of the measure are used to drive tile filtering. For any given page/row slice, the tile axis hierarchy positions whose cell values are equal to the Tile Value is displayed and those whose cell values are different from the Tile Value are filtered. Drag and drop operations, if they are enabled, modify the cell values of the tile measure with the resulting change to the visible set of positions at the time of the operations (and not as a result of a subsequent calculation cycle.)
Note:
The background color of the entire tile is taken from the formatting of the Tile Measure, if present. This can be set via Measure/Cell styles, Boolean Exception Formatting, or by being the target measure for a Real Time Alert.
Tile Value
When used in conjunction with the RPASCE Client drag and drop functionality, the Tile Value attribute contains the value to be set into the Tile Measure as a part of a drop operation. It must be either true or false in order to be contained by the Boolean Tile Measure
Filter Tiles
This attribute specifies whether the values of the Tile Measure are used to drive filtering of visible intersections within the Tiled View worksheet. If checked, only intersections for which the Tile Measure's value for that tile is equal to the configured Tile Value will be visible.
Enable Drop
When Drop is enabled, then the worksheet can serve as a drop location within the constraints set by the Drag Source Hierarchies attribute.
Drag Source Hierarchies
This attribute is used in conjunction with the drag and drop functionality enabled by configuring a Tile Measure, Tile Value, and checking the Enable Drop attribute. When drag and drop is enabled, a drag and drop action transmits the selection from the dragged tile to the Tiled View worksheet upon which is the drop target.
Those hierarchies which are configured through drag source hierarchies have their selection context transmitted, those hierarchies which are not configured as drag source hierarchies instead use the position context of the page and/or row upon which the tile is dropped. Drag Source Hierarchies must include the Tile Axis hierarchy; it can optionally include any other hierarchy in the base intersection of the Tile Measure.
For example, assume a drag and drop action between two Tiled View windows configured along CLND, PROD and LOC. In both windows, PROD is the Tile Axis hierarchy, LOC is the Row Axis hierarchy and CLND is the Page Axis hierarchy. Assume also that the drag source hierarchies attribute of the target view is PROD.
When processing the drag and drop action, the position along PROD corresponding to the tile that was dragged is combined with the LOC and CLND positions based upon the row and page where the tile is dropped to determine the relevant intersection. If, instead, drag source hierarchies had been configured to be PROD and LOC, then the PROD and LOC positions would be those of the dragged tile and only the CLND position would be determined by the page upon which the tile was dropped.
Figure 4-167 General Properties Tab of a Tiled View Worksheet

Description of "Figure 4-167 General Properties Tab of a Tiled View Worksheet"
Figure 4-168 Process Flow for Configuring a Tiled View Worksheet

Description of "Figure 4-168 Process Flow for Configuring a Tiled View Worksheet"
Additional Tabs of the Tiled View Worksheet
Tiled View worksheets support the configuration of additional options through tabs present in the Workbook Designer when a Tiled View worksheet is loaded into the User Interface. The additional tabs supported when working with a Tiled View worksheet are:
Style Overrides
Tiled View worksheets support the ability to configure styles for measures displayed within the view. The Style Override tab will therefore be available when configuring a Tiled View worksheet and it functions in the same manner as in Pivot and Detail Pop-up Views.
Additionally, it is possible to configure a set of formatting properties that are applied to the tile itself in a Tiled View worksheet. The primary property supporting configuration is the color of the tile. In order to allow the configuration of tile format properties, the Style Override panel will also include an entry for the Tile Measure. Setting a style for the Tile Measure within the Style Override panel will cause the set style to be used for tile formatting and not the base configured style of the measure, if a style has been configured for the measure. The measures in the Style Overrides panel are sorted in alphabetic order and the sorting is case-insensitive.
Figure 4-169 Style Override Panel for a Tiled View Worksheet Showing a Tile Measure

Description of "Figure 4-169 Style Override Panel for a Tiled View Worksheet Showing a Tile Measure"
Measure Profiles
Tiled View worksheets support the ability to configure multiple user profiles for the measure present in the view. The configuration of these profiles and the process of defining the measures present in each will follow the behavior of measure profile configuration for Pivot View worksheets with the exception that it will be considered valid for a measure profile to contain no measures.
This is intended to support a case in which the tiles of the Tiled View contain only dimension attributes configured through Window Formatting. One scenario is a tile that contains only a single media measure attribute to display an image in the tile or potentially an image and the position label for the tile.
Figure 4-170 Measure Profiles Panel for the Tiled View Worksheet

Description of "Figure 4-170 Measure Profiles Panel for the Tiled View Worksheet"
Window Formatting
Like Pivot Views, Tiled Views support worksheet style configuration through a Window Formatting tab. Here you can define which display attributes you would like to be visible for each dimension of the worksheet. Attributes defined for dimensions of the Tile Axis hierarchy appears within each tile in addition to any dimensional measures defined for the worksheet's profiles. If label is the first visible attribute it appears in the tile's header.
Figure 4-171 Window Formatting Panel for a Tiled View Worksheet

Description of "Figure 4-171 Window Formatting Panel for a Tiled View Worksheet"
Position Queries
Tiled View does support the use of Position Queries. So, the Position Queries panel of the Tiled View worksheet functions in the same manner as Pivot View worksheets.
Figure 4-172 Position Queries Panel for a Tiled View Worksheet

Description of "Figure 4-172 Position Queries Panel for a Tiled View Worksheet"
Defining Worksheet Properties for the Worksheets Container View
RPASCE supports a Visual Planning capability within the RPASCE Client. Three views are introduced to support the Visual Planning capability.
-
In the RPASCE client, the Container View type groups the sub-views, two Card views and one Summary View, together within a given layout, sharing a top filter that acts as a page edge. This is the view that displays in the View Manager. The sub-views specified here generally do not display directly in the view manager. The sub-views are expected to conform to the requirements of the container.
-
The Card View is like the Tiled View in Fusion Client but allows one or more platform-supported card types (list, small, large, image w/popup) to be selected and configured to specify how they are populated. This can be configured to support drag/drop and add/remove functionality.
-
The Summary View is a summary panel to display some key metrics and a breakdown. Like the Card View, this has platform-supported summary types (only one so far), each paired with a summary configured that specifies how this is populated. The metrics here are displayed at the intersection defined by the top filter, except for the breakdown part, where the attribute choice changes one of the dimensions to the configured level and shows a breakdown of those positions.
Here is how this relates to an Assortment example:

The Workbook Designer of the RPASCE Configuration Tools can be used in the creation and modification of the Container View worksheets. Users of the Configuration Tools are able, by using the Worksheet Type attribute located within the General Properties tab of a worksheet, to set a worksheet from the default of the Pivot/Chart worksheet to the Container View worksheet.
Once a worksheet has been defined as a Container View Worksheet, the Workbook Tool user interface updates to present the user of the Configuration Tools with the options available for Container View worksheets in the same manner that it changes when a worksheet is configured to be a Detail Pop-up worksheet.
Features of the Container View Worksheet
As mentioned in the overview, the Container View groups other views for a common purpose and a specific layout. The Container View worksheet defines the common Top Filter Dimensions, sub-views specified by Worksheets, a card hierarchy, and a Layout Type that specifies how these are arranged.
Top Filter Dimensions
The Top Filter Dimensions is used to specify the top filter dimensions separated by comma. For each hierarchy in the container worksheet intersection, one or more dimensions can be configured for the filter. In the following example, the top filters are Department, Assortment Period, Channel, and Cluster. The two dimensions Channel and Cluster belong to LOC hierarchy and are part of Top Filter.
The top filter acts as a kind of shared page edge. In the RPASCE client, the user chooses a position on each drop-down, and each sub-view is constrained by the selection. The filter sets up an intersection (in this example Women's Casuals/2018 Spring Casuals/A1) that is used to restrict the sub-views. The user's choice here can change the levels used by the sub-views. For example, changing from A1 to Bricks & Mortar changes the intersection from Department/Assortment Period/Cluster to Department/Assortment Period/Channel. Changing the dimension position in the Card Hierarchy displays only those cards that roll up to that dimension position in RPASCE client.
Figure 4-174 Define the Axis Layout of the Worksheet

Description of "Figure 4-174 Define the Axis Layout of the Worksheet"
Define the Axis Layout of the Worksheet
The Axis layout in the Container View is set automatically in the backend, based on configuration for Intersection and Card Hierarchy.
The Container View worksheet contains an axis layout that is similar but not identical to the X-, Y-, and Z-Axis layout schema used by the Pivot worksheets. Like traditional axis layouts, the Container View axis layout requires the hierarchies present in the base intersection of the worksheet to be assigned to one and only one axis.
-
X-Axis –This axis is not assigned in the Container View.
-
Y-Axis –This axis is assigned to the Card hierarchy only and is the axis that corresponds to cards.
-
Z-Axis –All hierarchies present in the base intersection of the worksheet that are not assigned to Y-Axis are assigned to the Z-Axis. This axis is like the Page Axis, or Z-Axis, of the Pivot Table views. Hierarchies assigned to the Page Axis are navigable using a set of controls that page the view as the selected position is modified by the user.
-
Unassigned Axis –As with Pivot Views, there are no valid cases in which hierarchies may be assigned to the Unassigned Axis. This attribute provides information to the user of the Configuration Tools that one or more hierarchies has not yet been assigned to a valid axis and details which hierarchies require axis assignment.
Support for Images, Attributes, and Measures
The Container View can use its sub-views such as Card View to provide a representation of information in which images, attributes, and dimensional measures may all be displayed in a single informational unit. For details, see the Card View configuration section.
Alert Navigation
Neither the Container View nor any of the sub-views may be configured as an Alert Worksheet for Real Time Alerts.
Support for Measure Profiles
Unlike the Pivot worksheet, the Container View configuration itself does not allow users to select measures included in Measure Profiles since the Container View is basically a grouping of sub-views. The sub-views have populated Measure Profiles based on the measure specification, but in the Container View the Viewable Measure Profile, Default Measure Profile, and Selectable Measure Profile are all empty and cannot be changed by user configuration.
Figure 4-175 Workbook Designer Showing a Container View Worksheet

Description of "Figure 4-175 Workbook Designer Showing a Container View Worksheet"
Properties of the Container View Worksheet
Container View Worksheets support a set of properties in the same manner as Pivot/Chart worksheets and Detail Pop-up worksheets. The configuration of these properties is managed through the General Properties tab of the Workbook Designer through a similar table interface used to configure properties for existing worksheet types.
From a configuration standpoint, Container View worksheets are similar to Pivot/Chart worksheets, except for some Pivot/Chart specific properties and optional configuration elements that do not apply to Container View.
The set of configurable properties for the Container View worksheet and summary information on each property can be found in this section.
RPAS Name
The RPAS Name attribute is the internal name used by RPASCE to identify the worksheet. The value of this property must be a valid RPASCE name and is validated according to the rules for RPASCE names.
User Label
The User Label attribute is an external name used to identify the worksheet to the user of the RPASCE Client. The value of this property is displayed within the RPASCE Client for single language applications and is the resource exported for translation in multi-language applications.
Worksheet Type
The worksheet type attribute must be set to Container View in order to configure a Container View worksheet.
Layout Type
The Layout Type determines the visual layout of the container and its sub-views, and potentially the requirements and relationship of the sub-views. Currently, only the DragDropSum Layout Type is supported. This assumes that three views are supplied and are assigned to the layout in from, to, and summary roles.
Worksheets
The Worksheets configuration lists the worksheets in the order in which they are assigned to the position/role of the Layout Type.
Note that the string entered in the Worksheets row must represent the existing worksheets defined in the current workbook, and in the order of Card View, Card View, and Summary View, with the worksheet names separated by a comma.
For example, in Figure 4-175, the string AVAILCP, ASSRTCP, ASUMP is entered for Worksheets, with the worksheets AVAILCP, ASSRTCP, and ASUMP assigned to the from, to, and summary role, respectively. The worksheets AVAILCP and ASSRTCP are Card Views, and ASUMP is a Summary View that has already been defined in the same workbook. If these requirements are not meet, the Worksheet row will be highlighted in red and the validation error will be displayed in the Task List panel.
Intersection
As with Pivot Views, a Container View worksheet has a base intersection. Unlike Pivot View worksheets, which allow some valid intersections for any given view, a Container View requires the base intersection of the worksheet to be identical to the base intersection of its sub-views, especially the Card View worksheets.
Top Filter Dimensions
The Top Filter Dimensions is used to specify the top filter dimensions separated by comma.
Note:
No multiple dimensions along the Card Hierarchy can be specified in the Top Filter Dimensions.
Card Hierarchy
The Card Hierarchy is like the Tile Axis Hierarchy in the Tiled View. The Container View and its sub-views must have an identical Card Hierarchy. In the Container View and its sub-views, the Card Hierarchy is always on the Y-Axis, while the other hierarchies within the worksheet Intersection are on the Z-Axis.
Figure 4-176 General Properties Tab of a Container View Worksheet

Description of "Figure 4-176 General Properties Tab of a Container View Worksheet"
Additional Tabs of the Container View Worksheet
The Container View worksheets support the configuration of additional options through tabs present in the Workbook Designer when a Container View worksheet is loaded into the User Interface. The additional tab supported when working with a Container View worksheet is Position Queries.
Position Queries
The Container View supports the use of Position Queries (PQD). The Position Queries panel of the Container View worksheet behaves in a similar way to the Pivot View worksheets.
The Container View and its sub-views must have the same Position Queries, as they share the Top Filter and must operate seamlessly in concert. Only the Container View shows as Special Filters/Applies to choices, but the grouping is treated as a single entity.
Since all hierarchies of all these views are on the Z-Axis except for the Card Hierarchy and Measures, only the Card dimension effectively serves as the Result dimension of a PQD, driven by choices made in the Top Filter for Z-Axis dimensions.
Top Filter choices use the PQDs that are applicable and enabled to show/hide positions of the Card Dimension. This can:
-
Hide some cards in the Card Views.
-
Restrict the choices available for the Card Dimension in the Top Filter.
Note that, as in all of RPASCE, hiding positions does not exclude them from contributing to rollups. This requires special attention to how the Summary View's measures and rules are designed. While measures can be designed to use the Boolean Card Measure to roll up only values that have been added to the assortment, it will not care whether they are hidden.
It is possible that the PQD will filter the choices available for the Card Dimension in the Top Filter. For example, a PQD could filter out a whole department either directly or by filtering out all its Style/Colors.
Figure 4-177 Position Queries Panel for a Container View Worksheet

Description of "Figure 4-177 Position Queries Panel for a Container View Worksheet"
Defining Worksheet Properties for Worksheets Card View
RPASCE supports the Card View, which is like the Tiled View used in the Fusion Client, with some key differences:
The Card View is used in conjunction with the Top Filter of a Container View. It has no rows or columns or page edge in the UI, only cards. The Top Filter provides the intersection used for the cards, except for the Card Dimension. For the Card Dimension, the Top Filter provides a position at a parent level, and the child positions at the base level of the Card View are used for each card.
RPASCE provides a small number of Card Types that can be used to display the cards. The Card View configuration specifies which Card Type to use and provides the attributes and measures to populate that Card Type. When more than one Card Type is configured, the user can switch between them at will.
Card View Worksheet
The Workbook Designer of the RPASCE Configuration Tools is used in the creation and modification of Card View worksheets. Users of the Configuration Tools are able, by using the Worksheet Type attribute located within the General Properties tab of a worksheet, to set a worksheet from the default of the Pivot/Chart worksheet to the Card worksheet.
Once a worksheet has been set to a Card Worksheet, the Workbook Tool user interface updates to present the user of the Configuration Tools with the options available for Card View worksheets in the same way that it changes when a worksheet is configured to be a Pivot worksheet.
Features of the Card View Worksheet
As mentioned in the overview, the Card View provides an enhanced method for displaying information in comparison to the Tiled View. Additionally, Card Views support other behaviors not found in other view types.
Card Types and Card Definitions
RPASCE supports List, Small, Large, and Image w/Popup card types (the Image w/Popup is to be released in a later version of RPAS CE). The configuration for a Card view enables one or more of these Card Types and provides the associated Card Configuration for each type in the Card Definition optional Tab.
The following sections show examples of each card type.


Image with Pop-up Card Type
Figure 4-183 shows an Image with Pop-up Card type example. This type has no icon.

If more than one card type is enabled for the view, icons display to the right of the view's title bar that the user can use to toggle between them.
In the Assortment example, the Available Styles view uses the List card type, while the Assorted Styles view uses Small and Large.
The Card Definition provides attributes, measures, and translatable strings that are used by the platform's implementation of the Card Type to display the card. Each Card Definition can specify an attribute, up to three read-only measures, up to two editable measures, plus an optional gauge measure and an optional badge measure. All measures referenced here (except Option Attribute) are included in the Viewable Profile of the Card View configuration. The Card Type defines which parts of the Card Definition are used, which are ignored, and which are considered optional.
The configurer can define multiple Card Definitions per Card Type to increase the metrics visible to the user. The order of the definitions is the order in which they appear in the RPASCE Client. The RPASCE client allows the user to switch between the Card Definitions, first by choosing the Label, and then by switching between the Card Types. This capacity allows the grouping together of small sets of key metrics in a meaningful way with meaningful labels.
To change the order of Card Definitions during configuration, select the row of definition that you want to move and use the arrow buttons to the right of the Card Definition pane. Click a single arrow to move it one level up or down in the list. Click the double arrow to move it to the top or bottom of the list.
The number of Card Definition is limited to 12 across all card types per Card View worksheet, in order to keep configurations reasonable.
Here is an example with multiple card types with multiple card definitions.
Figure 4-184 Multiple Card Types with Multiple Card Definitions

Description of "Figure 4-184 Multiple Card Types with Multiple Card Definitions"
Add/Remove and Drag/Drop Behavior
Whether the card has a +, an X, or a Boolean toggle icon in RPASCE UI depends on the view's add/remove/drag/drop configuration.
The Add/Remove and Drag/Drop behavior in RPASCE UI are determined by configuration settings for Card Measure, Card Value, Filter Cards, and Enable Drop.
These are the same settings used in the Fusion Client's Tiled View but are interpreted by the RPASCE UI in its own way. Specifically:
-
Card Value is used to signify whether this is a from (false) or to (true) view, for the purposes of add/remove and drag/drop.
-
Enable Drop is used to enable the Drag/Drop and Add/Remove behavior appropriate for the Card Value.
The Card Measure and Card Intersection are expected to be the same between a from (Available) and a to (Assorted) view.
For the Available Styles as shown in Table 4-5.
Table 4-5 Card Measure and Card Intersection for the Available Styles
| Available | Assorted |
|---|---|
|
Card Measure |
inAssort |
|
Card Value |
False |
|
Filter Cards |
Yes |
|
Enable Drop |
Yes |
Because Filter Cards is on, this view only shows cards where the Card Measure is equal to the Card Value, that is, when inAssort is False.
Because Enable Drop is on and Card Value is False, Cards have an add (+) operation that sets the Card Measure to True. The Card is then filtered out of the Available Style view and shows up in the Assorted Styles view.
Figure 4-185 Add Sets the Card Measure to True

Description of "Figure 4-185 Add Sets the Card Measure to True"
For the Assorted Styles as shown in Table 4-6.
Table 4-6 Card Measure and Card Intersection Assorted Styles
| Available | Assorted |
|---|---|
|
Card Measure |
inAssort |
|
Card Value |
True |
|
Filter Cards |
Yes |
|
Enable Drop |
Yes |
Because Filter Cards is on, this view only shows tiles where the Card Measure is equal to the Card Value, that is, when inAssort is True.
Because Enable Drop is on and Card Value is True, Cards have a remove (X) operation that sets the Card Measure to False. The Card is then filtered out of the Assorted Styles view and shows up in the properly configured Available Styles view.
Figure 4-186 Remove Sets the Card Measure to False

Description of "Figure 4-186 Remove Sets the Card Measure to False"
Because Enable Drop is on and Card Value is True, this view has an add (+) operation that brings up an Figure 4-187.

Figure 4-188 shows Available Styles on List cards.
Figure 4-188 Available Styles on List Cards

Description of "Figure 4-188 Available Styles on List Cards"
When you click OK, the Card Measure is set to True for the selected cards. This window is built using the List Card Type. A Card Definition is configured into the view specifically for Add and is populated by position where the Card Value is False.
Note that all these add and remove operations result in an edit to the Card Measure at the intersection of the visible cards. Like all cell edits, a Calculate is required to aggregate and spread the edit to other levels.
Define the Axis Layout of the Worksheet
The Axis layout in the Card View is set automatically in the backend, based on configurations to Base Intersection and Card Hierarchy.
The Card View worksheet contains an axis layout that is similar but not identical to the X-, Y-, and Z-Axis layout schema used by the Pivot worksheets. Like traditional axis layouts, the Card View axis layout requires that the hierarchies present in the base intersection of the worksheet be assigned to one and only one axis.
-
X-Axis –This axis is assigned to Measure In the Card View.
-
Y-Axis –This axis is assigned to the Card hierarchy only and is the axis that corresponds to cards.
-
Z-Axis –All hierarchies present in the base intersection of the worksheet that are not assigned to the X-Axis or Y-Axis are assigned to the Z-Axis. This axis resembles the Page Axis of the Pivot Table views. Hierarchies assigned to the Page Axis are navigable using a set of controls that page the view as the selected position is modified by the user.
-
Unassigned Axis –As with Pivot Views, there are no valid cases in which hierarchies may be assigned to the Unassigned Axis. This attribute provides information to the user of the Configuration Tools that one or more hierarchies has not yet been assigned to a valid axis and details which hierarchies require axis assignment.
Support for Images, Attributes, and Measures
The Card View supports dimensional attributes by specifically providing an Image Attribute in the General Properties table and Option Attributes in the Card Definition panel. For details, see the Properties of the Card View Worksheet and Card Types and Card Definitions sections.
Support for Measure Profiles
Unlike the Pivot worksheet, the Card View automatically builds Measure Profiles in the backend, based on the user selection of measures in the Card View configuration. The Viewable Measure Profile, Default Measure Profile, and Selectable Measure Profile include Card Measure, Sort Measure, and all measures defined in the Card Definitions. Option and Image Attribute measures are dimensional attribute measures and are not included in the previous Measure Profiles.
Window Formatting
Unlike the Pivot View, the Card View does not have a Window Formatting tab to configure the worksheet style since only the Image and Option Attributes are visible display attributes supported in the Card View. The Card View internally uses an Attribute Profile to automatically track them. Label is always the first visible attribute that displays in the card's header. Image and Option attributes, if supplied, are displayed as dimension attributes in the RPASCE UI.
Figure 4-189 Workbook Designer Showing a Card View Worksheet
Description of "Figure 4-189 Workbook Designer Showing a Card View Worksheet"
Properties of the Card View Worksheet
The Card View Worksheet supports a set of properties in the same manner as the Tiled View worksheets and the Pivot worksheets. The configuration of these properties is managed through the General Properties tab of the Workbook Designer through the same table interface used to configure properties for existing worksheet types.
From a configuration standpoint, the Card View worksheets are very similar to the Tiled View worksheets. The two views share many of the same sets of properties and optional configuration elements (implemented through the various tabs available within the Workbook Designer when a worksheet is selected). However, some Tiled View-specific properties may not be configurable for the Card View. In addition, the Card View worksheets support some additional Card View-specific properties.
The set of configurable properties for the Card View worksheet and summary information on each property can be found in this section.
Figure 4-190 General Properties Tab of a Card View Worksheet

Description of "Figure 4-190 General Properties Tab of a Card View Worksheet"
RPAS Name
The RPAS Name attribute is the internal name used by RPASCE to identify the worksheet. The value of this property must be a valid RPAS CE name and is validated according to the rules for RPASCE names.
User Label
The User Label attribute is an external name used to identify the worksheet to the user of the RPASCE Client. The value of this property is displayed within the RPASCE Client for single language applications and is the resource exported for translation in multi-language applications.
Worksheet Type
The worksheet type attribute must be set to Card View in order to configure a Card View worksheet.
Card Hierarchy
The Card Hierarchy is similar to the Tile Axis Hierarchy in the Tiled View and is set to the Y-Axis in the Card View. The Card View must have the same Card Hierarchy as the Container View and its sub-views.
Sort Measure
The Sort Measure is optional in the Card View. At most, the Card View can specify one single Sort Measure. Users can select the Sort Measure via the pop-up measure selection window, which is pre-limited to numeric measures defined in the workbook rule sets when you click the Sort Measure field.
Sort Descending
The Sort Descending is an optional specification in the Card View. By default, it is set to False. The value of Sort Descending can only be specified when Sort Measure is selected.
Card Measure
The Card Measure is like the Tile Measure in Tiled View. See the Tile Measure in Tiled View for details. Users can select the Card Measure via the pop-up measure selection dialog box, which is pre-limited to Boolean measures defined in the workbook rule sets when clicking the Card Measure field.
The Card Measure's base dimension along the Card Hierarchy is referred to as the Card Dimension.
The default aggregation type of the card measure cannot be ambg. The aggregate value must evaluate to a true or false value for the card filtering functionality to work correctly.
Card Value
The Card Value is by default set to False. Users can use the drop-down list to set the Card Value to either True or False. When used in conjunction with the RPASCE Client drag and drop functionality, the Card Value attribute contains the value to be set into the Card Measure as a part of a drop operation. It must have a value of either True or False to be contained by the Boolean Card Measure.
Group Dimension
The Group Dimension is optional in the Card View. By default, this field is empty. A single Group Dimension may be configured. In RPASCE UI, cards are displayed grouped under their parent Group by dimension option when the Group Dimension is supplied.
Note:
The Card View can be configured with a sort order by specifying the Sort Measure and Sort Descending flag. This acts as the innermost sorting with respect to the configured Group Dimension, if present, and/or a Sort By attribute (a RPASCE UI feature) chosen by the user.
If supplied, the Group Dimension must be a level higher than the Card Dimension and lower than the Container's Top Filter dimension for the Card Hierarchy.
Filter Cards
Check box for Yes or No. This attribute specifies whether the values of the Card Measure are used to drive the filtering of visible intersections within the Card View worksheet. If checked, only intersections for which the Card Measure's value for that card is equal to the configured Card Value will be visible.
Enable Drop
Check box for Yes or No. When Drop is enabled, the worksheet can serve as a drop location.
Image Attribute
The Image Attribute is optional in the Card View. At most, the Card View can specify one single Image Attribute. You can select the Image Attribute measure using the Measure Selection window when you click the Image Measure field. The Image Attribute measures are pre-limited to dimensional attribute measures in the Application where they are String type measures and the UI type is set to media. The Image Attribute must be at the Card Level.
Base Intersection
As with Tiled Views, a Card View worksheet has a base intersection. The Card View worksheet intersection supports the configuration of a base intersection based upon the common base intersection of the measures within the Viewable Measure Profile. The Card View Viewable Measure Profile is automatically built from Card Measure, Sort Measure, and all measures are defined in the Card Definitions (except Option Attributes).
Note:
The Card View base intersection must be identical to the base intersection of the Card Measure. It is recommended to configure the Base Intersection after the Card Definition and the General Table Configuration in the Card View.
Additional Tabs of the Card View Worksheet
The Card View worksheets support the configuration of additional options through the tabs present in the Workbook Designer when a Card View worksheet is loaded into the User Interface. The additional tabs supported when working with a Card View worksheet are:
Card Definition Tab
The Card View worksheets support the ability to configure multiple Card Definitions for each card type. One Card View worksheet may contain one or more card types. The card types are defined inside the Card Definition panel, where each row represents one card type with its specific card definitions.
Here is the list of Card Definition Properties that users can configure:
Name
The RPAS Name attribute is the internal name used by RPASCE to identify the Card Definition. The value of this property must be a valid RPASCE name unique across the application and is validated according to the rules for RPASCE names.
Label
The User Label attribute is an external name used to identify the Card Definition to the user of the RPASCE Client. The value of this property is displayed within the RPASCE Client for single language applications and is the resource exported for translation in multi-language applications. Card Definitions can have duplicate labels.
Card Type
The Card Type attribute must be set to either small, large, list, or imagePopup type in order to configure a Card Definition.
Option Attribute
The Option Attribute is optional in the Card View and will be displayed as a visible attribute in the view if supplied. At most, one Card Type can specify one Option Attribute. Select the Option Attribute measure using the Measure Selection window when you click the Option Attribute field. The Option Attribute measures are pre-limited to dimensional attribute measures in the application. The Option Attribute measure must be at the Card Level.
Badge Measure
The Badge Measure is optional. You can set the badge measure using the Measure Selection window when you click this field. Badge Measures are pre-limited to measures defined in the workbook rule sets.
Measure 1, Measure 2, and Measure 3
Measures 1, 2, and 3 are optional. Users define them based on measures they plan to show in the card. They are pre-limited to measures defined in the workbook rule sets.
Editable Measure 1 and Editable Measure 2
Editable Measures 1 and 2 are optional. Users define them based on measures they plan to edit on the cards. In the assortment example, in the Assorted Styles card view, users can edit the number for the Buy Qty and AUR measures in the large card. In the Card Definition configuration for the large card, Editable Measure 1 is set to the BuyQty measure and Editable Measure 2 is set to the AUR measure. Both Editable Measure 1 and 2 are pre-limited to the measures defined in the workbook rule sets in the pop-up measure selection window.
Gauge Measure
The Gauge Measure is optional. Users define it to represent the gauge. Currently, only the circular percent gauge type is supported. The gauge measure is pre-limited to measures defined in the workbook rule sets.
Figure 4-191 Card Definition Tab for a Card View Worksheet

Description of "Figure 4-191 Card Definition Tab for a Card View Worksheet"
Figure 4-192 Card Definition Tab for a Card View Worksheet

Description of "Figure 4-192 Card Definition Tab for a Card View Worksheet"
Style Overrides
The Card View worksheets support the ability to configure styles for measures displayed within the view (all viewable measures and dimension attributes). The Style Override tab is therefore available when configuring a Card View worksheet, and it functions in the same way as in Pivot and Detail Pop-up Views.
Additionally, it is possible to configure a set of formatting properties that are applied to the card itself in a Card View worksheet. The Style Override panel also includes an entry for the Card Measure, Image Attribute, and Option Attributes. Setting a style for the Card Measure within the Style Override panel will cause the set style to be used for card formatting and not the base configured style of the measure, if a style has been configured for the measure.
Figure 4-193 Style Override Tab for a Card View Worksheet

Description of "Figure 4-193 Style Override Tab for a Card View Worksheet"
Position Queries
The Card View supports the use of Position Queries. The Position Queries panel of the Card View worksheet and the Tiled View worksheets function in the same way.
Note: The Position Queries defined in Card View must be identical to the Position Queries defined in the Container View and its sub-views. See the Position Queries of the Container View for details.
Figure 4-194 Position Queries Tab for a Card View Worksheet

Description of "Figure 4-194 Position Queries Tab for a Card View Worksheet"
Defining Worksheet Properties for the Worksheets Summary View
RPASCE supports the Summary View within the RPASCE Client. This view is used to display a small number of metrics in a relatively standard way with a configured Summary Definition. The Summary View is always used together with the Card View within the Container View.
Summary View Worksheet
The Workbook Designer of the RPASCE Configuration Tools is used for the creation and modification of the Summary View worksheets. Users of the Configuration Tools can, by using the Worksheet Type attribute located within the General Properties tab of a worksheet, set a worksheet from the default of the Pivot/Chart worksheet to the new Summary worksheet.
Once a worksheet has been set as a Summary Worksheet, the Workbook Tool user interface updates and presents the user of the Configuration Tools with the options available for the Summary View worksheets in the same way that it changes when a worksheet is configured to be a Detail Pop-up worksheet.
Features of the Summary View Worksheet
Figure 4-195 shows an example of a Summary View in the RPASCE Client. The view includes Total Metrics and Chart Metrics sections.
The two sections (Total Metrics and Chart Metrics) are all measures shown at the intersection defined by the Container View's Top Filter selections.

Total Metrics
RPASCE supports two measures here, one displayed as a quantity and one as a percentage via gauge. Label strings are also specified, as it is unlikely that the measure label would be ideal in this context. Currently, the gauge is displayed as a circular percent gauge.
Table 4-7 Total Metrics Configuration
| Item | Description |
|---|---|
|
Total Quantity Measure |
Measure |
|
Total Quantity Label |
Translatable String |
|
Total Gauge Measure |
Measure |
|
Total Gauge Label |
Translatable String |
Chart Metrics
RPASCE supports up to four metrics here. Each has a percent, units, and currency variation, for a total of 12 measures. Users can configure translatable strings to use as the labels in this presentation. Each is displayed at the intersection defined by the Top Filter of the container view.
Table 4-8 Chart Metrics Configuration
| Item | Description |
|---|---|
|
Percent Label |
translatable string |
|
Quantity Label |
translatable string |
|
Units Label |
translatable string |
|
Currency Label |
translatable string |
|
Metric 1 Label |
translatable string |
|
Metric 1 Units Measure |
measure |
|
Metric 1 Currency Measure |
measure |
|
Metric 1 Percent Measure |
measure |
|
Metric 2 Label |
translatable string |
|
Metric 2 Units Measure |
measure |
|
Metric 2 Currency Measure |
measure |
|
Metric 2 Percent Measure |
measure |
|
Metric 3 Label |
translatable string |
|
Metric 3 Units Measure |
measure |
|
Metric 3 Currency Measure |
measure |
|
Metric 3 Percent Measure |
measure |
|
Metric 4 Label |
translatable string |
|
Metric 4 Units Measure |
measure |
|
Metric 4 Currency Measure |
measure |
|
Metric 4 Percent Measure |
measure |
|
Units Chart Type |
only horizontal bar available at this time |
|
Currency Chart Type |
only horizontal bar available at this time |
|
Percent Chart Type |
only horizontal bar available at this time |
The Units, Currency, and Percent Metrics are displayed as horizontal bars. The Legend is used for metric labels. In the assortment example, the colors blue, green, and yellow are used to represent Metric 1 (Actual), Metric 2 (Target), and Metric 3 (LY) labels, respectively. The Metric 1 row is not displayed in blue in the example because of chart bar scaling. If switched to Dollars, Metric 1 row will be displayed in blue. The configuration settings listed in Table 4-8 display in the following layout:
Table 4-9 Layout of Configuration Settings
| Quantity Label | Percentage Label |
|---|---|
|
Metric 1 Units or Currency Measure |
Metric 1 Percent Measure |
|
Metric 2 Units or Currency Measure |
Metric 2 Percent Measure |
|
Metric 3 Units or Currency Measure |
Metric 3 Percent Measure |
|
Metric 4 Units or Currency Measure |
Metric 4 Percent Measure |

Support for Images, Attributes, and Measures
The Summary View does not provide a representation of information in which images, attributes, and dimensional measures may all be displayed in a single informational unit.
Define the Axis Layout of the Worksheet
The Axis layout in the Summary View is set automatically in the backend, based on configurations to the Base Intersection and the Card Hierarchy.
The Summary View worksheet contains an axis layout that is similar but not identical to the X-, Y-, and Z-Axis layout schema used by Pivot worksheets. Like traditional axis layouts, the Summary View axis layout requires the hierarchies present in the base intersection of the worksheet to be assigned to one and only one axis.
-
X-Axis –This Axis is assigned to MEASURE in the Summary View.
-
Y-Axis –This Axis is assigned to the Card Hierarchy only and is the axis that corresponds to cards.
-
Z-Axis –All hierarchies present in the base intersection of the worksheet that are not assigned to the X-Axis, Y-Axis are assigned to the Z-Axis. This axis is like the Page Axis of Pivot Table views. Hierarchies assigned to the Page Axis are navigable using a set of controls that page the view as the selected position is modified by the user.
-
Unassigned Axis –As with Pivot Views, there are no valid cases in which hierarchies may be assigned to the Unassigned Axis. This attribute provides information to the user of the Configuration Tools that one or more hierarchies has not yet been assigned to a valid axis and details which hierarchies require axis assignment.
Support for Measure Profiles
Like the Card View worksheet, the Summary View automatically builds the Measure Profiles in the backend, based on measure selection in the Summary Configuration. All measures selected in the Summary Definitions are included in the Viewable Measure Profile, Default Measure Profile, and Selectable Measure Profile.
Figure 4-197 Workbook Designer Showing a Summary View Worksheet

Description of "Figure 4-197 Workbook Designer Showing a Summary View Worksheet"
Properties of the Summary View Worksheet
The Summary View Worksheets support a set of properties in the same manner as the Card View worksheets. The configuration of these properties is managed through the General Properties tab of the Workbook Designer through the same table interface used to configure properties for existing worksheet types.
From a configuration standpoint, the Summary View worksheets are like the Card View worksheets. The two views share many of the same sets of properties and optional configuration elements (implemented through the various tabs available within the Workbook Designer when a worksheet is selected). However, some Card View-specific properties may not be configurable for the Summary View worksheets. In addition, the Summary View worksheets support some additional, Summary View-specific properties.
The set of configurable properties for the Summary View worksheet and summary information on each property can be found in this section.
RPAS Name
The RPAS Name attribute is the internal name used by RPASCE to identify the worksheet. The value of this property must be a valid RPASCE name and is validated according to the rules for RPASCE names.
User Label
The User Label attribute is an external name used to identify the worksheet to the user of the RPASCE Client. The value of this property is displayed within the RPASCE Client for single language applications and is the resource exported for translation in multi-language applications.
Worksheet Type
The worksheet type attribute must be set to the Summary View in order to configure a Summary View worksheet.
Total Quantity Measure
The Total Quantity Measure is pre-limited to numeric measures in the workbook rule sets in the pop-up measure selection window.
Total Quantity Label
The Total Quantity Label is a translatable string entered by users. This label is displayed above the Total Quantity Measure value in the view. In the assortment example, Total Budget is configured.
Total Gauge Measure
The Total Gauge Measure is a measure that is displayed as a circular percent gauge in the RPASCE client. Users can select the Total Gauge Measure via the pop-up measure selection window, which is populated with numeric measures defined in the workbook rule sets.
Total Gauge Label
The Total Quantity Label is a translatable string entered by users. This label is displayed above the Total Gauge Measure value in the view. In the assortment example, % to Budget is configured.
Percent Label
The Percent Label is a translatable string entered by users. This label is displayed above the Percent Metric column in the view. In the assortment example, this label is configured to be Margin %.
Quantity Label
The Quantity Label is a translatable string entered by users. This label is displayed above the Units/Currency Metric column in the view. In the assortment example, this label is configured to be Receipts.
Units Label
The Units Label is a translatable string entered by users. This label is displayed at the bottom of the Units/Currency Metric column in the view. In the assortment example, this label is configured to be Units.
Currency Label
The Currency Label is a translatable string entered by users. This label is displayed at the bottom of the Units/Currency Metric column in the view. In the assortment example, this label is configured to be Dollars.
Metric 1 Units Measure
The Metric 1 Units Measure is displayed in the first row, first column of the Chart Metrics section if the Units Label, for example, Units, is selected. Users can set it via the pop-up measure selection window, which is populated with numeric measures defined in the workbook rule sets.
Metric 1 Currency Measure
The Metric 1 Currency Measure is displayed in the first row, first column of the Chart Metrics section if the Currency Label, for example, Dollars, is selected. Users can set it via the pop-up measure selection window, which is populated with numeric measures defined in the workbook rule sets.
Metric 1 Percent Measure
The Metric 1 Percent Measure is displayed in the first row, second column of the Chart Metrics section, under the Percent Label. Users can set it via the pop-up measure selection window, which is populated with numeric measures defined in the workbook rule sets.
Metric 1 Label
The Metric 1 Label is a translatable string entered by users. This label is used to set the label legend in the view. In the assortment example, this label is configured to be Actual and the legend indicates that the first row is displayed as blue if the chart bar scaling allows.
Metric 2 Units Measure
The Metric 2 Units Measure is displayed in the second row, first column of the Chart Metrics section if the Units Label, for example, Units, is selected. Users can set it via the pop-up measure selection window, which is populated with numeric measures defined in the workbook rule sets.
Metric 2 Currency Measure
The Metric 2 Currency Measure is displayed in the second row, first column of the Chart Metrics section if the Currency Label, for example, Dollars, is selected. Users can set it via the pop-up measure selection window, which is populated with numeric measures defined in the workbook rule sets.
Metric 2 Percent Measure
The Metric 2 Percent Measure is displayed in the second row, second column of the Chart Metrics section. Users can set it via the pop-up measure selection window, which is populated with numeric measures defined in the workbook rule sets.
Metric 2 Label
The Metric 2 Label is a translatable string entered by users. This label is used to set the label legend in the view. In the assortment example, this label is configured to be Target and the legend indicates that the second row must be displayed as green if the chart bar scaling allows.
Metric 3 Units Measure
The Metric 3 Units Measure is displayed in the third row, first column of the Chart Metrics section if the Units Label, for example, Units, is selected. Users can set it via the pop-up measure selection window, which is populated with numeric measures defined in the workbook rule sets.
Metric 3 Currency Measure
The Metric 3 Currency Measure is displayed in the third row, first column of the Chart Metrics section if the Currency Label, for example, Dollars, is selected. Users can set it via the pop-up measure selection window, which is populated with numeric measures defined in the workbook rule sets.
Metric 3 Percent Measure
The Metric 3 Percent Measure is displayed in the third row, second column of the Chart Metrics section. Users can set it via the pop-up measure selection window, which is populated with numeric measures defined in the workbook rule sets.
Metric 3 Label
The Metric 3 Label is a translatable string entered by users. This label is used to set the label legend in the view. In the assortment example, this label is configured to be LY and the legend indicates that the second row must be displayed as yellow if the chart bar scaling allows.
Metric 4 Units Measure
The Metric 4 Units Measure is displayed in the fourth row, first column of the Chart Metrics section if the Units Label, for example, Units, is selected. Users can set it via the pop-up measure selection window, which is populated with numeric measures defined in the workbook rule sets.
Metric 4 Currency Measure
The Metric 4 Currency Measure is displayed in the fourth row, first column of the Chart Metrics section if the Currency Label, for example, Dollars, is selected. Users can set it via the pop-up measure selection window, which is populated with numeric measures defined in the workbook rule sets.
Metric 4 Percent Measure
The Metric 4 Percent Measure is displayed in the fourth row, second column of the Chart Metrics section. Users can set it via the pop-up measure selection window, which is populated with numeric measures defined in the workbook rule sets.
Metric 4 Label
The Metric 4 Label is a translatable string entered by users. This label is used to set the label legend in the view.
Note:
Up to four Chart Metrics can be configured. If one metric definition is not completely provided, that is, if either the Units Measure, Currency Measure, Percent Measure, or Label is not defined by users, then this chart metric row will not be displayed in the RPASCE Client.
Card Hierarchy
The Card Hierarchy is like the Card Hierarchy in the Card View and is set to the Y-Axis in the Summary View. The Summary View must have the same Card Hierarchy as the Container View and its other sub-views.
Base Intersection
As with the Card View, a Summary View worksheet has a base intersection. The Summary View worksheet intersection supports the configuration of a base intersection based upon the common base intersection of the measures within the Viewable Measure Profile. The Summary View Viewable Measure Profile is automatically built from all measures selected in the Summary definition.
Note:
The Summary View base intersection must be identical to the base intersection of the Container View and Card Views. The Base Intersection must be set after all necessary measures have been defined for the Summary Definition.
The other properties in the General Properties table such as Attribute Dimensions, Metric A1 Measure, Metric A1 Label, Metric A2 Measure, Metric A2 Label, Metric A3 Measure, Metric A3 Label, Metric A4 Measure, and Metric A4 Label are reserved for Attribute Summary metrics, which are to be supported in later releases.
Additional Tabs of the Summary View Worksheet
The Summary View worksheets support the configuration of additional options through tabs present in the Workbook Designer when a Summary View worksheet is loaded into the User Interface. The additional tabs supported when working with a Summary View worksheet are:
Style Overrides
The Summary View worksheets are used to configure styles for measures displayed within the view. The Style Override tab is available when configuring a Summary View worksheet and it functions in the same way as in the Pivot and Detail Pop-up Views.
Figure 4-198 Style Override Tab for a Summary View Worksheet Showing Summary Measures

Description of "Figure 4-198 Style Override Tab for a Summary View Worksheet Showing Summary Measures"
Position Queries
The Summary View does support the use of Position Queries. The Position Queries panel of the Summary View worksheet functions in the same way as the Pivot View worksheets.
Note:
If Position Queries are defined for the Summary View, they must be identical to the Position Queries defined in the Container View and Card Views. See the Position Queries of Container View for details.
Figure 4-199 Position Queries Tab for a Summary View Worksheet

Description of "Figure 4-199 Position Queries Tab for a Summary View Worksheet"
Specifying Which Measures Display in a Worksheet
Complete the following steps to specify which measures display in a worksheet.
Navigate: In the Configuration Components pane, select Project then Solution, and then Workbooks. The Figure 4-200 opens in the workspace.

-
Select the worksheet to be used to specify measures.
-
Select the profile to be used to specify measures. When the user has specified multiple profiles for a worksheet using the Measure Profiles tab, each of these profiles may have a different set of measures defined for it. In cases where there is more than one configured profile, one profile is used as the Selected profile. It is this profile that will have its measure content modified through interaction within the Profile Panel. When there are multiple configured profiles for a worksheet, the profile that is currently Selected may be changed using the drop-down list in the upper right of the Profile Panel.
-
In the column that displays measure components (under Include External Measures), select the check boxes next to the Measure components. The matching measures display in the Matching Measures column as the components are selected. Only realized measures that are used in the rule set that is assigned to the selected workbook display.
-
If External Measures are to be available for placement on the worksheet, select the Include External Measures check box.
-
To add measures from the matching measures column to the Viewable or Selected columns, do one of the following options:
-
Select the measures to add from the Matching Measures column. Drag the measures to the Viewable or Selected column.
-
Select the measures to add from the Matching Measures column and press Ctrl+C, and then click in the Viewable or Selected column and press Ctrl+V.
-
Right-click in the Matching Measures column and select Copy, and then select Paste from the right-click menu in the Viewable or Selected column.
-
To add all measures from the Matching Measures column, right-click in the Viewable or Selected column and select Add Matching from the menu.
-
-
To add measures from the Viewable column to the Selected column, do one of the following options:
-
Select measures in the Viewable column and drag the measures to the Selected column.
-
Select measures in the Viewable column and press Ctrl+C, and then click in the Selected column and press Ctrl+V.
-
Right-click in the Viewable column and select Copy. Right-click in the Selected column and select Paste.
Note:
Adding a measure to the Selected column also adds it to the Viewable column if it is not already in the Viewable column.
-
-
To remove measures from the Viewable or Selected columns: do one of the following options:
-
Select the measures to remove and press Delete or Ctrl+X, or right-click and select Cut.
-
Right-click and select Remove Matching to remove all measures that are also in the Matching Measures column or select Remove All to remove all measures.
Note:
Removing a measure from the Viewable column also removes it from all profiles in the Selected column.
-
Specify the Sequence of Measures on a Worksheet
Complete the following steps to specify the sequence of measures on a worksheet.
Navigate: In the Configuration Components pane, select Project then Solution, and then Workbooks. The Figure 4-200 opens in the workspace.
-
Select the worksheet that will be used to sequence measures.
-
To sequence measures manually, drag and drop the measures from the Viewable column to the Selected column.
Figure 4-201 Viewable Column to Selected Column

Description of "Figure 4-201 Viewable Column to Selected Column" -
To sort the measures:
-
Right-click and select Sort in the Selected column. The Figure 4-202 opens.
Note:
Sorting measures are based on the internal component name (not the label).
-
Measures can be sorted based on their major components. Select the sort sequence in which the major components are to be applied, and whether the sort should be ascending or descending
-
Click Apply.
The measures are sorted into the specified sequence. This is a one-time sort. If new measures are added to the Selected column, or measures are manually sequenced, the sort sequence previously specified will no longer apply. You would need to resort the measures again.
-

Edit Worksheet Properties
Complete the following steps to specify the sequence of measures on a worksheet.
Navigate: In the Configuration Components pane, select Project then Solution, and then Workbooks. The Figure 4-200 opens in the workspace.
-
Click the worksheet to edit.
-
Update the information as appropriate.
-
To remove information from the Position Queries table:
-
Select the field.
-
Right-click and select Remove.
-