5 Tracking Business Flow Instances
This chapter includes the following section:
For more information about business flow instances and differences between instances in 12c and 11g, see Introduction to Business Flow Instances.
For information about managing faults on the Error Hospital page, see Recovering From Faults in the Error Hospital.
Tracking Business Flow Instances at the SOA Infrastructure or SOA Folder Level
You can track the instances of business flows from the Flow Instances page of the SOA Infrastructure, individual SOA folder, or individual SOA composite application. A business flow instance corresponds to an end-to-end business transaction. Business flows consist of a single SOA composite application or multiple SOA composite applications connected together to fulfill a specific business process.
Tracking business flow instances enables you to identify the following:
-
Determine what happened to a specific request
-
Has the request been received?
-
Has request processing completed or is it still in progress?
-
If processing has finished, has it completed successfully or did errors occur?
-
If processing is still in progress, is it stuck on an external request, awaiting a scheduled recovery, or in need of any administrative action?
-
-
Analyze and resolve a large number of failures
For example, a runtime failure of a back end service (such as a database) has occurred. In high volume systems, a very large number of faults can occur in a short duration because of a single cause. These faults may be spread across SOA composite applications.You can identify the following under these circumstances:
-
Determine the root cause of the failure (typically done by analyzing one or two individual instances).
-
Find the number of requests with the same root cause of failure across different SOA composite applications.
-
Apply a bulk recovery/termination action to all instances with the same root cause of failure and recovery status (for example, a BPEL recovery or EDN recovery).
-
Specify a batch size.
-
Optionally perform a quick purge to remove the faults that have been handled or abort faults so that the next batch can be addressed.
-
You can manage business flow instances from the Flow Instances and Error Hospital pages at the following levels:
-
SOA Infrastructure level (provides access to all SOA folders)
-
Individual SOA folder level
Note:
You can also manage business flow instances from the Flow Instances page of an individual SOA composite application. Flows that are initiated by a particular composite or passing through a composite are listed at the composite level. There are separate filter criteria for each. There is no Error Hospital page at the individual SOA composite application level. For information, see Tracking Business Flow Instances at the SOA Composite Application Level.
You can configure your environment to provide some administrators with access to the top level SOA Infrastructure Flow Instances and Error Hospital pages and other administrators with access to only the individual SOA folder's Flow Instances and Error Hospital pages. For more information, see Managing SOA Folders and Work Manager Groups.
Access the Flow Instances page through one of the following options:
To access business flow instances in all SOA folders:
| From the SOA Infrastructure Menu... | From the SOA Folder in the Navigator... | From the SOA Composite Menu... |
|---|---|---|
|
|
|
To access business flow instances in an individual SOA folder:
| From the SOA Infrastructure Menu... | From the SOA Folder in the Navigator... |
|---|---|
|
|
To access business flow instances for an individual SOA composite application, see Tracking Business Flow Instances at the SOA Composite Application Level.
The Flow Instances page displays the following details:
-
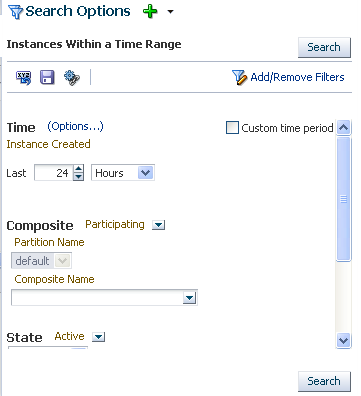
A utility for specifying and saving comprehensive instance and fault search criteria and clicking Search.
Note:
When you initially access the Flow Instances page, the Search Results table is empty. You must click Search to populate this table with business flow instance details.
-
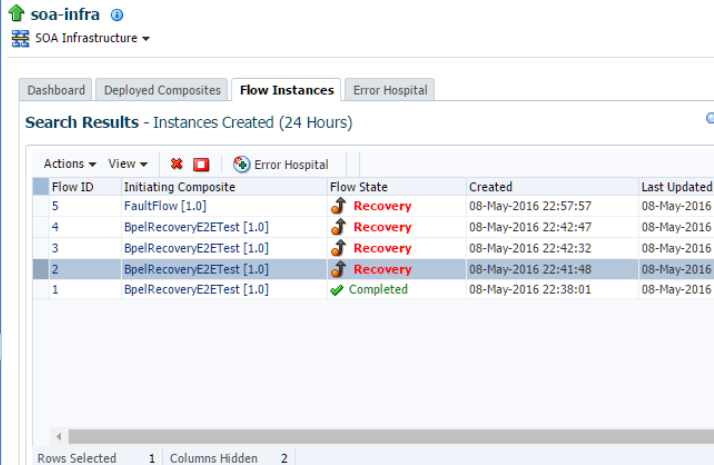
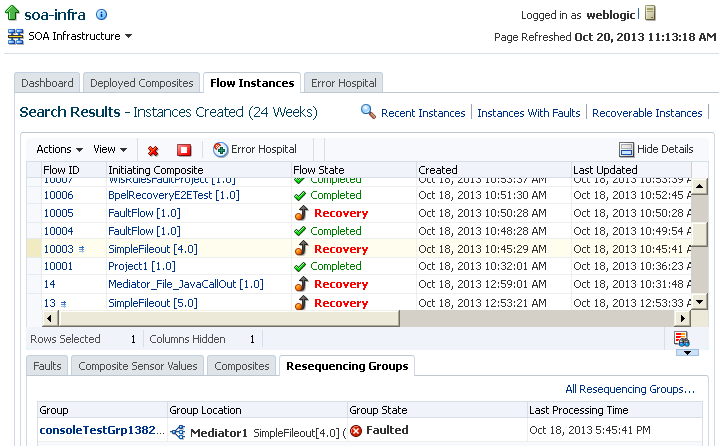
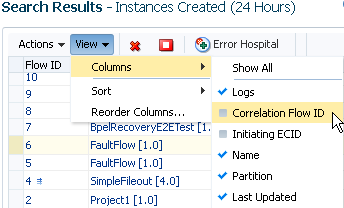
A Search Results table that displays the flow ID that uniquely identifies a business flow, the composite initiating the business flow (business flows can span multiple composites), the state of the flow instance (for example, completed successfully, running, failed, recovery required, and so on), the instance start time, the last update to the instance, the SOA folder in which this flow was initiated, the flow instance name (if set during design time in a BPEL process or Oracle Mediator service component), and a link to the log files. To display additional columns in the table, select View > Columns.
-
An Error Hospital button above the Search Results table that takes you to the Error Hospital page for a view of the results of the search criteria you executed on the Flow Instances page. This action does not require you to select any rows in the Search Results table. Use this option to view the error report for the flow instances currently displayed in the Flow Instances page. In the Error Hospital page, you can view aggregated fault statistics for these instances. You can also perform bulk recover and bulk abort operations on these flow instances without having to access each individual instance.
Note:
-
Business flow instances and faults data is delimited by the time period for which instances and faults are retrieved. The current delimiter is displayed to the right of the Search Results table title. The default value is 24 hours. You can change this value with the Default Query Duration property on the SOA Infrastructure Common Properties page. For information, see Configuring the Audit Trail, Payload Validation, and Default Query Duration.
-
When you undeploy and redeploy the same SOA composite application, you cannot retrieve the business flow instances created prior to composite undeployment. The business flows are still available. However, the active instances are aborted or they are untouched based on your configuration while redeploying. For more information, see Redeploying SOA Composite Applications.
You can perform the following business flow instance tasks:
Specifying and Saving Business Flow Search Criteria
The Search Options section enables you to specify and save comprehensive instance and fault search criteria. Search criteria results are displayed in the Search Results table. Saved search criteria are user-specific, and are not common across users. Each Oracle Enterprise Manager Fusion Middleware Control user can save their own preferred searches. Upon creation, saved searches are displayed on the Dashboard page and also as links on the Error Hospital and Flow Instances pages.
To specify and save business flow search criteria:
Executing Predefined Business Flow Instance Searches
You can quickly find business flows without entering any search criteria by selecting a predefined search option. Results are displayed in the Search Results table. The searches are constrained by a predefined time period. The default time period is 24 hours. This value can be changed by modifying the Default Query Duration property in the SOA Infrastructure Common Properties page, accessible under SOA Administration in the SOA Infrastructure menu.
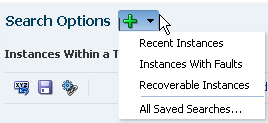
The following options are available:
-
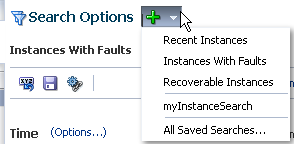
Recent Instances: Displays recent instances.
-
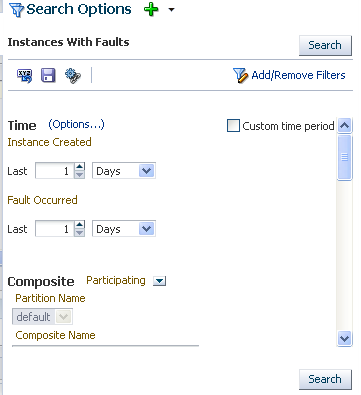
Instances With Faults: Displays recent instances that have faults. This predefined search option is also available on the Error Hospital page, where you can select it from the Report Filters list.
-
Recoverable Instances: Displays recent instances awaiting recovery.
At the top of the Search Options section, select the option for which to search.
or:
The search results are displayed in the Search Results table (for this example, the search results for the Recoverable Instances option are displayed).
For more information about executing predefined searches, select Help > Help for This Page from the weblogic main menu on the Flow Instances page.
For information about saved searches, see Using the Search Options Toolbar.
Using the Search Options Toolbar
The Search Options toolbar enables you to perform search-related tasks, such as executing predefined or custom searches, saving search criteria, resetting displayed search criteria, bookmarking searches, and adding and removing filters. By default, only predefined searches can be invoked. You can extend the list of available searches by saving custom searches. The Search Options toolbar displays in a sliding panel and may not be visible on the page at all times. If not already open, you can invoke it by clicking the large Search Options icon.
Go the toolbar in the Search Options section.
The following options are available.
| Element | Description |
|---|---|
|
|
Click to reset the search fields in the currently invoked saved search to the last saved values. This is useful when you have modified a saved search and want to restart the query building process. |
|
|
Click to save your current search criteria. This saves both the selected search fields and their values, enabling you to run the identical search at a later time and view a fresh set of results. You must provide a name when saving a search. You cannot overwrite an existing saved search, but you can save it with a different name. You can delete the saved searches you created. To manage your saved searches, select All Saved Searches from the Search Options list. |
|
|
Click to bookmark your current search criteria. A message is displayed with a URL containing the search parameters. Copy the URL to a browser bookmark window, email, or chat. The generated URL includes information about both the selected search fields and their values. This enables you to run the identical search at a later time and view a fresh set of results. |
For more information about the Search Options toolbar, select Help > Help for This Page from the weblogic main menu on the Flow Instances page.
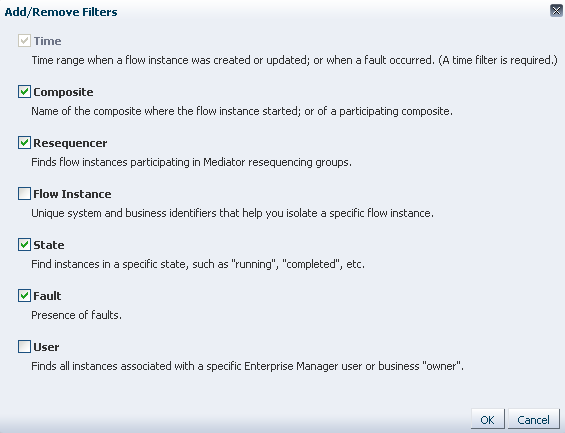
Adding and Removing Search Filters
You can add and remove the search filters that are displayed for configuration. Filters are the attributes of a business flow that you can use to create your search criteria. After selecting a filter, you can customize it in the Search Options section. All filters with specified search criteria are added together (treated as logical AND values) when the resulting query is run. Empty fields are ignored.
Configuring and Saving Business Flow Instance Search Filter Criteria
You can configure parameters for each search filter selected in Adding and Removing Search Filters to create a business flow instances search query. Search results are displayed in the Search Results table.
Deleting or Terminating Business Flow Instances
You can delete or abort business flow instances in the Search Results table.
Note:
If you selected a running instance, the Abort option is available for stopping a running instance.
Viewing the Current State of the Business Flow Instance
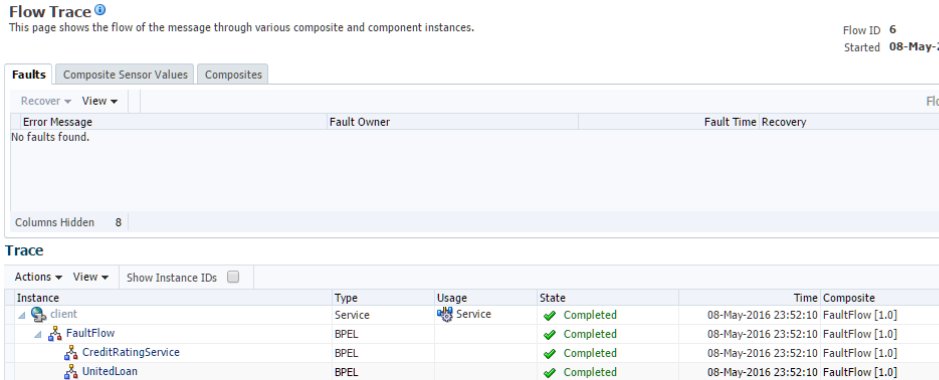
You can view the components that comprise the business flow instance. Business flows can consist of multiple SOA composite applications connected together in a flow.
Note:
If you invoke an Oracle SOA Suite Release 12c direct binding service from Oracle Service Bus Release 11g (releases 11.1.1.4 through 11.1.1.7), no entry is displayed in the Trace table of the Flow Trace page in Oracle Enterprise Manager Fusion Middleware Control Release 12c that shows the direct binding service getting invoked from Oracle Service Bus. The display of this type of invocation is not supported.
In Oracle SOA Suite Release 12c, direct binding service invocation from Oracle Service Bus Release 12c is displayed in the Trace table of the Flow Trace page in Oracle Enterprise Manager Fusion Middleware Control.
A direct binding service is also displayed in a flow with Oracle Enterprise Scheduler or Oracle Service Bus at the start or middle of the flow.
Recovering from Faults in a Business Flow Instance
You can recover from faults identified as recoverable in the selected business flow.
-
Specify search criteria in the Search Options section as described in Configuring and Saving Business Flow Instance Search Filter Criteria, and click Search.
The Search Results table is populated with business flow instances.
-
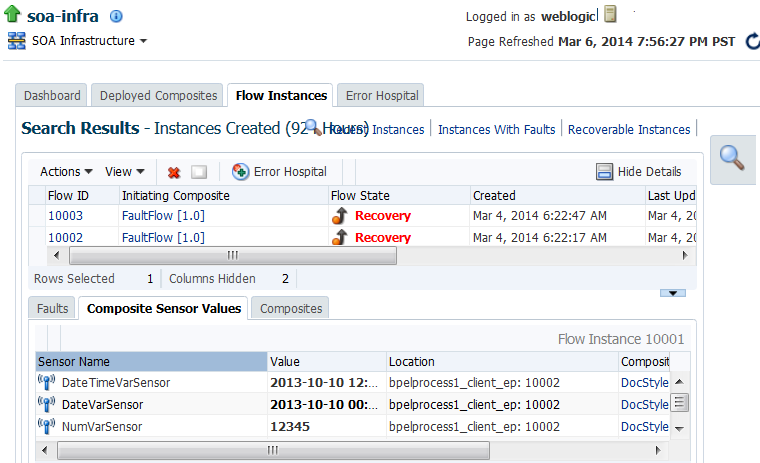
In the Search Results table, identify instances with faults labeled as Recovery in the Flow State column. Faults in this state are awaiting recovery.
-
Select the business flow instance, and click Show Details.
The Faults tab is displayed below the Search Results table. This tab displays the error message, the fault owner (the service component, service binding component, or reference binding component in which the fault was handled), the composite in which the fault occurred, the time of the fault, if the fault is recoverable, and links to the fault logs. To display additional columns, select View > Columns. Select Reset Columns to remove all customizations such reordering columns and showing and hiding columns on the Faults table.
-
In the Error Message column, place your cursor over the error message to display the entire error message or click the red fault icon to display a popup dialog from which to copy the message. You can also place your cursor over the link or icon in the Recovery column to see what type of recovery is required.
-
Select a method for performing fault recovery. Either method enables you to automatically perform a recovery or perform a recovery through human intervention. This human intervention action is defined with the
ora-human-interventionaction in thefault-policies.xmlfile that you designed in Oracle JDeveloper. -
Select the row in the table on which to perform fault recovery.
-
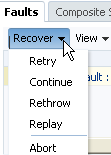
From the Recover list above the table, select a fault recovery action to perform. The Retry and Abort options are available for all recoverable faults. The Continue, Rethrow, and Replay options depend upon the contents of the fault policy file attached to the SOA composite application.
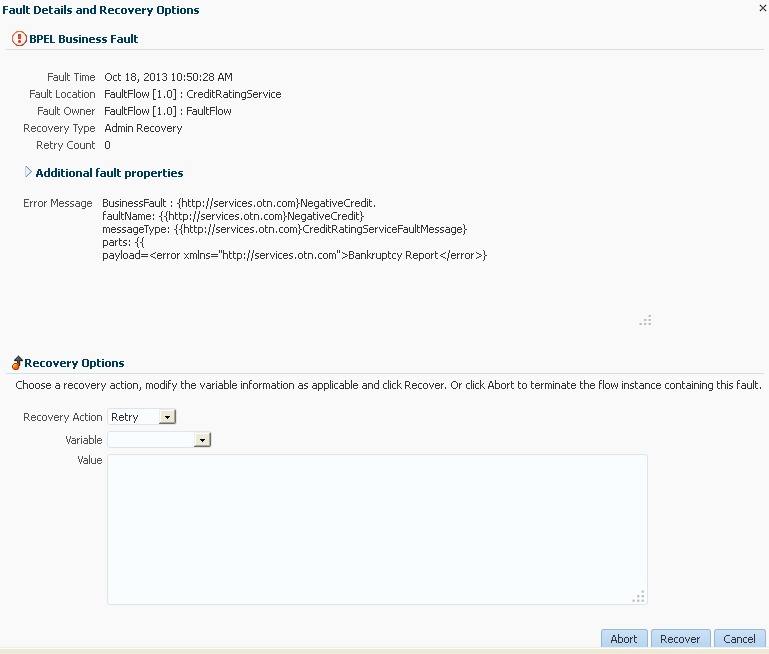
The Fault Details and Recovery Options dialog is displayed.
-
Go to Step 8.
-
-
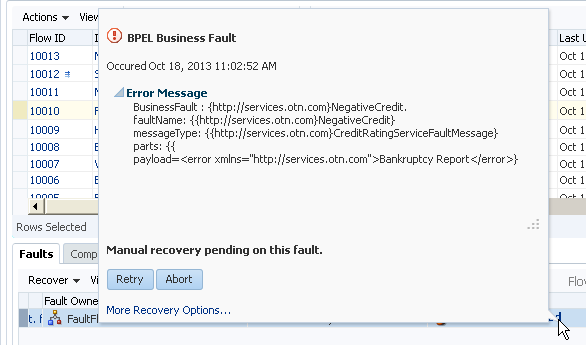
In the Recovery column, click the Recovery Required message.
A dialog describing the fault is displayed.
-
Click Retry or Abort to automatically retry or abort the fault or click More Recovery Options to perform human intervention.
If automatic recovery is successful, the flow in the Search Results table of the Flow Instances page is refreshed to display a different flow state (for example, recovery is changed to completed). In some cases, there may be a delay in getting the updated state and consequently the display does not show the changed state. However, in all cases, a confirmation message is displayed that indicates that the recovery request was sent. Perform an explicit page level refresh either on the button at the fault level or the Refresh button at the page level.
If you clicked More Recovery Options, the Fault Details and Recovery Options dialog is displayed.
-
Go to Step 8.
-
-
In the Recovery Options section of the Fault Details and Recovery Options dialog, view the options for performing fault recovery. Other recovery types such as BPEL message recovery show different sets of options. Any type of fault can be recovered from this console, such as fault policy-triggered recovery and BPEL invoke, callback, and activity message recovery. As with Release 11g, you can also browse to the BPEL process service engine Recovery tab and perform invoke, callback, and activity recovery.
-
From the Recovery Action list, select an action to perform.
Action Description Action is Available for... Abort
Terminates the entire instance.
BPEL process and Oracle Mediator
Retry
Retries the instance directly. An example of a scenario in which to use this recovery action is when the fault occurred because the service provider was not reachable due to a network error. The network error is now resolved.
BPEL process and Oracle Mediator
Continue
Ignores the fault and continues processing (marks the faulted activity as a success).
BPEL process
Rethrow
Rethrows the current fault. BPEL fault handlers (catch branches) are used to handle the fault. By default, all exceptions are caught by the fault management framework unless an explicit rethrow fault policy is provided.
BPEL process
Replay
Replays the entire scope again in which the fault occurred.
BPEL process
-
From the Variable list, select a variable. The content of this variable is displayed in the Value field. For this example, the variable crInput is selected. This variable is used in an invoke activity and contains an incorrect social security number value.
-
Enter the correct value in the Value field. For this example, the social security number is edited to begin with
1. -
Click Recover.
For information about designing a fault policy, see Section "Handling Faults with the Fault Management Framework" of Developing SOA Applications with Oracle SOA Suite.
Viewing Composite Sensor Values in a Business Flow Instance
The Composite Sensor Values tab displays the values of composite sensors detected in the selected business flow. Composite sensors provide a method for implementing trackable fields on messages. Composite sensors may be included in the service and reference binding components of the SOA composite application associated with the flow. This tab only has data displayed if the sensors are defined for the composite and the values captured by the selected business flow are not null.
Viewing the Initiating and Participating SOA Composite Applications in a Business Flow Instance
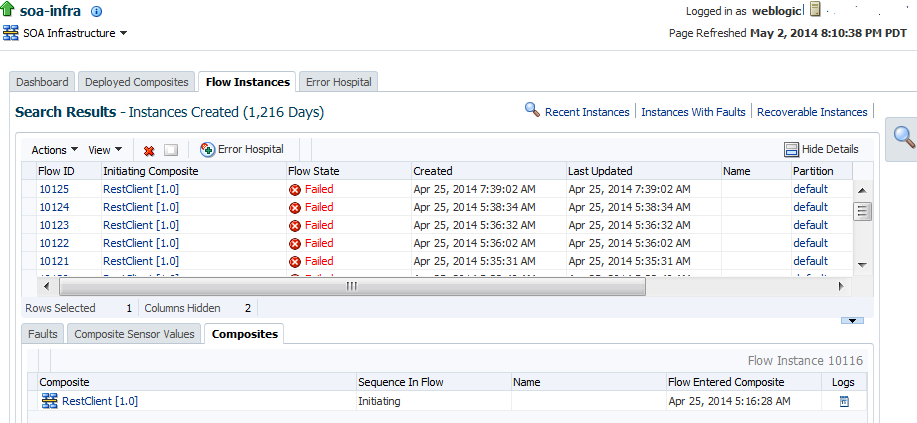
You can view all the SOA composite applications participating in a business flow instance. This tab displays a list of the composites that are associated with this flow, their sequence in the flow (the composite that initiated the business flow and all subsequent composites that participated in the business flow), the time at which a flow entered the specific composite, and links to logs.
To view the initiating and participating composites in a business flow instance:
Viewing Resequencing Groups in a Business Flow Instance
The Resequencing Groups tab is only displayed if a resequenced component participated in the flow. Such a flow instance is indicated by a small triple-arrow icon. The resequencer in Oracle Mediator rearranges a stream of related but out-of-sequence messages into a sequential order. The groups are ordered by the last processing time (most recent first). Alternatively, you can reorder them by the group name or state.
You cannot select the rows in the table or perform any actions under the Resequencing Groups tab on the Flow Instances page.
For more information, see Monitoring Resequencing Groups.
Viewing Business Flows that Extend Across Domains
A flow correlation ID is a GUID value that uniquely identifies a business flow that extends across domains. The flow correlation ID differs from the flow ID, which uniquely identifies a business flow within an Oracle SOA Suite domain. A business flow that crosses two Oracle SOA Suite domains has a single flow correlation ID and two flow IDs. Similarly, a business flow that originates outside of Oracle SOA Suite cannot create a flow ID because it does not have access to the Oracle SOA Suite schema. However, it can create a flow correlation ID.
To view business flows that extend across domains:
Folder-Level and Composite-Level Search Results for Redeployed Composites with the Same Revision Number
A SOA folder-specific search shows all versions of a SOA composite application (even those that were redeployed with the same revision number), whereas a composite-specific search shows only the versions of the current deployment. Because the revision numbers do not change, it is not possible to determine which row in the Search Results table of the Flow Instances page belongs to which version. This can be confusing when it appears in the SOA folder-level search, but not in the composite-level search. To prevent this situation, increment the revision number between deployments. This makes multiple deployments more evident.
For example, assume you perform the following steps:
- Deploy composite A and create several instances. Both a composite-specific search and a SOA folder-specific search show these instances.
- Redeploy and overwrite composite A and create instances. The composite-specific search shows instances from the first revision in addition to the latest version. A SOA folder-specific search shows instances from the first revision in addition to the latest version.
- Undeploy and redeploy composite A and create instances. The composite-specific search only shows instances from the latest version. The SOA folder-specific search shows all instances from the first and second versions in addition to the existing version.

