Using JavaFX Charts
4 Area Chart
This chapter describes the area chart, yet another type of a two-axis chart.
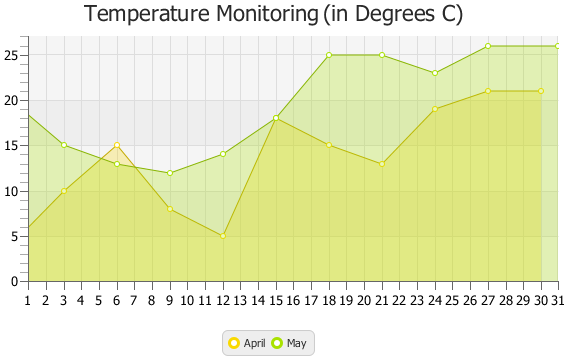
Similar to line charts, it presents data as a series of points connected by straight lines. However, the area between the axis and the line is painted with color. Each series of data is painted with a different color. Figure 4-1 shows an area chart with two series of data.
Creating an Area Chart
To create a simple area chart in your application, at minimum, you must define two axes, create the AreaChart object by instantiating the AreaChart class, create one or more series of data by using the XYChart.Series class, and assign the data to the chart.
When instantiating the AreaChart class, you can specify the observable list with a series of data within a constructor, or add the series later by calling the getData and addAll methods on the AreaChart object.
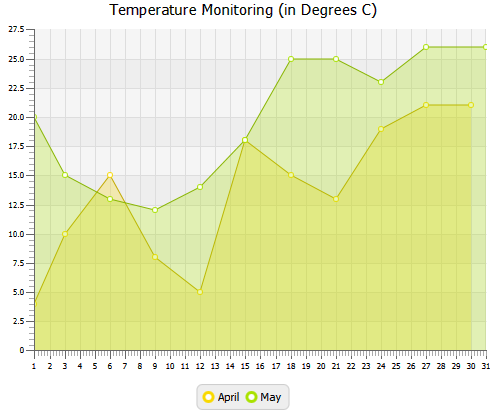
Example 4-1 creates an area chart to illustrate temperature monitoring data. The example uses two series of data collected for the periods of April and May.
Example 4-1 Creating an Area Chart
import javafx.application.Application;
import javafx.scene.Scene;
import javafx.scene.chart.AreaChart;
import javafx.scene.chart.NumberAxis;
import javafx.scene.chart.XYChart;
import javafx.stage.Stage;


public class AreaChartSample extends Application {

    @Override public void start(Stage stage) {
        stage.setTitle("Area Chart Sample");
        final NumberAxis xAxis = new NumberAxis(1, 31, 1);
        final NumberAxis yAxis = new NumberAxis();
        final AreaChart<Number,Number> ac =
            new AreaChart<Number,Number>(xAxis,yAxis);
        ac.setTitle("Temperature Monitoring (in Degrees C)");

        XYChart.Series seriesApril= new XYChart.Series();
        seriesApril.setName("April");
        seriesApril.getData().add(new XYChart.Data(1, 4));
        seriesApril.getData().add(new XYChart.Data(3, 10));
        seriesApril.getData().add(new XYChart.Data(6, 15));
        seriesApril.getData().add(new XYChart.Data(9, 8));
        seriesApril.getData().add(new XYChart.Data(12, 5));
        seriesApril.getData().add(new XYChart.Data(15, 18));
        seriesApril.getData().add(new XYChart.Data(18, 15));
        seriesApril.getData().add(new XYChart.Data(21, 13));
        seriesApril.getData().add(new XYChart.Data(24, 19));
        seriesApril.getData().add(new XYChart.Data(27, 21));
        seriesApril.getData().add(new XYChart.Data(30, 21));

        XYChart.Series seriesMay = new XYChart.Series();
        seriesMay.setName("May");
        seriesMay.getData().add(new XYChart.Data(1, 20));
        seriesMay.getData().add(new XYChart.Data(3, 15));
        seriesMay.getData().add(new XYChart.Data(6, 13));
        seriesMay.getData().add(new XYChart.Data(9, 12));
        seriesMay.getData().add(new XYChart.Data(12, 14));
        seriesMay.getData().add(new XYChart.Data(15, 18));
        seriesMay.getData().add(new XYChart.Data(18, 25));
        seriesMay.getData().add(new XYChart.Data(21, 25));
        seriesMay.getData().add(new XYChart.Data(24, 23));
        seriesMay.getData().add(new XYChart.Data(27, 26));
        seriesMay.getData().add(new XYChart.Data(31, 26));

        Scene scene  = new Scene(ac,800,600);
        ac.getData().addAll(seriesApril, seriesMay);
        stage.setScene(scene);
        stage.show();
    }

    public static void main(String[] args) {
        launch(args);
    }
}
This example creates two NumberAxis objects to present numerical data on horizontal and vertical axes. Values rendered on the horizontal axis (X) are retrieved from the first parameter of the XYChart.Data objects, whereas the second parameter provides data for the vertical axis (Y).
The series of data is assigned to the chart by using the getData and addAll methods. Because the seriesMay data is added last, the corresponding green area overlays the yellow area that shows April data.
The result of compiling and running the application, is shown in Figure 4-2.
Figure 4-2 Area Chart with Two Series of Data
Description of "Figure 4-2 Area Chart with Two Series of Data"
Creating a Stacked Area Chart
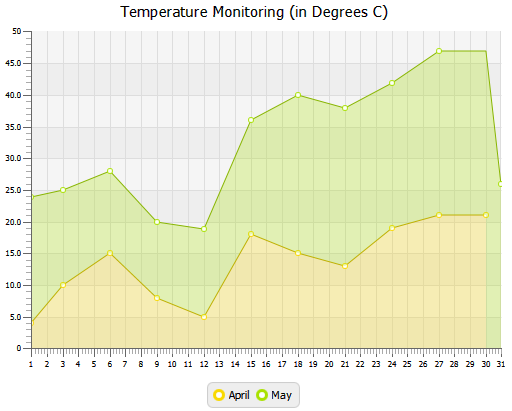
You can represent data in the area chart by using the StackedAreaChart class. This class builds areas that are stacked so that each series adjoins but does not overlap the preceding series. Example 4-2 implements this task.
Example 4-2 Creating a Stacked Area Chart
import javafx.application.Application;
import javafx.scene.Scene;
import javafx.scene.chart.NumberAxis;
import javafx.scene.chart.StackedAreaChart;
import javafx.scene.chart.XYChart;
import javafx.stage.Stage;

public class StackedAreaChartSample extends Application {

    final NumberAxis xAxis = new NumberAxis(1, 31, 1);
    final NumberAxis yAxis = new NumberAxis();
    final StackedAreaChart<Number, Number> sac =
            new StackedAreaChart<Number, Number>(xAxis, yAxis);

    @Override
    public void start(Stage stage) {
        stage.setTitle("Area Chart Sample");
        sac.setTitle("Temperature Monitoring (in Degrees C)");
        XYChart.Series<Number, Number> seriesApril =
                new XYChart.Series<Number, Number>();
        seriesApril.setName("April");
        seriesApril.getData().add(new XYChart.Data(1, 4));
        seriesApril.getData().add(new XYChart.Data(3, 10));
        seriesApril.getData().add(new XYChart.Data(6, 15));
        seriesApril.getData().add(new XYChart.Data(9, 8));
        seriesApril.getData().add(new XYChart.Data(12, 5));
        seriesApril.getData().add(new XYChart.Data(15, 18));
        seriesApril.getData().add(new XYChart.Data(18, 15));
        seriesApril.getData().add(new XYChart.Data(21, 13));
        seriesApril.getData().add(new XYChart.Data(24, 19));
        seriesApril.getData().add(new XYChart.Data(27, 21));
        seriesApril.getData().add(new XYChart.Data(30, 21));
        XYChart.Series<Number, Number> seriesMay =
                new XYChart.Series<Number, Number>();
        seriesMay.setName("May");
        seriesMay.getData().add(new XYChart.Data(1, 20));
        seriesMay.getData().add(new XYChart.Data(3, 15));
        seriesMay.getData().add(new XYChart.Data(6, 13));
        seriesMay.getData().add(new XYChart.Data(9, 12));
        seriesMay.getData().add(new XYChart.Data(12, 14));
        seriesMay.getData().add(new XYChart.Data(15, 18));
        seriesMay.getData().add(new XYChart.Data(18, 25));
        seriesMay.getData().add(new XYChart.Data(21, 25));
        seriesMay.getData().add(new XYChart.Data(24, 23));
        seriesMay.getData().add(new XYChart.Data(27, 26));
        seriesMay.getData().add(new XYChart.Data(31, 26));
        Scene scene = new Scene(sac, 800, 600);
        sac.getData().addAll(seriesApril, seriesMay);
        stage.setScene(scene);
        stage.show();
    }

    public static void main(String[] args) {
        launch(args);
    }
}
When you compile and run this application, it creates the chart shown in Figure 4-3.
Figure 4-3 Stacked Area Chart with Two Areas
Description of "Figure 4-3 Stacked Area Chart with Two Areas"
Compare the data shown in Figure 4-3 with the same data in Figure 4-2. The areas in the stacked area chart show cumulative values on the vertical axis at any given point along the horizontal axis. For example, the value on the vertical axis shown for May 15th in the stacked area chart is 36, which does not correspond to the actual temperature that day. This value represents the cumulative result for temperatures on April 15th and May 15th.
When you develop area charts in your JavaFX applications, remember that data on the vertical axes is interpreted according to the type of area charts (AreaChart or StackedAreaChart). Choose the data representation best suited for the task of the application.
Setting Axis and Tick Properties
The output of the Temperature Monitoring application in Figure 4-2 and Figure 4-3 presents the numerical values on the axes in the default double format., rather than in a user-friendly manner. For example, the month days should be integers and in the range of 1 to 31, instead of float numbers.
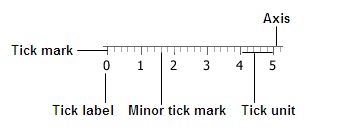
The JavaFX SDK API provides several methods to adjust the appearance of values rendered on chart axes. Figure 4-4 shows the main elements of the chart axis, including tick marks and tick labels that indicate numeric values of the range.
You can specify the minimum and maximum values in the numerical range by using a constructor of the NumberAxis class or the corresponding methods, as shown in Example 4-3.
Example 4-3 Specifying a Data Range for the Horizontal Axis
//Using the NumberAxis constructor
final NumberAxis xAxis = new NumberAxis(1, 31, 1);
//Using the corresponding methods
xAxis.setLowerBound(1);
xAxis.setUpperBound(30);
xAxis.setTickUnit(1);
When using the three-parameter constructor of the NumberAxis class, remember that the first parameter defines the minimum value in the range, the second parameter is the maximum value in the range, and the third parameter defines the tick unit, a value between two tick marks on the axis.
Additionally, if you want to prohibit showing minor ticks on the horizontal axis, then specify 0 for the minorTickCount property, as shown in Example 4-4.
This property defines the number of minor ticks to be displayed between each major tick mark. By setting its value to 0, you disable the minor ticks for the horizontal axis.
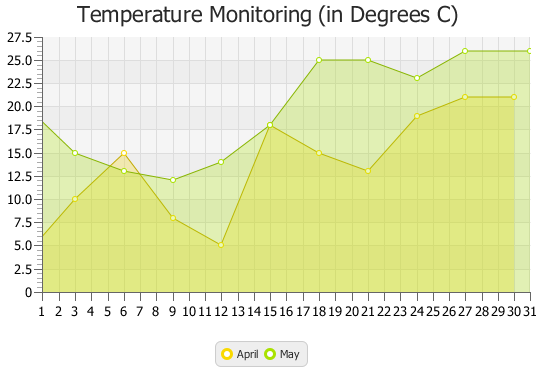
When you add the code lines from Example 4-3 and Example 4-4 to the Temperature Monitoring application, the horizontal axis changes as shown in Figure 4-5.
If your application requires no tick labels to be shown, use the setTickLabelsVisible method with the false value. Similarly, use setTickMarkVisible method with the false value if you do not want tick marks to be visible.
Use the code line shown in Example 4-5 to adjust the range of values for the vertical axis.
Example 4-5 Specifying a Data Range for the Vertical Axis
final NumberAxis yAxis = new NumberAxis(0, 27, 5);
You can also adjust tick marks so that minor and major tick marks have equal length. Use the tickLength and minorTickLength properties as shown in Example 4-6.
Example 4-6 Adjusting the Length of Major and Minor Tick Marks
yAxis.setMinorTickLength(yAxis.getTickLength());
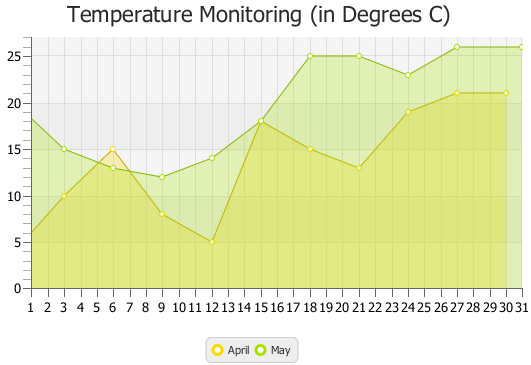
When you add code lines from Example 4-5 and Example 4-6 to the Temperature Monitoring application, the vertical axes changes as shown in Figure 4-6.
Adding Negative Values
Because the vertical axis in the Temperature Monitoring application is created by using the NumberAxis class, you can specify negative values for the area chart data.
Create one more series of data as shown in Example 4-7.
Example 4-7 Adding a Series of Data with Negative Values
import javafx.application.Application;
import javafx.scene.Scene;
import javafx.scene.chart.AreaChart;
import javafx.scene.chart.NumberAxis;
import javafx.scene.chart.XYChart;
import javafx.stage.Stage;


public class AreaChartSample extends Application {

    @Override public void start(Stage stage) {
        stage.setTitle("Area Chart Sample");
        final NumberAxis xAxis = new NumberAxis(1, 31, 1);
        xAxis.setMinorTickCount(0);
        final NumberAxis yAxis = new NumberAxis(-5, 27, 5);
        yAxis.setMinorTickLength(yAxis.getTickLength());
        yAxis.setForceZeroInRange(false);

        final AreaChart<Number,Number> ac =
            new AreaChart<Number,Number>(xAxis,yAxis);
        ac.setTitle("Temperature Monitoring (in Degrees C)");

        XYChart.Series seriesApril= new XYChart.Series();
        seriesApril.setName("April");
        seriesApril.getData().add(new XYChart.Data(0, 4));
        seriesApril.getData().add(new XYChart.Data(3, 10));
        seriesApril.getData().add(new XYChart.Data(6, 15));
        seriesApril.getData().add(new XYChart.Data(9, 8));
        seriesApril.getData().add(new XYChart.Data(12, 5));
        seriesApril.getData().add(new XYChart.Data(15, 18));
        seriesApril.getData().add(new XYChart.Data(18, 15));
        seriesApril.getData().add(new XYChart.Data(21, 13));
        seriesApril.getData().add(new XYChart.Data(24, 19));
        seriesApril.getData().add(new XYChart.Data(27, 21));
        seriesApril.getData().add(new XYChart.Data(30, 21));

        XYChart.Series seriesMay = new XYChart.Series();
        seriesMay.setName("May");
        seriesMay.getData().add(new XYChart.Data(0, 20));
        seriesMay.getData().add(new XYChart.Data(3, 15));
        seriesMay.getData().add(new XYChart.Data(6, 13));
        seriesMay.getData().add(new XYChart.Data(9, 12));
        seriesMay.getData().add(new XYChart.Data(12, 14));
        seriesMay.getData().add(new XYChart.Data(15, 18));
        seriesMay.getData().add(new XYChart.Data(18, 25));
        seriesMay.getData().add(new XYChart.Data(21, 25));
        seriesMay.getData().add(new XYChart.Data(24, 23));
        seriesMay.getData().add(new XYChart.Data(27, 26));
        seriesMay.getData().add(new XYChart.Data(31, 26));

        XYChart.Series seriesMarch = new XYChart.Series();
        seriesMarch.setName("March");
        seriesMarch.getData().add(new XYChart.Data(0, -2));
        seriesMarch.getData().add(new XYChart.Data(3, -4));
        seriesMarch.getData().add(new XYChart.Data(6, 0));
        seriesMarch.getData().add(new XYChart.Data(9, 5));
        seriesMarch.getData().add(new XYChart.Data(12, -4));
        seriesMarch.getData().add(new XYChart.Data(15, 6));
        seriesMarch.getData().add(new XYChart.Data(18, 8));
        seriesMarch.getData().add(new XYChart.Data(21, 14));
        seriesMarch.getData().add(new XYChart.Data(24, 4));
        seriesMarch.getData().add(new XYChart.Data(27, 6));
        seriesMarch.getData().add(new XYChart.Data(31, 6));


        Scene scene  = new Scene(ac,800,600);
        ac.getData().addAll(seriesMarch, seriesApril, seriesMay);
        stage.setScene(scene);
        stage.show();
    }

    public static void main(String[] args) {
        launch(args);
    }
}
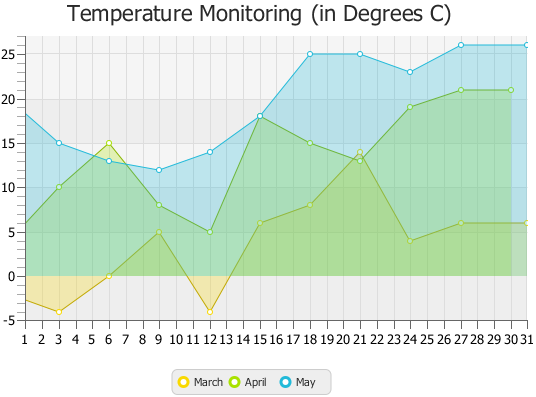
Figure 4-7 demonstrates the Temperature Monitoring application modified to display the weather data for three months: March, April, and May.
Styling Area Charts
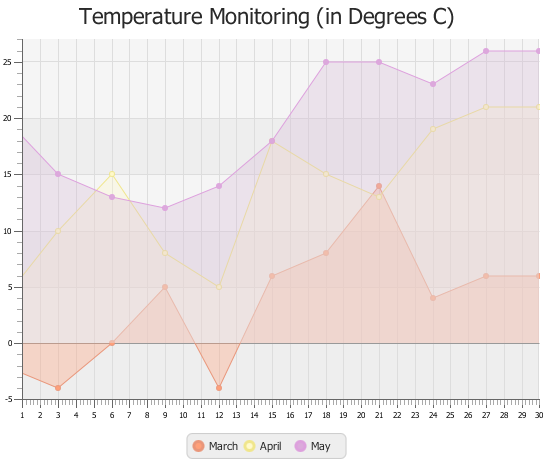
The color for each month in Example 4-7 is defined by the order of the corresponding data series as declared in the addAll method. That is why the March area in Figure 4-7 is painted yellow. You can set the color for AreaChart objects through CSS.
Create the Chart.css file and save it in the same directory as the main class of the AreaChartSample application. Add the lines shown in Example 4-8 to the Chart.css file.
Example 4-8 CSS Styles for an Area Chart
.default-color0.chart-area-symbol { -fx-background-color: #e9967a, #ffa07a; }
.default-color1.chart-area-symbol { -fx-background-color: #f0e68c, #fffacd; }
.default-color2.chart-area-symbol { -fx-background-color: #dda0dd, #d8bfd855; }

.default-color0.chart-series-area-line { -fx-stroke: #e9967a; }
.default-color1.chart-series-area-line { -fx-stroke: #f0e68c; }
.default-color2.chart-series-area-line { -fx-stroke: #dda0dd; }

.default-color0.chart-series-area-fill { -fx-fill: #ffa07a55; }
.default-color1.chart-series-area-fill { -fx-fill: #fffacd55; }
.default-color2.chart-series-area-fill { -fx-fill: #d8bfd855; }
The chart-area-symbol CSS class defines parameters of the symbol in the chart legend for a particular data series. Example 4-8 sets the inner and outer colors for the circles in the chart legend.
The chart-series-area-line CSS class sets parameters for the area chart lines. In this example, the color of the line stroke. The chart-series-area-fill CSS class defines the color and the opacity level of the areas.
These styles are applied to the AreaChartSample application by using the getStylesheets() method of the Scene class, as shown Example 4-9.
Example 4-9 Applying CSS Styles to the Scene
scene.getStylesheets().add("areachartsample/Chart.css");
Compiling and running this application produces the modified appearance of the area chart shown in Figure 4-8.
You can learn more about using CSS styles in JavaFX applications from the JavaFX CSS Reference Guide and the Skinning JavaFX Applications with CSS tutorial.
Related API Documentation
-
AreaChart -
Chart -
XYChart -
XYChart.Data -
XYChart.Series -
NumberAxis
 Alla is a technical writer for Oracle. She lives in St. Petersburg, Russia, and develops tutorials and technical articles for Java and JavaFX technologies. Prior to her assignment at Oracle, she worked as a technical writer in different IT companies.

