Using JavaFX Charts
6 Scatter Chart
This chapter describes the scatter chart, a two-axis chart that presents its data as a set of points.
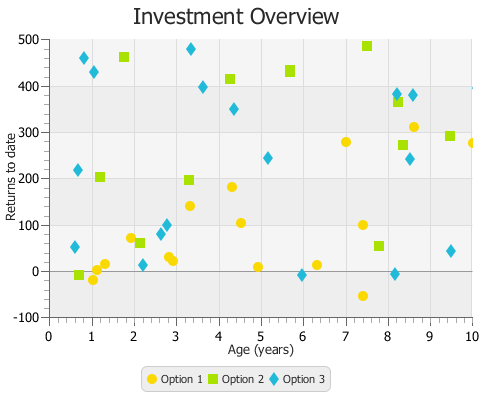
Each point is defined by an X and Y value. Similar to any other two-axis chart, you can create one or several series of data. Figure 6-1 illustrates a scatter chart with three series of data.
Creating a Scatter Chart
To create a scatter chart, define at least one series of data, set horizontal and vertical axes, create the chart by instantiating the ScatterChart class, and assign data to the chart. Example 6-1 demonstrates how to create a simple scatter charts with two series of data.
Example 6-1 Scatter Chart with Two Series of Data
import javafx.application.Application;
import javafx.scene.Scene;
import javafx.scene.chart.NumberAxis;
import javafx.scene.chart.ScatterChart;
import javafx.scene.chart.XYChart;
import javafx.stage.Stage;


public class ScatterChartSample extends Application {

    @Override public void start(Stage stage) {
        stage.setTitle("Scatter Chart Sample");
        final NumberAxis xAxis = new NumberAxis(0, 10, 1);
        final NumberAxis yAxis = new NumberAxis(-100, 500, 100);
        final ScatterChart<Number,Number> sc = new
            ScatterChart<Number,Number>(xAxis,yAxis);
        xAxis.setLabel("Age (years)");
        yAxis.setLabel("Returns to date");
        sc.setTitle("Investment Overview");

        XYChart.Series series1 = new XYChart.Series();
        series1.setName("Equities");
        series1.getData().add(new XYChart.Data(4.2, 193.2));
        series1.getData().add(new XYChart.Data(2.8, 33.6));
        series1.getData().add(new XYChart.Data(6.2, 24.8));
        series1.getData().add(new XYChart.Data(1, 14));
        series1.getData().add(new XYChart.Data(1.2, 26.4));
        series1.getData().add(new XYChart.Data(4.4, 114.4));
        series1.getData().add(new XYChart.Data(8.5, 323));
        series1.getData().add(new XYChart.Data(6.9, 289.8));
        series1.getData().add(new XYChart.Data(9.9, 287.1));
        series1.getData().add(new XYChart.Data(0.9, -9));
        series1.getData().add(new XYChart.Data(3.2, 150.8));
        series1.getData().add(new XYChart.Data(4.8, 20.8));
        series1.getData().add(new XYChart.Data(7.3, -42.3));
        series1.getData().add(new XYChart.Data(1.8, 81.4));
        series1.getData().add(new XYChart.Data(7.3, 110.3));
        series1.getData().add(new XYChart.Data(2.7, 41.2));

        XYChart.Series series2 = new XYChart.Series();
        series2.setName("Mutual funds");
        series2.getData().add(new XYChart.Data(5.2, 229.2));
        series2.getData().add(new XYChart.Data(2.4, 37.6));
        series2.getData().add(new XYChart.Data(3.2, 49.8));
        series2.getData().add(new XYChart.Data(1.8, 134));
        series2.getData().add(new XYChart.Data(3.2, 236.2));
        series2.getData().add(new XYChart.Data(7.4, 114.1));
        series2.getData().add(new XYChart.Data(3.5, 323));
        series2.getData().add(new XYChart.Data(9.3, 29.9));
        series2.getData().add(new XYChart.Data(8.1, 287.4));

        sc.getData().addAll(series1, series2);
        Scene scene  = new Scene(sc, 500, 400);
        stage.setScene(scene);
        stage.show();
    }

    public static void main(String[] args) {
        launch(args);
    }
}
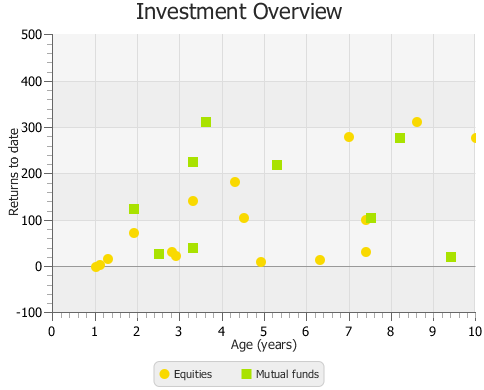
In this example, the ScatterChart object is created with two Number axes to present numerical data for years and amounts of returns. The range of the data and the tick unit are defined within constructors of the NumberAxis class.
The result of compiling and running this application is shown in Figure 6-2.
Figure 6-2 Scatter Chart with Two Series to Display Investment Overview
Description of "Figure 6-2 Scatter Chart with Two Series to Display Investment Overview"
Managing Chart Data
Example 6-1 creates a scatter chart whose data is coded into the application and cannot be changed from its user interface. Use UI controls in your application to manage the set of data presented by the chart, for example, adding and removing a series of data.
Examine the code shown in Example 6-2. It creates two buttons, Add Series and Remove Series, to alter the set of data.
Example 6-2 Using Buttons to Manager Chart Data
import javafx.application.Application;
import javafx.geometry.Insets;
import javafx.scene.Group;
import javafx.scene.Scene;
import javafx.scene.chart.NumberAxis;
import javafx.scene.chart.ScatterChart;
import javafx.scene.chart.XYChart;
import javafx.scene.control.Button;
import javafx.scene.layout.HBox;
import javafx.scene.layout.VBox;
import javafx.stage.Stage;


public class ScatterChartSample extends Application {

    @Override public void start(Stage stage) {
        stage.setTitle("Scatter Chart Sample");
        final NumberAxis xAxis = new NumberAxis(0, 10, 1);
        final NumberAxis yAxis = new NumberAxis(-100, 500, 100);
        final ScatterChart<Number,Number> sc =
            new ScatterChart<Number,Number>(xAxis,yAxis);
        xAxis.setLabel("Age (years)");
        yAxis.setLabel("Returns to date");
        sc.setTitle("Investment Overview");

        XYChart.Series series1 = new XYChart.Series();

        series1.setName("Option 1");
        series1.getData().add(new XYChart.Data(4.2, 193.2));
        series1.getData().add(new XYChart.Data(2.8, 33.6));
        series1.getData().add(new XYChart.Data(6.2, 24.8));
        series1.getData().add(new XYChart.Data(1, 14));
        series1.getData().add(new XYChart.Data(1.2, 26.4));
        series1.getData().add(new XYChart.Data(4.4, 114.4));
        series1.getData().add(new XYChart.Data(8.5, 323));
        series1.getData().add(new XYChart.Data(6.9, 289.8));
        series1.getData().add(new XYChart.Data(9.9, 287.1));
        series1.getData().add(new XYChart.Data(0.9, -9));
        series1.getData().add(new XYChart.Data(3.2, 150.8));
        series1.getData().add(new XYChart.Data(4.8, 20.8));
        series1.getData().add(new XYChart.Data(7.3, -42.3));
        series1.getData().add(new XYChart.Data(1.8, 81.4));
        series1.getData().add(new XYChart.Data(7.3, 110.3));
        series1.getData().add(new XYChart.Data(2.7, 41.2));

        sc.setPrefSize(500, 400);
        sc.getData().addAll(series1);
        Scene scene  = new Scene(new Group());
        final VBox vbox = new VBox();
        final HBox hbox = new HBox();

        final Button add = new Button("Add Series");
        final Button remove = new Button("Remove Series");

        hbox.setSpacing(10);
        hbox.getChildren().addAll(add, remove);

        vbox.getChildren().addAll(sc, hbox);
        hbox.setPadding(new Insets(10, 10, 10, 50));

        ((Group)scene.getRoot()).getChildren().add(vbox);
        stage.setScene(scene);
        stage.show();
    }

    public static void main(String[] args) {
        launch(args);
    }
}
Whereas Example 6-1 adds the scatter chart directly to the scene, Example 6-2 uses VBox and HBox layout containers to arrange components in the application scene.
Define the setOnAction methods for the Add Series button as shown in Example 6-3. It creates a new series of data by populating the XYChart.Series objects with randomly calculated values. Each new series is assigned to the chart by using the add(series) method.
Example 6-3 Adding Series of Data
add.setOnAction(new EventHandler<ActionEvent>() {
    @Override public void handle(ActionEvent e) {
        if (sc.getData() == null)
            sc.setData(
                FXCollections.<XYChart.Series<Number,
                    Number>>observableArrayList());
        ScatterChart.Series<Number, Number> series =
            new ScatterChart.Series<Number, Number>();
        series.setName("Option "+(sc.getData().size()+1));
        for (int i=0; i<100; i++) series.getData().add(
            new ScatterChart.Data<Number,
                Number>(Math.random()*100, Math.random()*500));
        sc.getData().add(series);
    }
});
To remove a data series from the chart, define the setOnAction method for the Remove Series button as shown in Example 6-4. The remove(int) method called on the scatter chart removes a series of data by using a randomly generated index.
Example 6-4 Removing Series of Data
remove.setOnAction(new EventHandler<ActionEvent>() {
    @Override public void handle(ActionEvent e) {
        if (!sc.getData().isEmpty())
            sc.getData().remove((int)(Math.random()*(sc.getData().size()-1)));
    }
});
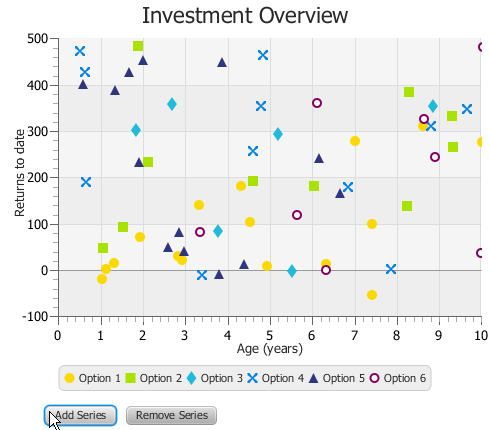
When you add Example 6-3 and Example 6-4 into the application in Example 6-2, the output shown in Figure 6-3 appears. It captures the moment when five series are added to the Option 1 series.
The symbols used to indicate a series of data are coded into the implementation of the ScatterChart class. Example 6-5 shows the default styles for one of the scatter chart symbols.
Example 6-5 Styling a ScatterChart Symbol
.default-color5.chart-symbol { /* hollow circle */
    -fx-background-color: #860061, white;
    -fx-background-insets: 0, 2;
    -fx-background-radius: 5px;
    -fx-padding: 5px;
}
You can change the styles for this symbol by setting the alternative values for the .default-color5.chart-symbol property. See the JavaFX CSS Reference Guide for more information.
Adding Effects to Charts
All the chart classes available in the javafx.scene.chart are extensions of the Node class. Therefore, you can apply visual effects or transformation to every type of charts. Examine the code fragment in Example 6-6. It creates and applies a drop shadow effect to the scatter chart.
Example 6-6 Creating and Applying a Drop Shadow
final DropShadow shadow = new DropShadow();
shadow.setOffsetX(2);
shadow.setColor(Color.GREY);
sc.setEffect(shadow);
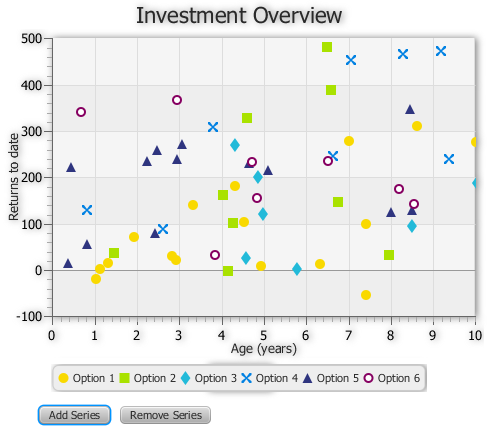
When you add this code fragment to the Investment Overview application, then compile and run it, the scatter chart is highlighted by the shadow as shown in Figure 6-4.
Figure 6-4 Scatter Chart with a Drop Shadow
Description of "Figure 6-4 Scatter Chart with a Drop Shadow"
Note that the visual effect of the drop shadow is applied to all elements of the chart including axes, tick marks, and tick labels.
Changing the Chart Symbol
Each data series in a scatter chart is represented by the symbols defined in the caspian.css, the default style sheet for JavaFX applications. However, you can change the chart symbol by implementing your own style sheet.
Create the Chart.css file and save it in the same directory as the main class of the AreaChartSample application. Add the lines shown in Example 6-7 to the Chart.css file.
Example 6-7 Creating a New Chart Symbol with CSS
.chart-symbol{
    -fx-stroke: #a9e200;
    -fx-shape: "M0,4 L2,4 L4,8 L7,0 L9,0 L4,11 Z";
}
This code fragment creates the symbol shape by defining its SVG path in the -fx-shape parameter and sets the stroke color for the symbol.
Use the getStylesheets() method of the Scene class to apply the style sheet to the application, as shown in Example 6-8.
Example 6-8 Applying a CSS Style to the Scene
scene.getStylesheets().add("scaterchartsample/Chart.css");
Compiling and running this application produces the modified appearance of the area chart shown in Figure 6-5.
Figure 6-5 Scatter Chart with the Modified Chart Symbol
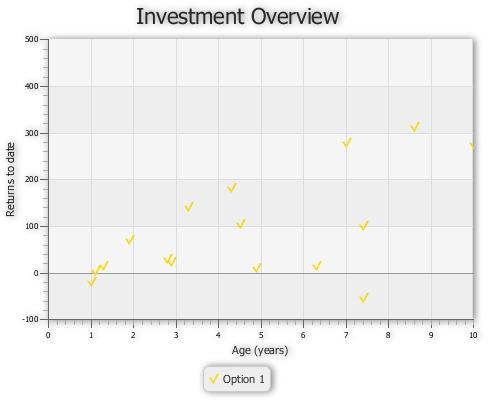
Description of "Figure 6-5 Scatter Chart with the Modified Chart Symbol"
You can learn more about using CSS styles in JavaFX applications from the JavaFX CSS Reference Guide and the Skinning JavaFX Applications with CSS tutorial.
Related API Documentation
-
ScatterChart -
Chart -
XYChart -
XYChart.Data -
XYChart.Series -
NumberAxis -
Button
 Alla is a technical writer for Oracle. She lives in St. Petersburg, Russia, and develops tutorials and technical articles for Java and JavaFX technologies. Prior to her assignment at Oracle, she worked as a technical writer in different IT companies.

