| Exit Print View | |
Java Platform Micro Edition Software Development Kit Version 3.0, Mac OS |

|
Viewing and Editing Project Properties
Running Projects in the Emulator
Searching the WURFL Device Database
Finding Files in the Multiple User Environment
Save and Load Network Monitor Information
CLDC Emulation on a Windows Mobile Device
Installing CLDC Emulation on a Windows Mobile Emulator (Windows Only)
JSR 82: Bluetooth and OBEX Support
JSR 135: Mobile Media API Support
JSR 177: Smart Card Security (SATSA)
JSR 205: Wireless Messaging API (WMA) Support
JSR 211: Content Handler API (CHAPI)
JSR 226: Scalable 2D Vector Graphics
JSR 238: Mobile Internationalization API (MIA)
JSR 256: Mobile Sensor API Support
You can also edit the device.properties file to set netmon.enabled to true. The properties file is located in the device instance directory, as described in File Locations.
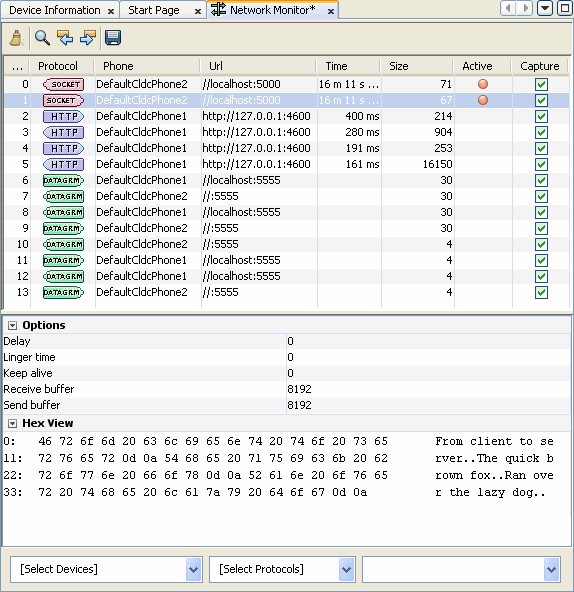
When the application makes any type of network connection, information about the connection is captured and displayed.

The top frame displays a list of messages. Click a message to display its details in the bottom frame.
In the Hex View, message bodies are shown as raw hexadecimal values with the equivalent text. To avoid memory issues, the Hex view is currently limited to 16kB of data.
Note - You can examine messages that are still in the process of being sent. Incomplete messages are indicated by bold highlighting in the message tree.