This topic explains how to optimize API Gateway performance using various configuration options. For example, general performance tuning options include tracing, monitoring, and logging. More advanced performance tuning options include database pooling, HTTP keep alive, chunked encoding, client threads, and Java memory.
![[Note]](../common_oracle/images/admon/note.png) |
Note |
|---|---|
|
This topic applies to performance tuning for both API Gateway and API Gateway Analytics. |
You can optimize API Gateway performance by using Policy Studio to configure the general settings described in this section.
The Trace Log is displayed in the Logs view in the API Gateway Manager
web console. When tracing is running at a verbose level (for example, DEBUG), this means
that the API Gateway is doing more work and is very dependent on disk input/output. You can set a less
verbose trace level for an API Gateway instance or API Gateway port interface (for example, ERROR
or FATAL).
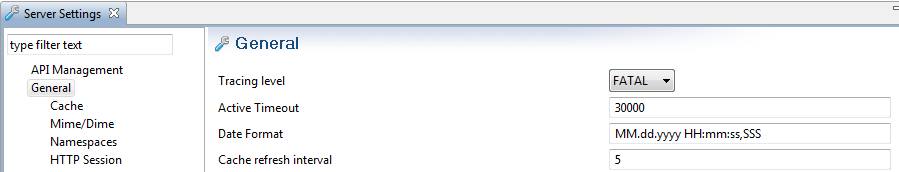
To set the tracing for an API Gateway instance, select Server Settings >
General in the Policy Studio tree, and select the Trace Level
(for example, FATAL):
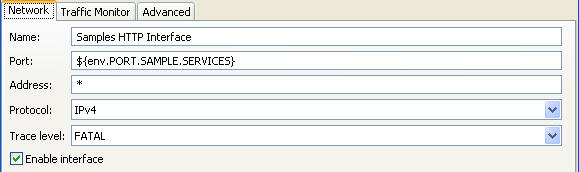
You can also override the trace level for an API Gateway port interface, and set it to a
quieter level. For example, in the Policy Studio tree, select Listeners >
API Gateway > Sample Services > Ports.
Right-click an interface in the list on the right, select Edit, and set
the Trace level (for example, FATAL):
For more details, see Configure API Gateway tracing
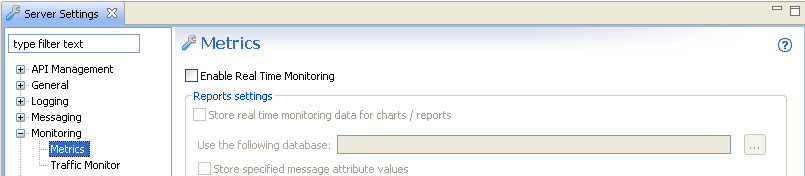
Real-time monitoring is displayed in the Monitoring view in the API Gateway Manager web console. This caches recent message transactions in the memory of the API Gateway. You can remove this overhead by disabling real-time monitoring.
To disable in Policy Studio, select Server Settings > Monitoring > Metrics, and deselect Enable Real-Time Monitoring:
For more details, see Real-time monitoring metrics
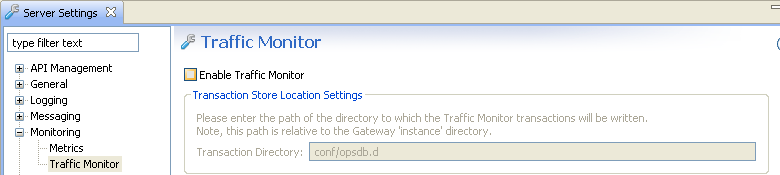
Traffic monitoring is displayed in the Traffic view in the API Gateway Manager web console. By default, the API Gateway stores recent HTTP traffic summaries to the API Gateway disk for use in API Gateway Manager. You can remove this overhead by disabling traffic monitoring.
To disable in Policy Studio, select Server Settings > Monitoring > Traffic, and deselect Enable Traffic Monitor:
For more details, see Traffic monitoring settings
The Transaction Log is displayed in the Logs view in the API Gateway Manager web console. You should ensure that the API Gateway is not sending transaction log messages or events to transaction log destinations. This is because the performance of the API Gateway will be determined by the log destination.
To disable transaction logging in the API Gateway, you must disable all log destinations in Policy Studio. For example, select Server Settings > Logging > Transaction Log, and deselect Enable logging to a file. The following example shows disabling logging to file, you must perform this step in all tabs on this screen:
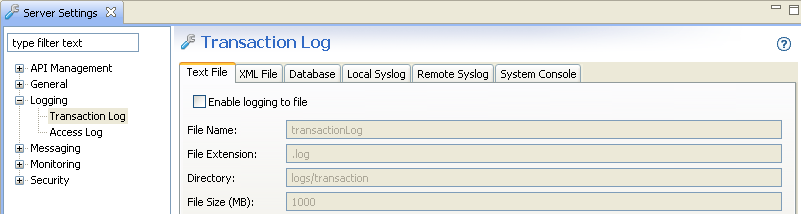
For more details, see Transaction Log settings
You should also ensure that the API Gateway is not sending log messages to the access log. To disable access logging in the API Gateway, select Server Settings > Logging > Access Log, and deselect Access Log Enabled:
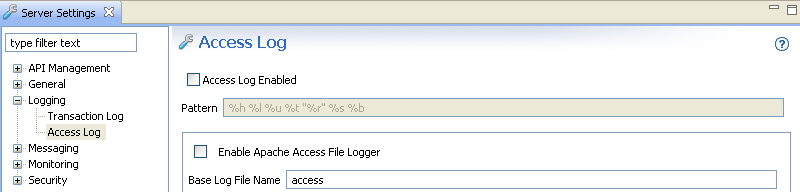
For more details, see Access Log settings
You can also use the advanced configuration settings described in this section to optimize API Gateway performance.
When stress testing with large messages (greater than 4 MB), the API Gateway spills data to disk
instead of holding it in memory. By default, the spilltodisk option is triggered with
payload sizes of 4 MB or more. For example, you can configure this in the service.xml
file in the following directory by adding the spilltodisk option configured in bytes:
<install-dir>/apigateway/groups/<group-id>/<instance-id>/conf/service.xml
For example:
<NetService provider="NetService">
    <SystemSettings
            tracelevel="&server.tracelevel;"
            tracecomponent="&server.title;"
            title="&server.title;"
            homedir="$VINSTDIR"
            secret="&server.entitystore.secret;"
            servicename="&server.servicename;"
            spilltodisk="10485760"
            ...
This setting specifies the limit of what is considered a reasonably-sized message to hold in memory. After this limit is exceeded, to preserve memory, the system writes the content of the incoming request to disk when it arrives.
The API Gateway uses Apache Commons Database Connection Pools (DBCP) for pooling database connections. For details, see http://commons.apache.org/dbcp/.
|
Note |
|---|---|
|
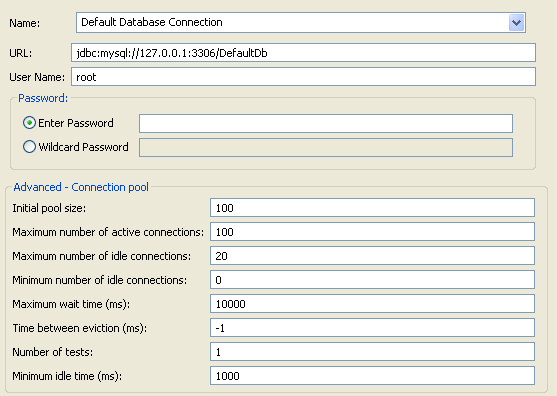
Oracle recommends that if your policy interacts heavily with the database, the pool size for the database connection should be at least as big as the expected client population. This assumes the database can cope with this number of parallel connections. For example, if you are providing load from 100 parallel clients, the pool settings shown in the following example are recommended. |
To configure database pooling in Policy Studio, select External Connections > Database Connections > Add Database Connection. For example:
In HTTP/1.1, by default, the connection between a client and a server is maintained so that further client requests can avoid the overhead of setting up a new connection. This may or may not model the client population of a particular scenario very well. If it is acceptable to reuse TCP connections (and SSL connections on top of these), ensure your client uses HTTP/1.1, and does not opt out of the HTTP keepalive mechanism.
For the sr command, this means you should use the -V1.1 and -U1000
arguments to enable the connection be used a number of times before closing it. For details on
sr, see the API Gateway User Guide.
|
Note |
|---|---|
|
For conformance with the HTTP/1.1 specification, the client must send a |
For interoperability reasons, the API Gateway normally does not use chunked encoding when talking to
a remote server. Because of the HTTP protocol, the API Gateway must send the Content-Length
header to the server, and so must precompute the exact size of the content to be transmitted. This
may be expensive.
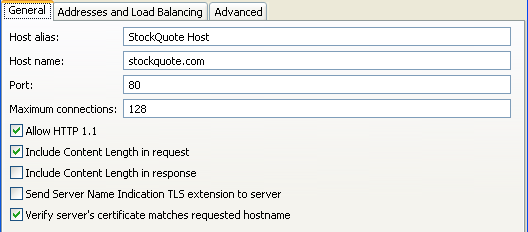
For example, when relaying data directly from client to server, or when the message exists as an abstract XML document in the API Gateway, the size may not be immediately available. This means that the entire content from the client must be buffered, or the internal body structure must be serialized an extra time just to measure its size. By configuring a remote host for the destination server to allow HTTP 1.1, when a server is known to be advertising HTTP 1.1, chunked encoding can be used when transmitting to that server where appropriate.
For example, in the Policy Studio tree, select Listeners > API Gateway > Sample Services. Right-click the remote host, select Edit, and select Allow HTTP 1.1:
If a performance test uses one client and one target service, it is recommended that you use the following settings:
sysctl net.ipv4.tcp_tw_recycle=1
sysctl net.ipv4.tcp_tw_reuse=1
A TCP/IP connection is identified by the following properties:
-
Remote IP address
-
Local IP address
-
Remote port
-
Local port
When you have a fixed client IP address, a fixed server IP address, and a fixed server port, this leaves 65536 client ports, which means you can only have 65536 live connections at a time.
In a TCP/IP connection, one side always ends up in the TIME_WAIT state, which is
part of the protocol. This period can last for two minutes by default. In a naive implementation,
this means you can establish at most 65536 connections every 4 minutes. There are ways to mitigate
this in the protocol, and most TCP stacks can reuse connections in the TIME_WAIT state
more rapidly than this. But under certain circumstances, this can still be a problem. The
sysctl settings shown above make the Linux kernel more aggressive in the way it
recycles TIME_WAIT connections.
If processing many large XML documents, you should reduce the Java Virtual Machine (JVM) memory
so that garbage collection is performed more often. Create a file called jvm.xml in
the system/conf directory of the API Gateway installation with the following contents:
<ConfigurationFragment>
    <VMArg name="-Xmx100m"/>
    <VMArg name="-Xms100m"/>
    <VMArg name="-Xincgc"/>
    <Print message="JVM heap limited"/>
</ConfigurationFragment>
The amount of memory used by the server is limited in several ways, and one of these limits is the normal Java heap space. The API Gateway can use memory that is not visible to the JVM, but is pinned by it, so it is not released until the JVM decides to collect its garbage. If the amount of memory pinned is much larger than the size of the objects that the JVM sees (the bits pinning it down), the Java heap setting does not represent the amount of heap memory used. So the problem is worked around by reducing the Java heap space used in this scenario.
For example, by setting the Java heap size to 100 MB instead of 1024 MB, the Java garbage collector runs when the Java heap use is close to 100 MB, while the amount of memory physically pinned by the JVM may be closer to 1000 MB. Without this adjustment, the memory usage would grow beyond what is possible for a 32-bit process.
In addition, you may wish to consider reducing the number of threads that the API Gateway uses for
processing incoming messages. You can do this by adding a maxThreads="64" attribute
in the SystemSettings element in system/conf/service.xml. This setting
also helps in configuring the API Gateway to back off from the target service (if the API Gateway can
process more load than the target service).
If there are more than 200 client threads connecting, you must change the following line in the
venv script in the posix/bin directory of your API Gateway installation:
ulimit -n unlimited ...
to the following:
ulimit -n 131072 ...
This prevents the too many open files error that you might see in a 200 client thread test.
This applies if the performance test involves more than one connection filter, where the filter is routing to the same host and port with the same SSL credentials. You should create a policy containing the single connection filter, and delegate to this policy from where you normally do the routing, so you delegate to a single filter instead of a connection filter per policy.
Each connection processor caches connections independently. This is because two connection processors using different SSL certificates cannot pool their connections. They are not interchangeable from an authentication point of view. Therefore, when using multiple connection filters, there is potential to soak the target machine with too many connections.
|
Note |
|---|---|
|
This applies to both API Gateway Connection and Connect to URL filters in Policy Studio. |
