Examining the jsynprog Data
This procedure assumes you have already created an experiment as described in the previous section.
-
Start Performance Analyzer from the jsynprog directory and load the experiment as follows, specifying your experiment name if it is not called test.1.er.
% analyzer test.1.er
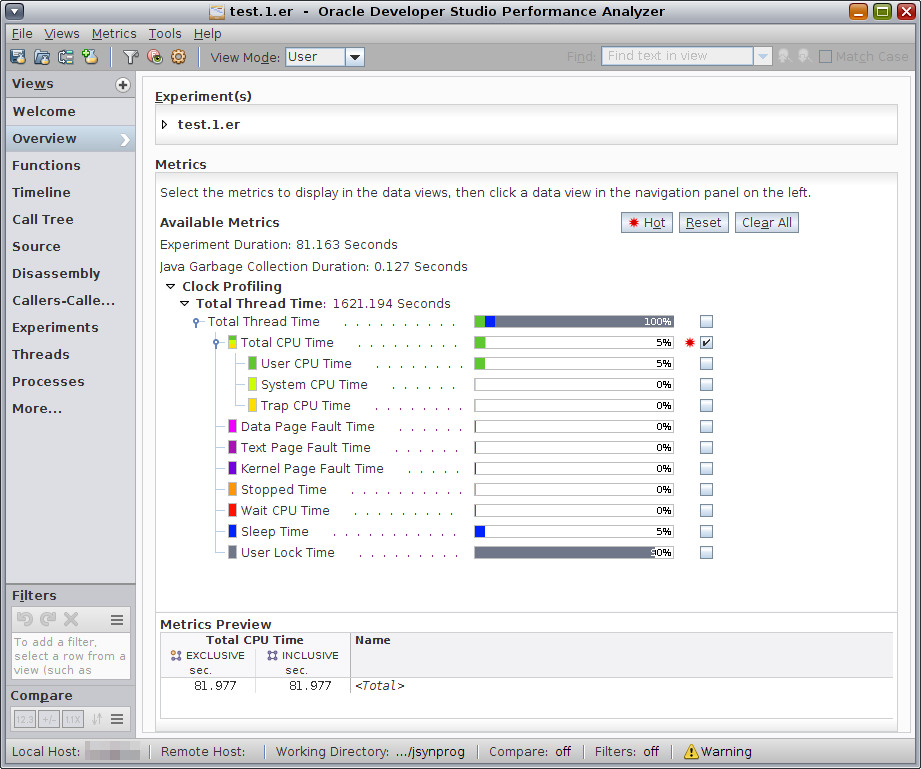
When the experiment opens, Performance Analyzer shows the Overview page.

Notice that the tool bar of Performance Analyzer now has a view mode selector that is initially set to User Mode, showing the user model of the program.
The Overview shows that the experiment ran about 81 seconds but used more than 1600 seconds of total time, implying that on average there were 20 threads in the process.
-
Select the check boxes for the Sleep Time and User Lock Time metrics to add them to the data views.

Notice that the Metrics Preview updates to show you how the data views will look with these metrics added.
-
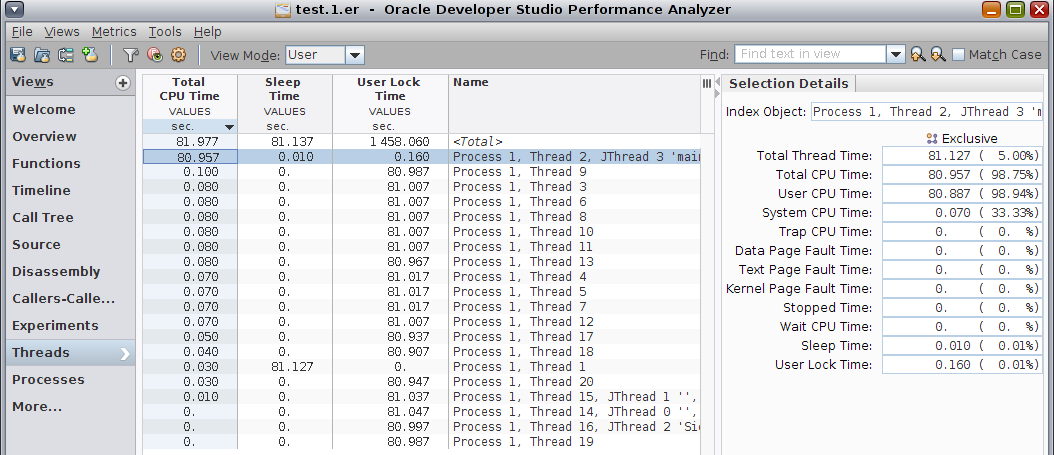
Select the Threads view in the navigation panel and you will see the data for the threads:

Only Thread 2 accumulated significant Total CPU time. The other threads each had only a few profile events for Total CPU time.
-
Select any thread in the Threads view and see all the information for that thread in the Selection Details window on the right.
You should see that almost all of the threads except Thread 1 and Thread 2 spend all their time in User Lock state. This shows how the JVM synchronizes itself internally. Thread 1 launches the user Java code and then sleeps until it finishes.
-
Go back to the Overview and deselect Sleep Time and User Lock Time.
-
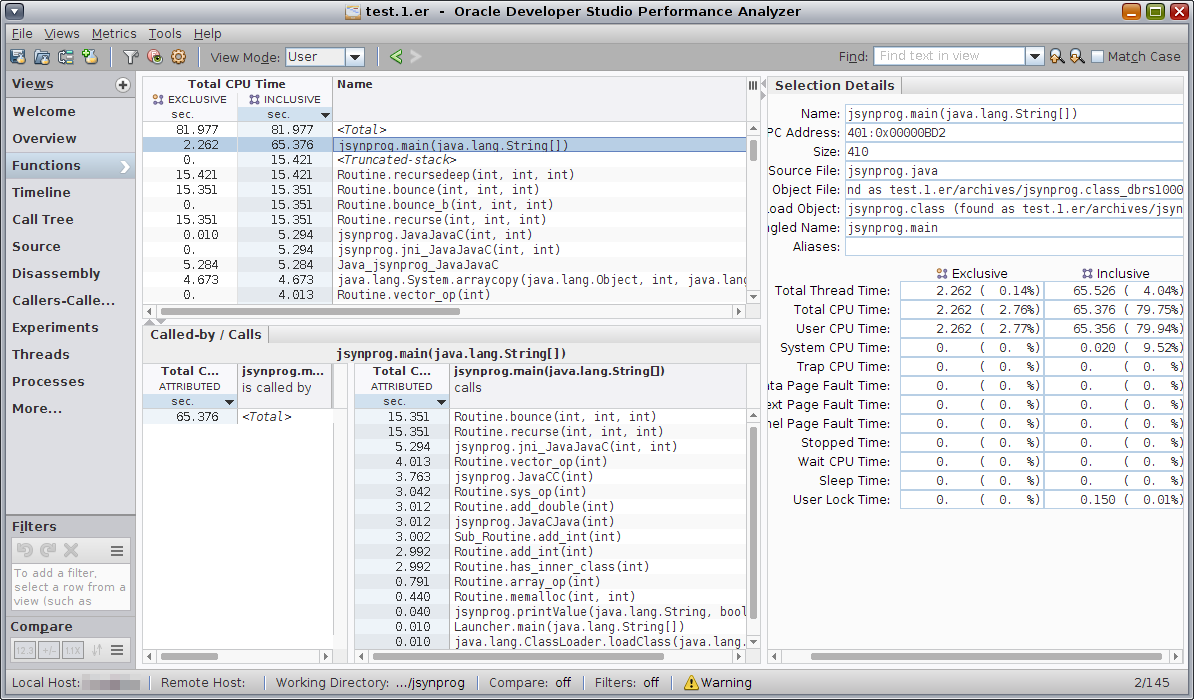
Select the Functions view in the navigation panel, then click on the column headers to sort by Exclusive Total CPU Time, Inclusive Total CPU Time, or Name.
You can sort by descending or ascending order.
Leave the list sorted by Inclusive Total CPU Time in descending order and select the top-most function jsynprog.main(). That routine is the initial routine that the JVM calls to start execution.

Notice that the Called-by/Calls panel at the bottom of the Functions view show that the jsynprog.main() function is called by <Total>, meaning it was at the top of the stack.
The Calls side of the panel shows that jsynprog.main() calls a variety of different routines, one for each of the subtasks shown in About the Java-C++ Profiling Tutorial that are directly called from the main routine. The list also includes a few other routines.