Detecting False Sharing
This part of the tutorial is applicable only to systems where the L1 D-Cache Miss dcm counter is precise. Such systems include SPARC-T4, SPARC-T5, SPARC-M5 and SPARC-M6, among others. If your experiment was recorded on a system without a precise dcm counter, this section does not apply.
This procedure shows how to use Index Object views and Memory Object views along with filtering.
When you create an experiment on a system with precise memory-related counters, a machine model is recorded in the experiment. The machine model represents the mappings of addresses to the various components in the memory subsystem of that machine. When you load the experiment in Performance Analyzer or er_print, the machine model is automatically loaded.
The experiment used for the screen shots in this tutorial was recorded on a SPARC T5 system and the t5 machine model for that machine is automatically loaded with the experiment. The machine model adds data views of index objects and memory objects.
-
Go to the Functions view and select computeB(), then right-click and select Add Filter: Include only stacks containing the selected functions.
By filtering, you can focus on the performance of the computeB() function and the profile events occurring in that function.
-
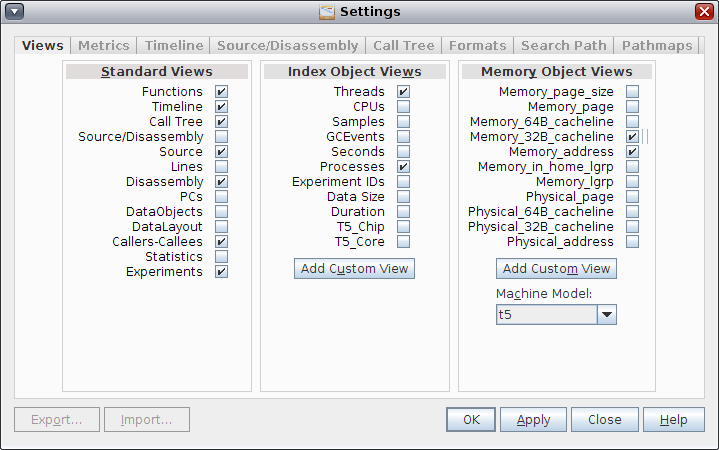
Click the Settings button in the tool bar or choose Tools → Settings to open the Settings dialog, and select the Views tab in that dialog.

The panel on the right is labeled Memory Objects Views and shows a list of data views that represent the SPARC T5 machine's memory subsystem structure.
-
Select the check boxes for Memory_address and Memory_32B_cacheline and click OK.
-
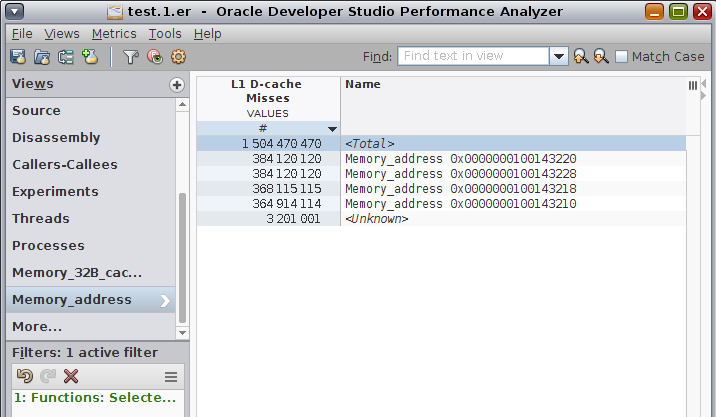
Select the Memory_address view in the Views navigation panel.

In this experiment you can see that there are four different addresses getting the cache misses.
-
Select one of the addresses and then right-click and choose Add Filter: Include only events with the selected item.
-
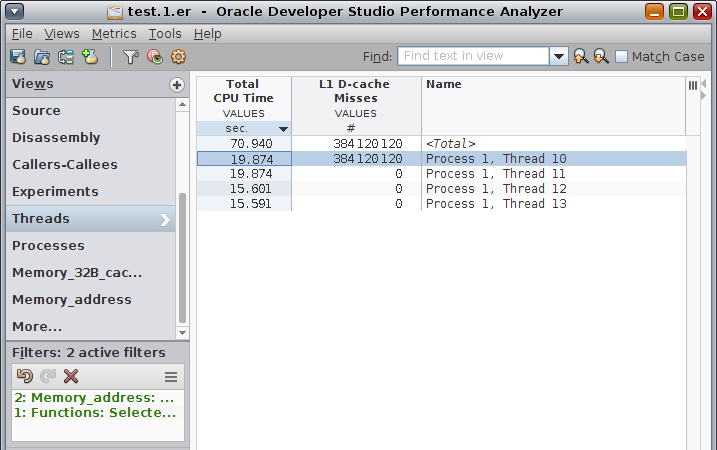
Select the Threads view.

As you can see in the preceding screen shot, only one thread has cache misses for that address.
-
Remove the address filter by right-clicking in the view and selecting Undo Filter Action from the context menu.
You can alternatively use the Undo Filter Action button in the Active Filters panel to remove the filter.
-
Return to the Memory_address view, and select and filter on other addresses and check the associated thread in the Threads view.
By filtering and unfiltering and by switching between the Memory_address and Threads views in this manner, you can confirm that there is a one-to-one relationship between the four threads and the four addresses. That is, the four threads do not share addresses.
-
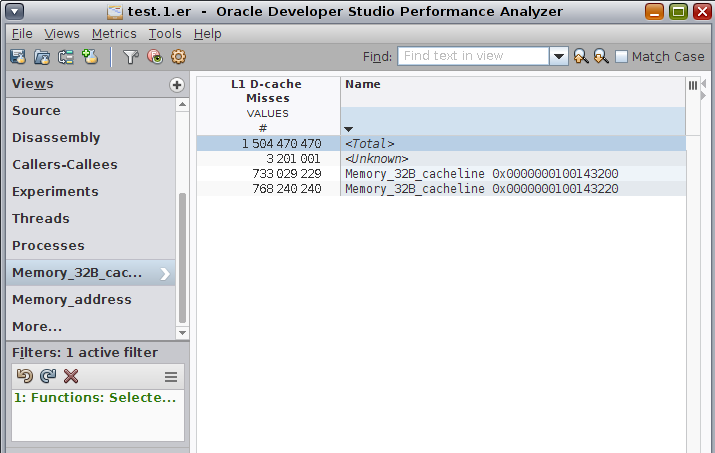
Select the Memory_32B_cacheline view in the Views navigation panel.

Confirm in the Active Filters panel that there is only the filter active on the function computeB(). The filter is shown as Functions: Selected Functions. None of the filters on addresses should be active now.
You should see that there are two 32-byte cache lines getting the cache misses of the four threads and their four respective addresses. This confirms that although you saw earlier that the four threads do not share addresses, you see here that they do share cache lines.
False sharing is a very difficult problem to diagnose, and the SPARC T5 chip, along with Oracle Developer Studio Performance Analyzer enables you to do so.