Using Performance Analyzer to Collect Data
This section describes how to use the Profile Application feature of Performance Analyzer to collect data in an experiment.
Tip - If you prefer not to follow these steps to see how to profile applications, you can record an experiment with a make target included in the Makefile for lowfruit:
make collectThe collect target launches a collect command and records an experiment just like the one that you create using Performance Analyzer in this section. You could then skip to Using the Performance Analyzer to Examine the lowfruit Data.
-
While still in the lowfruit directory start, Performance Analyzer:
% analyzer
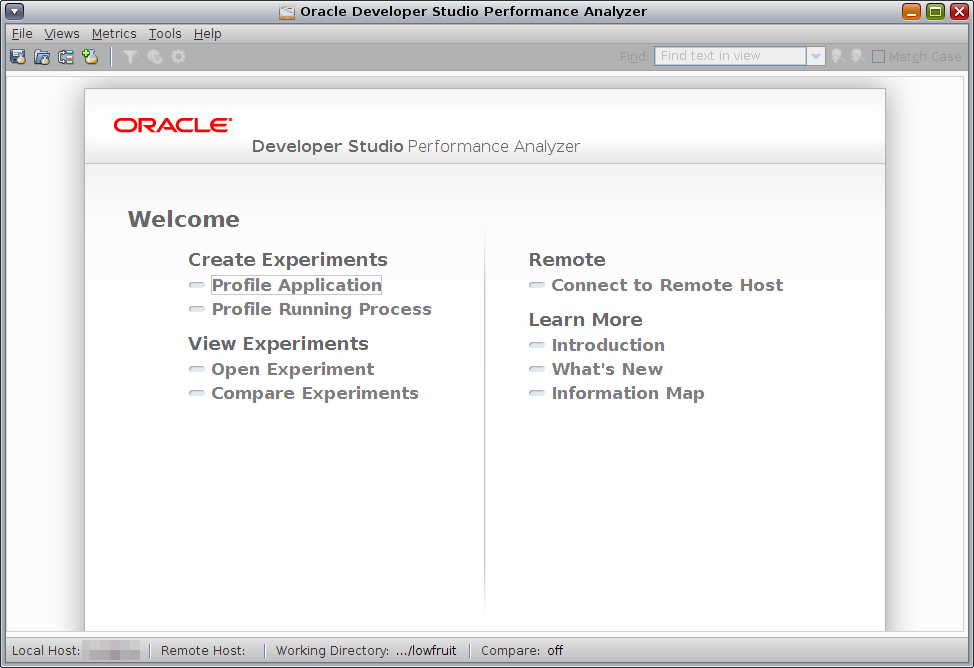
Performance Analyzer starts and displays the Welcome page.

If this is the first time you have used Performance Analyzer, no recent experiments are shown below the Open Experiment item. If you have used it before, you see a list of the experiments you recently opened from the system where you are currently running Performance Analyzer.
-
Click the Profile Application link under Create Experiments in the Welcome page.
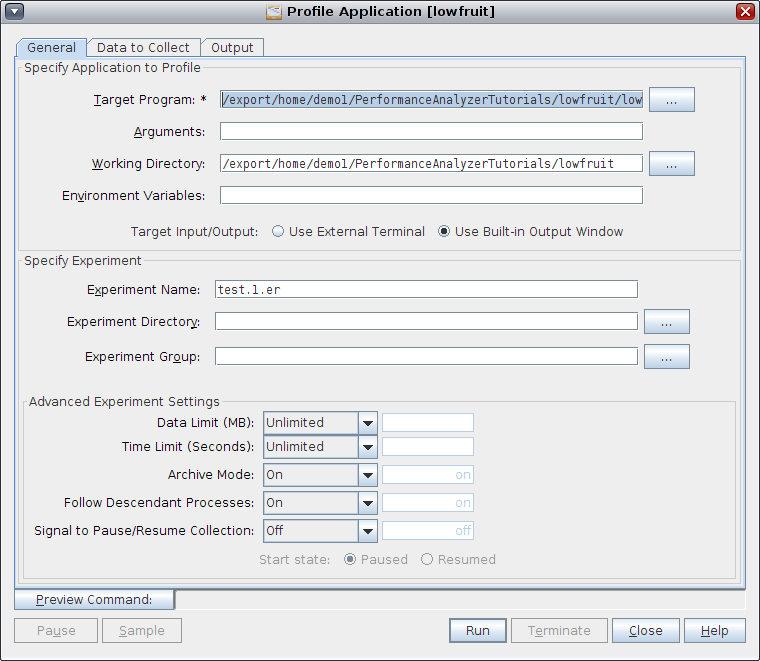
The Profile Application dialog box opens with the General tab selected. On this page options are organized into several areas: Specify Application to Profile, Specify Experiment, and Advanced Experiment Settings.
-
In the Target Program field, type the program name lowfruit.

Tip - You could start Performance Analyzer and open this dialog box directly with the program name already entered by specifying the target name when starting Performance Analyzer with the command analyzer lowfruit. This method only works when running Performance Analyzer locally. -
For the Target Input/Output option located at the bottom of the Specify Application to Profile panel, select Use Built-in Output Window.
Target Input/Output option specifies the window to which the target program stdout and stderr will be redirected. The default value is Use External Terminal, but in this tutorial the Target Input/Output option was changed to Use Built-in Output Window to keep all the activity in the Performance Analyzer window. With this option the stdout and stderr is shown in the Output tab in the Profile Application dialog box.
If you are running remotely, the Target Input/Output option is absent because only the built-in output window is supported.
-
For the Experiment Name option, the default experiment name is test.1.er but you can change it to a different name as long as the name ends in .er, and is not already in use.
-
Click the Data to Collect tab.
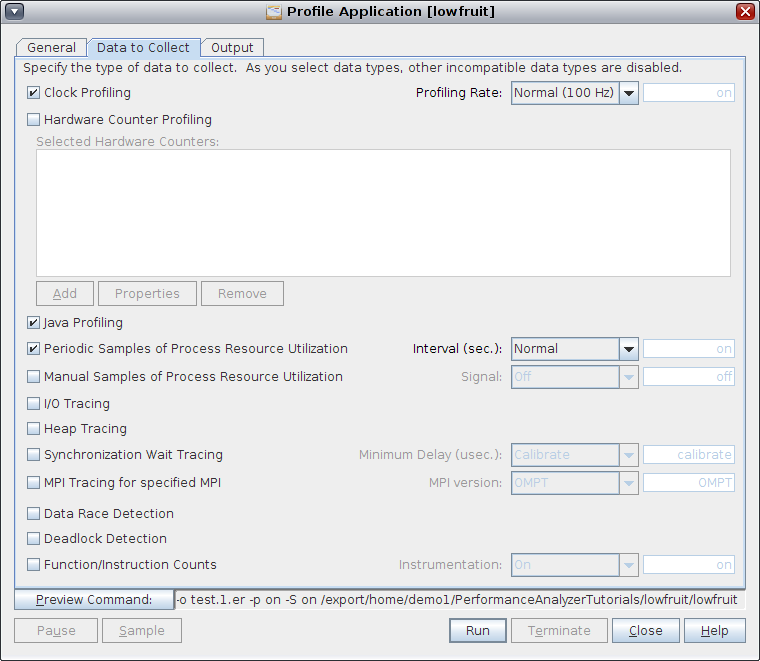
The Data to Collect enables you to select the type of data to collect, and shows the defaults already selected.

Java profiling is enabled by default as you can see in the screen shot, but it is ignored for a non-Java target such as lowfruit.
You can optionally click the Preview Command button and see the collect command that will be run when you start profiling.
-
Click the Run button.
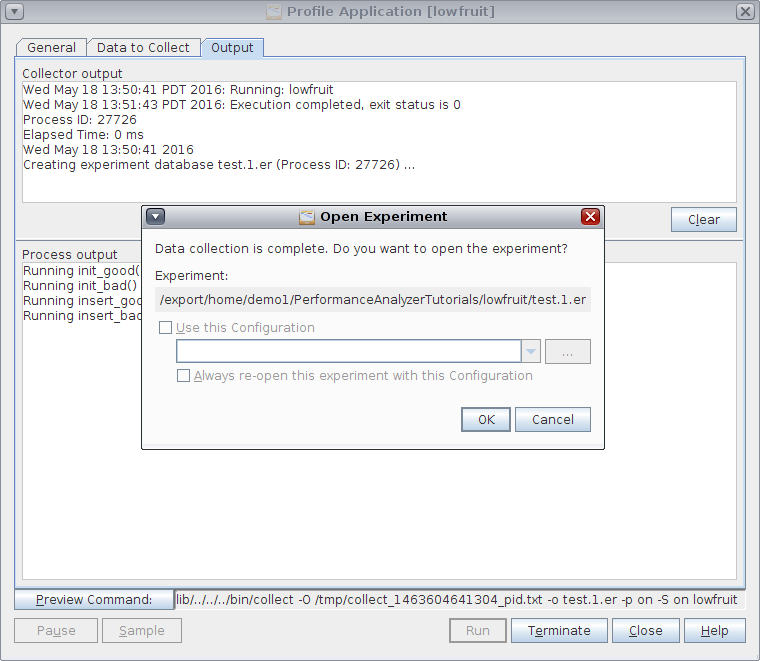
The Profile Application dialog box displays the Output tab and shows the program output as it runs in the Process Output panel.
After the program completes, a dialog box asks if you want to open the experiment just recorded.

-
Click OK in the dialog box.
The experiment opens. The next section shows how to examine the data.