Release 2 (8.1.6) for Windows NT
A73008-01
Library |
Product |
Contents |
Index |
| Oracle8i Administrator's Guide Release 2 (8.1.6) for Windows NT A73008-01 |
|
This chapter describes how to monitor Oracle8i for Windows NT.
Specific topics discussed are:
The following tools enable you to monitor your Oracle8i database:
Each tool is described in the following sections.
|
Additional Information:
See Oracle8i Tuning and Performance for general tuning information and your operating system documentation for additional information on Windows NT Performance Monitor results and optimizing database performance. |
Oracle Performance Monitor for Windows NT is a graphical tool for measuring the performance of Oracle8i for Windows NT objects on a local server or other servers on a network. This tool is the same in appearance and operation as the Windows NT Performance Monitor, except it has been preloaded with Oracle8i database performance elements.
On each computer, you can view the behavior of objects, such as the buffer cache, data dictionary cache, data files, threads, and processes. An object is a graphical representation of an element in your system. Every element, resource, and device in your system can be represented as an object.
There is a set of counters associated with each object. A counter is a unit of measurement used by the Performance Monitor to display activity. The type of activity the counter measures is dependent upon the type of object.
Certain object types and their respective counters are present on all systems. Other counters, such as application-specific counters, appear only if the computer is running the associated software.
Each of these objects has an associated set of counters that provide information about device usage, queue lengths, delays, and information used to measure throughput and internal congestion.
When you install Oracle Performance Monitor for Windows NT, values are automatically set in the registry as described in Appendix C, "Oracle8i Configuration Parameters and the Registry".
The Oracle Performance Monitor for Windows NT allows you to monitor only one database instance at a time. For this reason, the registry contains the following values:
Use OPERFCFG to change these values. Oracle Corporation recommends setting the security level on each of these registry values.
|
See :
Appendix C, "Oracle8i Configuration Parameters and the Registry", Modifying Oracle Performance Monitor for Windows NT Parameters, on how to use OPERFCFG. |
To use Oracle Performance Monitor for Windows NT for another database instance on the same computer or a UNIX computer, change the values appropriately in the registry. You can also monitor non-NT Oracle databases by changing the Hostname registry value so it points to another computer specified in the TNSNAMES.ORA file.
To access Oracle Performance Monitor for Windows NT:
Choose Start > Programs > Oracle - HOME_NAME > Database Administration > Oracle Performance Monitor for Windows NT.
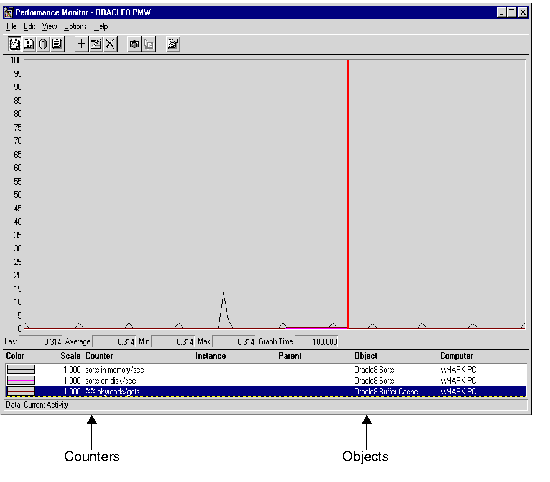
The Performance Monitor window appears with the Chart View:

The Oracle Performance Monitor for Windows NT has four views you can choose from the View menu:
For each view (Chart, Alert, Log, and Report), you can decide on the objects you want to monitor and save those settings to a file. When an object is chosen, it is assigned a counter, a color, and added to the status bar at the bottom of Oracle Performance Monitor for Windows NT.
To add objects to a view:
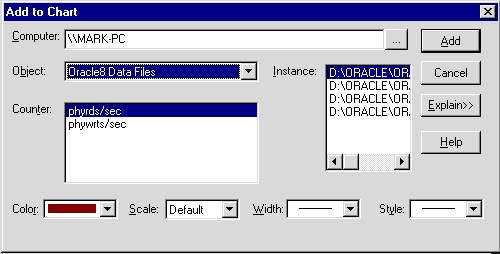
The Add to (Chart, Alert, Log, Report) dialog box appears.
Below is the Add to Chart dialog box. Note the corresponding dialog boxes for the other views are different.

Below are the elements of the Add to Chart dialog box. The other views' dialog boxes have similar features.
The selections you have chosen to monitor are displayed.
All Oracle8i system resources that can be monitored through Oracle Performance Monitor for Windows NT begin with Oracle8i. These measures are defined in ORACLE_BASE\ORACLE_HOME\DBS\PERF.ORA. The following table shows the Oracle8i objects and their associated counters. For additional information on these objects, see Oracle8i Tuning and Performance.
| Object | Counter | Description |
|---|---|---|
|
Oracle8i Buffer Cache |
phyrds/gets % |
The percentage of phyrds/gets is calculated as a Miss ratio. The lower the Miss counter, the better. To improve performance, increase the number of buffers in the buffer cache, if memory is available on the machine. To make the buffer cache larger, increase the value of the DB_BLOCK_BUFFERS initialization parameter. This value is not time-derived. |
|
Oracle8i Redo Log Buffer |
redo log space requests |
The value of this counter must be near zero. If this value increments consistently, processes have had to wait for space in the redo log buffer. In this case, it may be necessary to increase the size of the redo log buffer. |
|
Oracle8i Data Dictionary Cache |
getmisses/gets % |
The value of this counter must be less than 10 or 15% for frequently accessed data dictionary caches. If the ratio continues to increase above this threshold while your application is running, increase the amount of memory available to the data dictionary cache. To increase the memory available to the cache, increase the value of the initialization parameter SHARED_POOL_SIZE. (See Oracle8i Tuning and Performance for more detailed information on tuning memory allocation in the Oracle8i database.) This value is not time-derived. |
|
Oracle8i Library Cache |
reloads/pins % |
The percentage of SQL statements, PL/SQL blocks, and object definitions that required reparsing. Total Reloads must be near zero. If the ratio of Reloads to Pins is greater than 1%, then reduce the library cache misses. This value is not time-derived. |
|
Oracle8i Data Files |
Disk contention occurs when multiple processes try to access the same disk simultaneously. There are many ways of reducing disk contention, depending on the results from monitoring disk activity. Some corrective actions include:
These values are time-derived. |
|
|
Oracle8i DBWR stats1 |
|
These counters are helpful in tuning the Buffer Cache. |
|
|
Buffers scanned/sec is the number of buffers the DBWR scanned per second. The buffers scanned are on the LRU (Least Recently Used) list. |
|
|
|
LRU_scans/sec is the number of times the DBWR scanned the (Least Recently Used) buffer list per second. |
|
|
Oracle8i DBWR stats2 |
|
These counters are helpful in determining how much work the DBWR has been requested to perform. |
|
|
Timeouts/sec is the number of times the DBWR timed-out per second. The DBWR is on a three second timeout interval. If the DBWR has not been posted within a three second interval, it times out. |
|
|
|
Checkpoints/sec is the number of checkpoint messages processed by the database writer per second. Whenever a checkpoint occurs, the DBWR must be messaged (posted) to "write dirty buffers to disk". |
|
|
Oracle8i Dynamic Space Management |
recursive calls/sec |
Dynamic extension causes Oracle8i to execute SQL statements in addition to those SQL statements issued by user processes. These SQL statements are called recursive calls. If Oracle8i makes excessive recursive calls while an application is running, it may be necessary to determine the cause. Examine the recursive calls statistic through the dynamic performance table V$SYSSTAT. |
|
Oracle8i Free List |
free list waits/ requests % |
Contention for free lists is reflected by contention for free data blocks in the buffer cache. You can determine if contention for free lists is reducing performance by querying V$WAITSTAT. If the number of free list waits for free blocks is greater than 1% of the total number of requests, consider adding more free lists to reduce contention. |
|
Oracle8i Sorts |
The default sort area size is adequate to hold all the data for most sorts. However, if your application often performs large sorts on data that does not fit into the sort area, then you may want to increase the sort area size. |
If no data or Oracle8i objects appear in the Objects list of the Add to Chart dialog box, either:
The OPERF.LOG file located in ORACLE_BASE\ORACLE_HOME\DBS contains error messages about Oracle Performance Monitor for Windows NT.
To resolve this problem:
Oracle8i for Windows NT problems and other significant occurrences are recorded as events. These events are recorded in an application event log. View and manage these recorded events in the Event Viewer.
To access the Event Viewer:
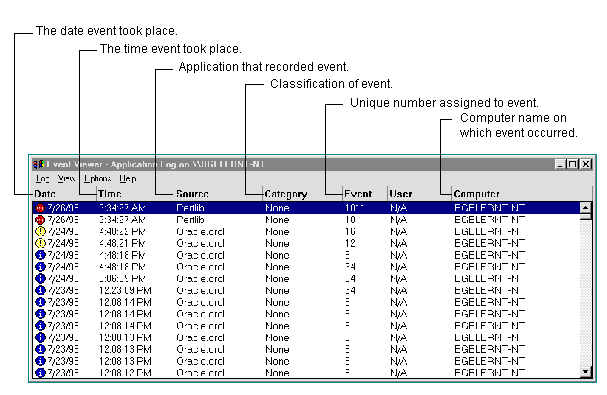
The Event Viewer window appears.
The Application view window displays the following information:

The icons beside each event determine the type of event.
Oracle8i for Windows NT events display with a source of Oracle.orcl. Oracle.orcl consists of the following event IDs:
To use the Event Viewer:
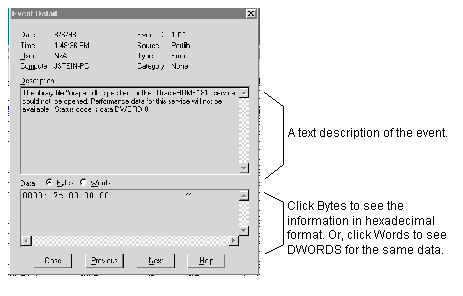
The Event Detail dialog box appears with more information about the selected event:

Setting AUDIT_TRAIL to DB or OS causes more records to be written to the Event Viewer. This can fill up the Event Viewer log file. Follow these procedures to increase the log file size.
To increase log file size:
The Event Log Settings dialog box appears.
You are returned to the Event Viewer.
Oracle8i for Windows NT background threads use trace files to record occurrences and exceptions of database operations, as well as errors. Background thread trace files are created regardless of whether the BACKGROUND_DUMP_DEST parameter is set in the INIT.ORA initialization parameter file. If BACKGROUND_DUMP_DEST is set, the trace files are stored in the directory specified. If the parameter is not set, the trace files are stored in the ORACLE_BASE\ADMIN\DB_NAME\BDUMP directory.
Oracle8i database creates a different trace file for each background thread. The name of the trace file contains the name of the background thread, followed by the extension.TRC. Sample trace file syntax includes:
where SID represents the name of the instance.
Trace files are also created for user threads if the USER_DUMP_DEST parameter is set in the initialization parameter file. The trace files for the user threads have the form ORAxxxxx.TRC, where xxxxx is a 5-digit number indicating the Windows NT thread ID.
The alert file contains important information about error messages and exceptions that occur during database operations. Each Oracle8i for Windows NT instance has one alert file; information is appended to the file each time you start the instance. All threads can write to the alert file.
For example, when automatic archiving of redo logs is halted because no disk space is available, a message is placed in the alert file. The alert file is the first place to check if something goes wrong with the database and the cause is not immediately obvious.
The alert file is named SIDALRT.LOG and is found in the directory specified by the BACKGROUND_DUMP_DEST parameter in the INIT.ORA initialization parameter file. If the BACKGROUND_DUMP_DEST parameter is not set, the SIDALRT.LOG file is generated in ORACLE_BASE\ADMIN\DB_NAME\BDUMP. Alert files should be deleted or archived periodically.
To view information on Oracle threads using the Oracle Administration Assistant for Windows NT:
|
|
 Copyright © 2000 Oracle Corporation. All Rights Reserved. |
|