| Bookshelf Home | Contents | Index | Search | PDF | |
Siebel Analytics Server Administration Guide > Setting Up Disconnected Analytics >
Defining Sourcing Reports for Disconnected Analytics
The sourcing report is an analytics query, created in Siebel Answers and stored in the Siebel Analytics Web Catalog on the network. For instructions about how to create reports in Siebel Answers, see Analytics Web Online Help. Your sourcing reports design is linked to the local database table schema and should be based on how your business is organized. For information about creating the table schema, see Design the Table Schema for the Disconnected Analytics Application
The order of the columns in a sourcing report has to match the order of columns in the table that is populated by that sourcing report. Sourcing reports can contain global filters (apply to every user) that you add to the source query. Additionally, users can choose their own filter parameters on certain columns. To allow users to choose their filters, you need to add the appropriate columns during application configuration. For more information, see Creating the Disconnected Application Configuration File.
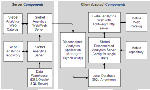
When a mobile user requests a download (synchronization), Disconnected Analytics Application Manager sends the request to the Siebel Analytics Web server. Siebel Analytics Web uses this sourcing report to query the Analytics Server, obtain data, and package it into a data set. Siebel Analytics Web returns the application data to the mobile user's disconnected database and populates the mobile database tables.
NOTE: At this time, synchronization is a one-way process only. You can download data from a network-based Siebel Analytics database but you cannot upload data from a laptop to a network-based Siebel Analytics database.
Mobile users can also request sourcing reports to be run in real time (Online) if the environment is configured to allow this. In Online processing, data sets are customized for each user based on the user's permissions and responsibilities, and then the data on each mobile user's local database is filtered for each user.
Figure 17 is a high-level illustration of how the local database tables are populated from the Web Catalog of the network-based Siebel Analytics repository.
| Bookshelf Home | Contents | Index | Search | PDF | |
Siebel Analytics Server Administration Guide Published: 11 March 2004 |