Farm Details
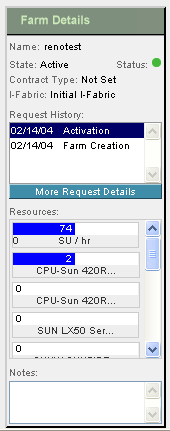
The Farm Details panel displays the name and location of the farm you select when you create a new design. You can view the resources that your farm consumes. Highlight an item from the Request History list to display the farm design. If you need more information regarding a farm request, you can click the More Request Details button to open the Farm Request Log screen. Figure 2–9 shows the farm details for a farm in the Active state. Also, you can view the farm that is associated with a request by selecting that request.
Figure 2–9 Farm Details

Table 2–3 describes the fields displayed on the Farm Details panel.
Table 2–3 Farm Details|
Field |
Description |
|---|---|
|
Name |
Indicates the farm name, for example, a department name such as engineering. The name is part of each device's domain name. Refer to DNS Naming Conventions. |
|
State |
Indicates the state of the farm, such as Design, Active, Standby, and Inactive. |
|
Status |
Shows the current status or health of the farm based on the monitors you have deployed. |
|
Shows the type of farm based on your terms of contract assigned by the administrator. For farms in the Design state, the value is “Not Set”. For more information on contract types, see Managing Contract Types. |
|
|
I-Fabric |
Indicates the I-Fabric where the farm is deployed. |
|
Request History |
Indicates the status of previously submitted farm update requests. Click a request to display the farm topology for that request. To view more details relating to a request, click the More Request Details button. |
|
Resources |
Displays the minimum and maximum limits for various resources in the farm and the current usage. These limits can be set and changed by the administrator for Active farms by changing the contract type. The display depends on various circumstances:
|
|
Notes |
Provides a place to record information about a farm. Notes is a good place to note changes and activity among multiple users of a particular farm or account. Note – Notes is the only editable field in the Farm Details panel. |
|
More Request Details |
Click this button to display the Account Request Log. |
- © 2010, Oracle Corporation and/or its affiliates
