Control Center Component Overview
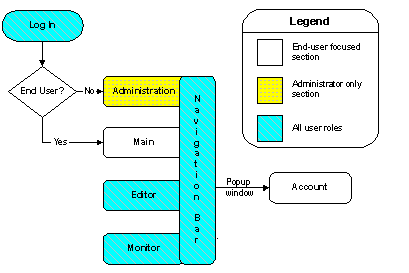
The Control Center Main, Editor, and Monitor screens require user access privileges. The Administrator screen and the N1 Provisioning Server command line interface require administrator access privileges. Figure 2–1 describes the different screens of the Control Center and the user roles required to access each screen.
Figure 2–1 Navigation Model
Main Screen
The Main screen is used primarily by end users whose management privileges and responsibilities are limited to a specific account and the related farms. This screen displays after you log into the Control Center. This screen provides a summary view of farms within the end user's account. This screen is also the starting point for various management tasks for those farms. Figure 2–2 shows the various areas of the Main screen.
You use the Main screen to do the following tasks:
-
Read news and messages
-
View farm status and configuration within an account
Figure 2–2 Control Center Main Screen
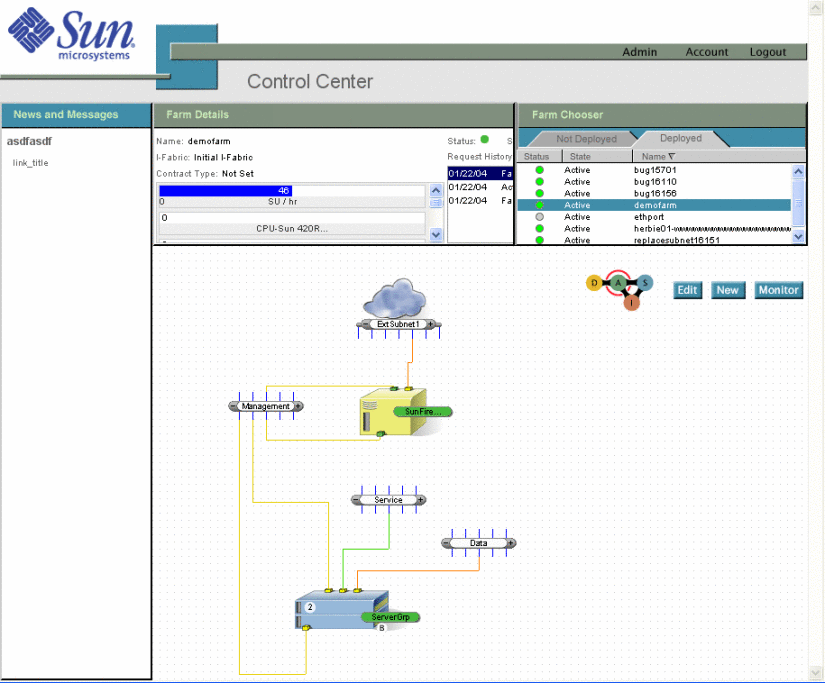
The Main screen gives you access to various features:
-
News and Messages
-
Farm Details
-
Farm Chooser
-
Farm View Area
Note –Only the latest known (stable) state of the farm is displayed in the Control Center Main screen.
News Details and Farm Details
The Farm Details and News Details window displays details of the Main screen feature with which you previously interacted. For example, if you clicked one of the items listed under the News Details previously, then the window displays the details for that item. If you clicked the Farm Chooser previously, then the window displays the farm details.
News and Messages
The News and Messages section provides links to useful information published by the administrators of the system. News and messages may be published globally or per account. When you click the link, the related article displays in the News Details section.
Note –
The Control Center administrator sets up the links in this window to provide users with a variety of information.
Farm Details
The Farm Details section displays the following information about the farm:
-
Name – The name of the farm in your account
-
State – The current state of the farm
-
Status – Monitoring feedback for the current farm displayed
-
I-Fabric – A set of managed infrastructure resources where the selected farm runs
-
Contract Type – Resource provisioning permissions for the farms and the type of contract (quota types) attached to the farm
-
Request History – The request history of the farm, that is, updates and changes to the farm
-
Resources – A graphical representation of the minimum and maximum limits and the current usage of various resources in the farm
Farm Chooser
When a new account is created and first used in the Control Center, the Farm Chooser is empty. However, after you start designing and activating farms, you use the Farm Chooser to do the following tasks:
-
View topologies that are Not Deployed and Deployed.
-
The Deployed view lists the farms that are Active or in Standby states
-
The Not Deployed view lists all other farms and includes those farms in Design and Inactive states
-
-
Check the state, status, and modification date of farms
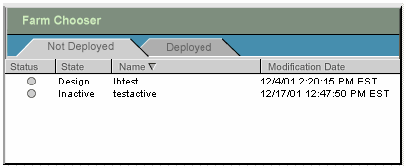
The Farm Chooser lists the farms created by all users in the same account. Figure 2–3 shows an example of the Farm Chooser window.
Figure 2–3 Farm Chooser - Not Deployed
Farm View Area
Farms selected in the Farm Chooser are displayed in the farm view area. When a selected farm is in Design state, the farm buttons that display include Edit a farm, create a New farm, and Delete a farm in Design or Inactive state. When the farm is in Active state, the Monitor button replaces the Delete button.
Note –
The Farm View Area displays a farm previously selected from the Farm Chooser every time you log on to the Control Center.
Administration Screen
You access most administrative functions associated with managing a farm from the Control Center Administration screen.
Note –
You must have administrator access privileges to use the Administration screen.
Use the Control Center Administration screen to do the following tasks:
-
Set up accounts – Organization or departmental information.
-
Set up user access controls – User roles, login name, password, and contact information.
-
Set up contract types – Create types of resource provisioning limits (quotas) for the farms associated with an account.
-
Set up news content – Provide users with information such as industry notices, system-wide network status, system-wide alerts, and system maintenance schedules.
-
Unblock farm requests to enable you to approve farm activations, deactivations, changes, and deletions.
-
Set up contract parameters to define the provisionable resource limits (quotas) for the farm.
-
List devices and I-Fabrics and associate them with each other.
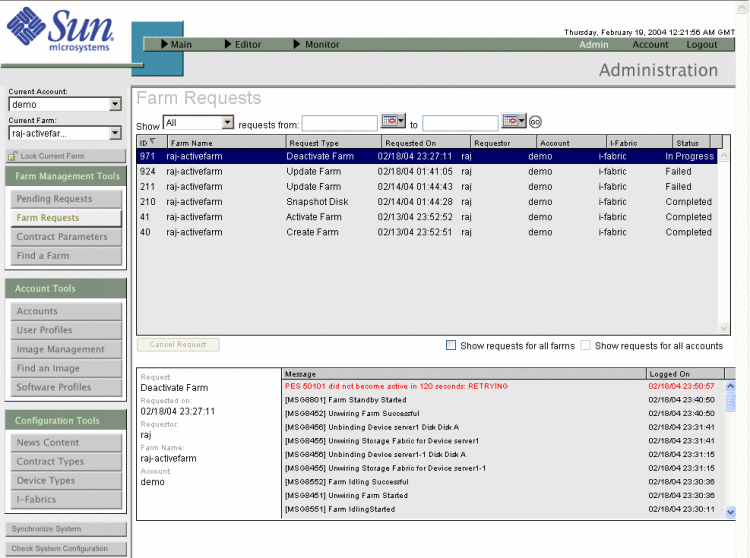
This screen contains three main sections.
Figure 2–4 Administration Screen
-
Tools bar on the left side of the screen provides direct access to all the main features of the Administration screens.
-
Navigation bar at the top of the screen provides access between User and Administration screens of the Control Center.
-
Content displays on the right of the tools bar and below the navigation bar. This area displays the contents of each screen selected from the tools bar.
Navigation Bar
The navigation bar is common to all major screens in the Control Center. Use the navigation bar to perform the following actions.
-
Toggle between the Main, Editor, Monitor, and Administration screens.
-
Toggle between farms and different screens of the Control Center.
-
Access the Support and Account sections.
-
Logout of the Control Center.
The left part of the navigation bar provides access between the Main, Editor, and Monitor screens:
-
Main – Create users and accounts and view farms in selected accounts.
-
Editor – Select a farm to view or edit from the drop-down list.
-
Monitor – Select an active farm to monitor from the drop-down list.
On the right side of the navigation bar are the following options:
-
Admin – Access to the Administration screen (only available when you are logged in with administrator access privileges)
-
Account – To manage your user accounts
-
Logout – To exit the Control Center
The active screen in the Control Center is indicated by the highlighted screen name on the navigation bar and the title displayed on the bottom right. For example, Admin is highlighted on the navigation bar and the title Administration is displayed at the bottom right corner of the navigation bar.
Tools Bar
The tools bar of the Administration screen enables you to select the current account and farm, and various administration tools to perform administrative tasks. The tools bar includes the following features:
-
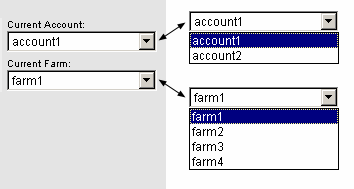
Current Selections area where you can select the current account and farm with which to work
-
Lock Current Farm option to toggle the current farm between a locked and unlocked status
-
Administration Tools area to perform various administrative tasks
-
System Buttons so you can synchronize devices and software images known to the control plane software with the Control Center software
Current Selections
In the upper left corner of the window, you can select the account and farm associated with the account with which to work.
-
Current Account is used as the default account for all administration tasks. The selected current account gives you the ability to access all farms in the account.
-
Current Farm is the default farm displayed when navigating to other sections of the Administration screen. For example, the farm selected in the Current Farm is the default when options under the Farm Management Tools is selected.
Figure 2–5 Current Selections
Lock Current Farm
As an administrator, you can use the Lock Current Farm option to prevent others from modifying a farm as long as you have the farm locked. With this feature, you toggle the current farm between the locked and the unlocked state. When you lock (and unlock) the farm, you must enter and confirm a password that is specific to that lock. If you forget your farm lock password, you can reset the password by using the command-line interface.
This function is applied only to farms that are in the active state.
Modifying Current Farm
The Control Center is a multi-user application. Hence, any user can edit any farm, user, or account at any time if the user has permission to do so. If two users make a change to the same farm, user, or account at the same time, the changes that the first user saves are applied. The second user to save changes is given the opportunity to overwrite the change by the first user. Otherwise, the second user's changes are discarded.
Administration Tools
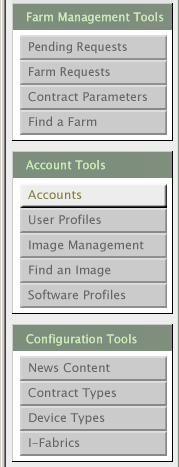
The features of the Administration section are grouped into three categories, as shown in the Administration Tools area of the Control Center window in Figure 2–6.
-
Farm Management Tools, for managing server farms.
-
Account Tools, for managing accounts.
-
Configuration Tools, for configuring basic features of the application.
Figure 2–6 Administration Tools
System Buttons
The Control Center window contains two system buttons, as described in the following list.
-
Synchronize System is used for synchronizing devices and software images that are known to the control plane with the Control Center application.
Note –Click Synchronize System whenever you add devices to an I-Fabric or when you add or change global software images using the command-line interface. Also synchronize system after you add a new I-Fabric.
-
Check System Configuration is used for validating I-Fabric configurations during the N1 Provisioning Server software installation.
Also check the system configuration each time you change a configuration parameter, such as the connector or an IP address. A dialog box displays the validation information for the system configuration and any error messages. Depending on the error that occurred, make the appropriate corrections, then check the system configuration again to ensure that the correct adjustment was made.
Editor Screen
The Editor is used by administrators and end users. You use the Editor to do the following tasks:
-
Design a new farm
-
Import a farm
-
Export a farm
-
Configure a farm
-
Activate a farm
-
Modify a farm
-
Copy a farm
-
Save a farm
-
Deactivate a farm
-
Standby a farm
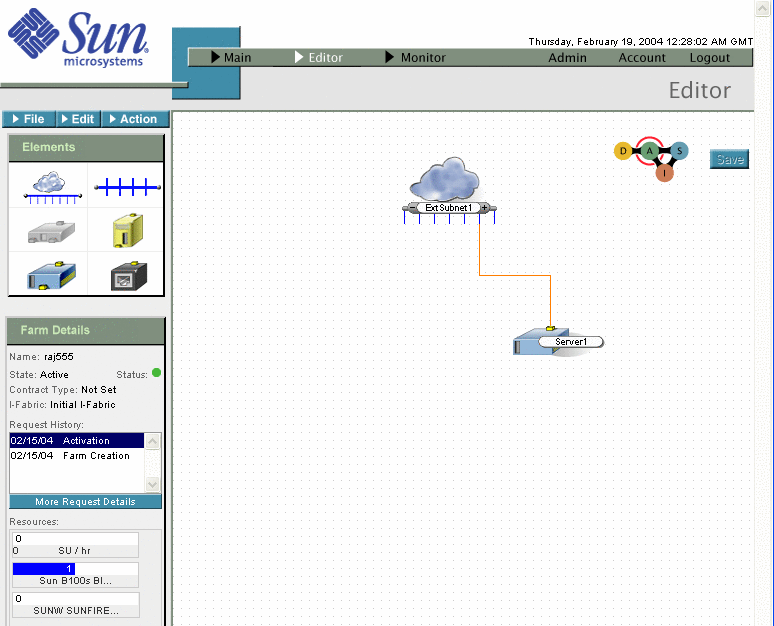
Figure 2–7 shows an example of the Editor screen.
Figure 2–7 Editor Screen
Note –
In the Editor screen, the farm view area is where you assemble, connect, and configure farm elements.
This section describes various components of the Editor and their usage:
-
Menus
-
Farm Elements Palette
-
Farm Details
-
Farm Lifecycle element
Menus
There are three menu option buttons in the Editor. The menus for a farm in Design state are File, Edit, and Submit.

Note –
This menu changes depending on the state of the farm.
Submit - Click Submit to submit a completed farm design for validation.
The following table describes the File options:
Table 2–2 File Menu Options|
Options |
Description |
|---|---|
|
Click Open to display the Open Logical Server Farm dialog box. Select a farm from a filtered list, for example, All, Design, Active, Standby, and Inactive. |
|
|
Click Save to save a new farm or save changes to an existing farm. If the farm does not have a name, you are prompted to provide one. |
|
|
Click SaveAs to save an existing farm as a new design. This is useful for using an existing farm as a template for creating new farm designs. |
|
|
Click Delete to delete a farm in Design state or Inactive state. The following message displays. You are about to permanently remove the current farm. Proceed? Click OK to proceed. |
|
|
Click Rename to change the name of current farm. Only farms in the Design state can be renamed. |
|
|
Click Summary to view a textual summary of farm elements and their configurations. |
|
|
Import |
Click to Import a farm. See How To Import a Farm. |
|
Export |
Click to Export an existing farm. See How To Export a Farm. |
The following table describes the Edit options.
Farm Elements Palette
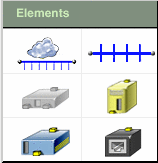
The Elements palette, available for farms in the Design and Active states, is a set of devices and networking components: External Subnet, Subnet, Load Balancer, Server, and Ethernet Port Connection.
Figure 2–8 Elements Palette
Note –
The Control Center cannot be used to configure Firewalls. This element is disabled. See Configuring Unmanaged Devices for information about using the Ethernet Port Element to represent unmanaged devices such as firewalls.
Farm Details
The Farm Details panel displays the name and location of the farm you select when you create a new design. You can view the resources that your farm consumes. Highlight an item from the Request History list to display the farm design. If you need more information regarding a farm request, you can click the More Request Details button to open the Farm Request Log screen. Figure 2–9 shows the farm details for a farm in the Active state. Also, you can view the farm that is associated with a request by selecting that request.
Figure 2–9 Farm Details
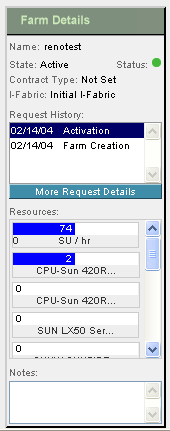
Table 2–3 describes the fields displayed on the Farm Details panel.
Table 2–3 Farm Details|
Field |
Description |
|---|---|
|
Name |
Indicates the farm name, for example, a department name such as engineering. The name is part of each device's domain name. Refer to DNS Naming Conventions. |
|
State |
Indicates the state of the farm, such as Design, Active, Standby, and Inactive. |
|
Status |
Shows the current status or health of the farm based on the monitors you have deployed. |
|
Shows the type of farm based on your terms of contract assigned by the administrator. For farms in the Design state, the value is “Not Set”. For more information on contract types, see Managing Contract Types. |
|
|
I-Fabric |
Indicates the I-Fabric where the farm is deployed. |
|
Request History |
Indicates the status of previously submitted farm update requests. Click a request to display the farm topology for that request. To view more details relating to a request, click the More Request Details button. |
|
Resources |
Displays the minimum and maximum limits for various resources in the farm and the current usage. These limits can be set and changed by the administrator for Active farms by changing the contract type. The display depends on various circumstances:
|
|
Notes |
Provides a place to record information about a farm. Notes is a good place to note changes and activity among multiple users of a particular farm or account. Note – Notes is the only editable field in the Farm Details panel. |
|
More Request Details |
Click this button to display the Account Request Log. |
Session Expiration Checking
The Editor verifies that your login session has not expired before launching any dialog boxes. Your session time-out occurs after a specified period of inactivity (for example 30 minutes) which is configured by the administrator. The default is 120 minutes. You are prompted to log in again. after you log in again, you are allowed to continue with your tasks.
Tracking Change
All changes you make in the Editor are only local in your web browser until you save the farm. When required, you can discard any changes to your farm by navigating away from the Editor, by reloading the current farm, or by loading a new farm.
If you make unsaved changes and you attempt to navigate away from the Editor, you receive a warning message that you are about to lose unsaved data.
Viewing Farm Details
You can view the request history of a farm and view the farm that was associated with each request from the Main, Editor, and Monitor screens as shown in Figure 2–10.
Figure 2–10 Farm Details Panels in Main, Editor and Monitor Screens
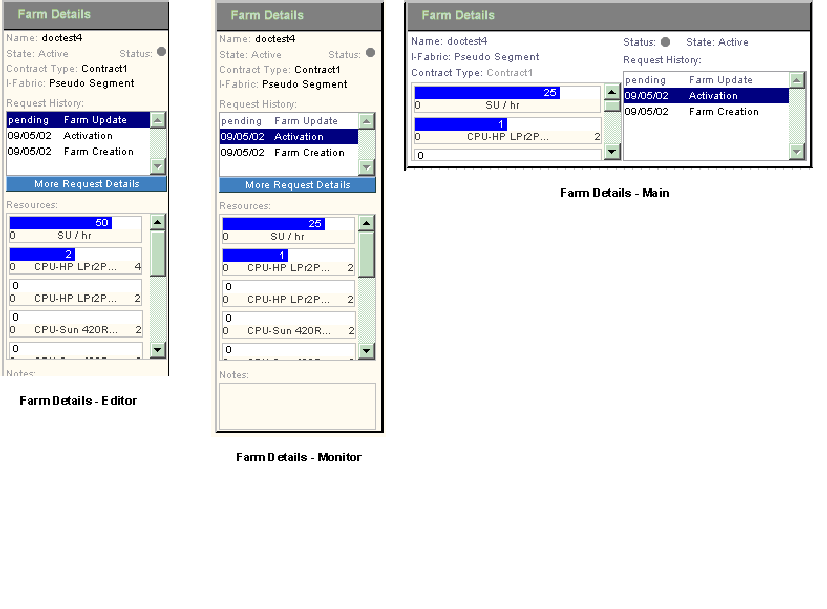
The Main, Editor, and Monitor screens enable you to see into the request queue for each farm. The Editor enables you to view the farm topology that is associated with the request.
Viewing the Account Request Log
Because users do not have access to the Farm Request option in the Administration screen, by viewing the Account Request Log users can keep track of and follow up on any of their farm update or action requests.
The Account Request Log also enables users to monitor jobs or tasks that are queued and waiting for the software automation, for example, snapshot, flex, and so on. Refer to Creating an Account Image By Using Snapshot and Adding and Removing Computing Resources from a Farm for more information on these topics.
Each request is processed in the order that the request is received. In some cases, problems in carrying out a specific task can stall the processing of subsequent requests. Users can use this feature to understand the current progress on their update request.
 How to View the Account Request Log
Steps
-
On the Main screen, click Account in the Navigation bar.
-
On the Account screen, click the Account Request Log tools bar button.
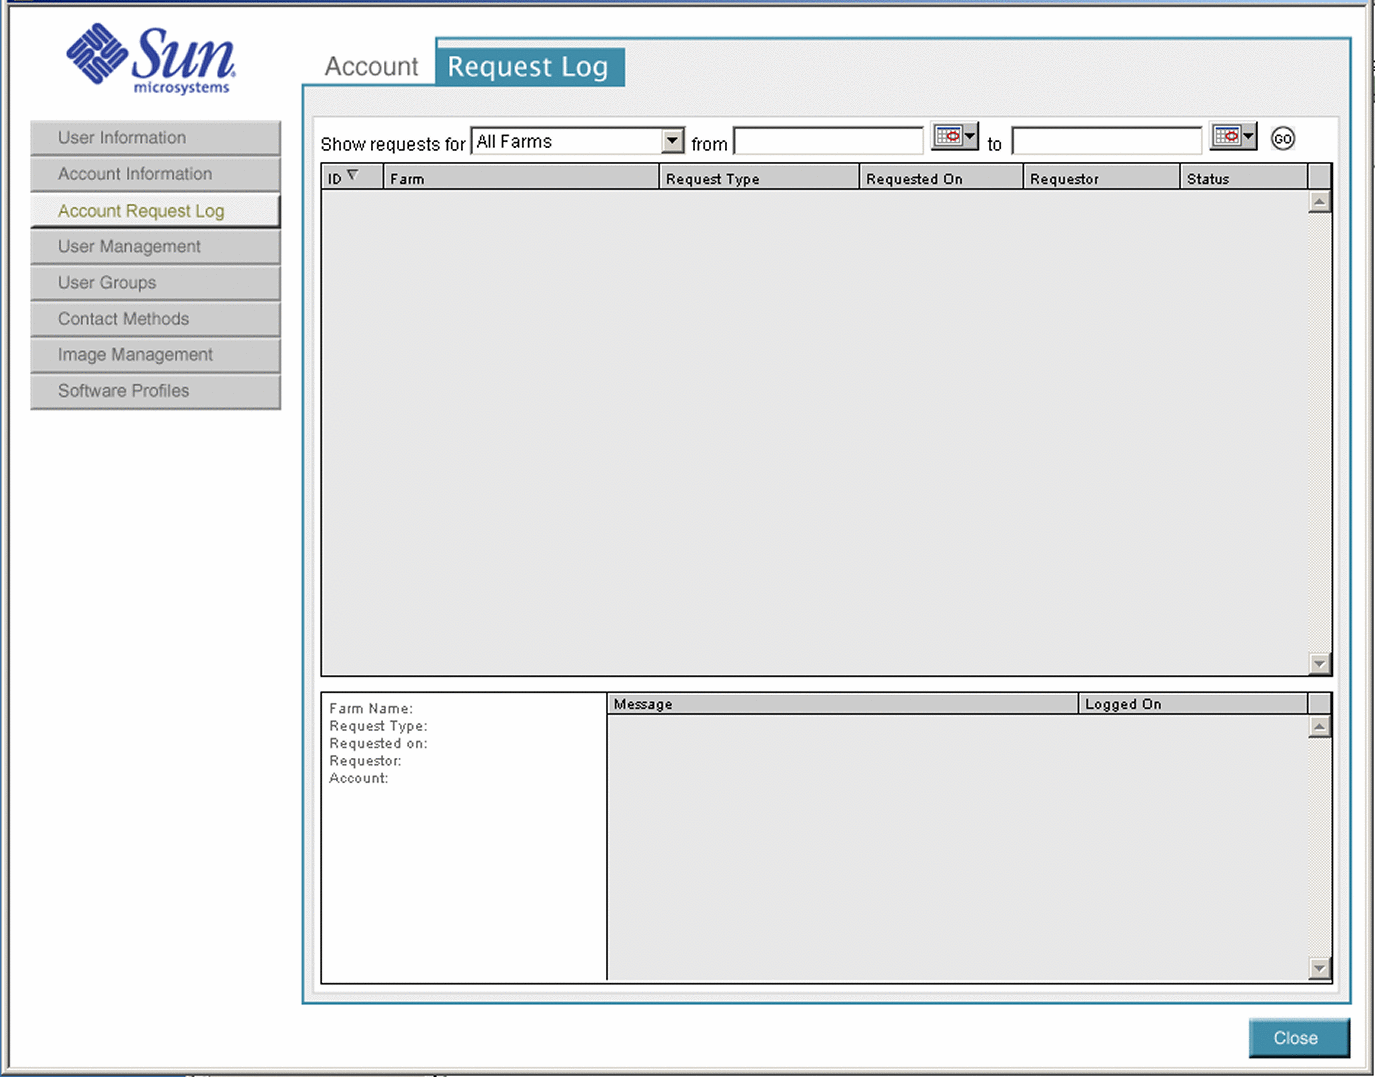
The Request Log screen appears as shown in Figure 2–11.
Figure 2–11 Account Request Log
-
Select the desired farm from the Show Request For field.
-
Select a From date and a To date to view all the requests within a date range.
-
Click Go to display the information.
Viewing Pending Farm Requests
The Pending Requests screen lists farms for which users have requested a state change. This screen displays a list of farms that are awaiting a state change. View the Pending Requests screen by clicking the Pending Requests button on the tools bar in the Administration screen of the Control Center.
You can sort pending requests in the following ways by clicking on the appropriate column heading:
-
All pending requests in all I-Fabrics
-
All pending requests in selected I-Fabric
-
Blocked pending requests in all I-Fabrics
-
Blocked pending requests in selected I-Fabric
-
In progress requests in all I-Fabrics
-
In progress requests in selected I-Fabric
The Pending Transition screen displays the listed properties.
Table 2–4 Pending Transition Screen Properties|
Property |
Description |
|---|---|
|
ID |
Farm ID |
|
Farm |
Farm name |
|
Requested Type |
The type of request. For example, a request could be to change a farm state or create an image. |
|
Requested on |
The date on which the request was made |
|
Requestor |
The user name of the requestor |
|
Account |
Account name associated with that farm |
|
I-Fabric |
The I-Fabric in which the farm resides |
|

|
Indicates a blocked request |
|

|
Indicates a high priority and is set by using the command-line interface. See Chapter 6, Troubleshooting for details. |
|

|
Indicates a critical request and is set using the command-line interface. See Chapter 6, Troubleshooting for details. |
Viewing the Farm Request Screen
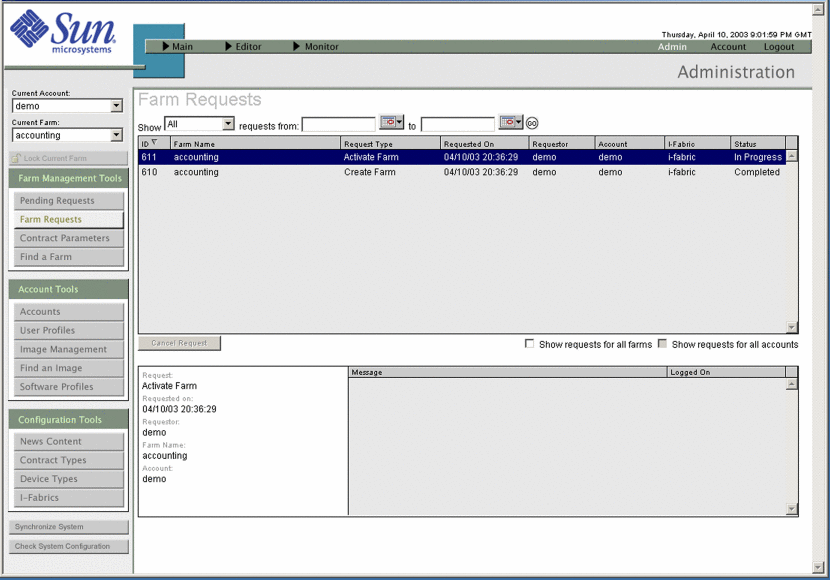
The Farm Request screen displays a history of farm requests. Access this screen by clicking the Farm Requests tools bar button from the Control Center Administration screen. You can filter the query to display farm requests in the following ways:
-
By farm or date range
-
All requests
-
In progress requests
-
Blocked requests
-
Completed requests
-
Cancelled requests
-
Queued requests
You can sort the resulting list by property by clicking the column heading. The following figure shows an example of the Farm Requests screen.
Figure 2–12 Farm Requests
Viewing Active Farms
After your farm design is activated, the state of the farm transitions to Active and the farm appears in the list of Deployed farms on the Main screen.
 How To View the Active Farm
Steps
-
Open the Main screen.
-
Click the Deployed tab in the Farm Chooser from the Control Center Main screen as shown in Figure 2–13:
Figure 2–13 Farm Chooser
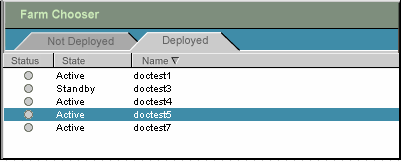
-
Select the desired farm to display.
The lifecycle icon indicates the farm state.
The farm opens automatically in the Main screen. The farm is available immediately after the farm is activated.
Viewing a Farm Summary
After you create a new design and start building a farm, the Control Center provides you with a textual summary of farm elements and the farm configuration. The farm summary reflects the most recently completed change that you have made to the farm.
For farms in the Active state, the Control Center updates items such as subnet masks, IP addresses, and fully qualified domain names (FQDNs) according to the information you input when you configure the elements. You can view this textual summary of the entire configuration of a farm.
The summary screen displays the following information:
-
A high-level overview of the farm configuration
-
In-depth configuration details for each element in the farm
-
A complete listing of IP addresses and FQDNs for each subnet
Note –You can also view the configuration of individual elements in the Main, Editor, and Monitor screens by right-clicking the elements and selecting the option to view configuration. Refer to the section Viewing Element Configuration for details.
You can print a farm summary through the print function in your browser.
Summary of Farm Configuration
The summary of farm information includes:
-
Farm name
-
Farm state
-
Total number of each type of element in the farm
-
Total number of each type of device in the farm
-
User notes for the farm
-
Configuration information for each element
Element Configuration Details
The following table lists the summary of information displayed for each farm element and device:
Table 2–5 Elements Configuration Details
 How To View a Farm Summary
Steps
-
On the Admin screen, click Editor in the Navigation Bar and choose the desired farm from the Editor drop-down list.
The Editor screen appears.
-
Choose Summary from the File menu.
The Farm Summary appears.
Viewing Element Configuration
After a farm is active, the Control Center displays items such as subnet mask and IP addresses to reflect the specifics of the live farm. You can view the following details on individual element configurations:
Table 2–6 Element Configuration
You can view configuration on the Main, Editor, and Monitor screens.
 How To View Element Configuration
Steps
-
Open the active farm in the Main, Monitor, or Editor screens.
-
Right-click the element.
A pop-up menu appears
In Main and Monitor
In Editor


-
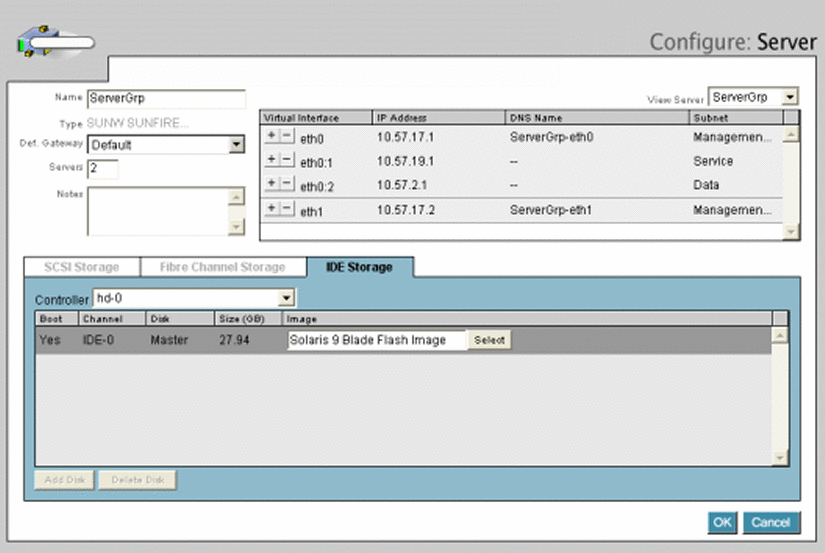
Select View Configuration (Main) or Configure (Editor) to display the following configuration screen.
Monitor Screen
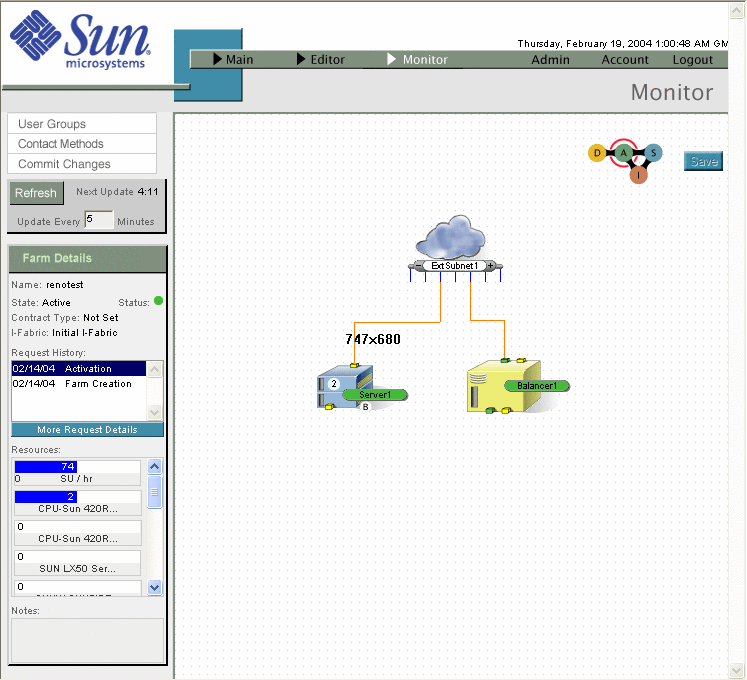
The Monitor screen is used by administrators and end users. Monitoring is the mechanism used to ensure that the elements that are associated with the farms are behaving as expected. Every element in the farm is monitored to ensure network connectivity and basic responsiveness of the device. In addition, servers contain a special monitoring agent that enables you to configure monitoring beyond that of basic network connectivity.
The monitor component gives you various options for setting up and controlling the monitoring of your farm element. Figure 2–14 shows an example of the Monitor window.
The monitoring component of the Control Center enables you to do the following tasks:
-
Configure server specific monitors
-
Configure visual and email-based alarms
-
View the time-based status of the monitors
Monitors and alarms can be edited in the Configure Monitor dialog box or the Configure Alarm dialog box. You can reach dialog boxes through the Monitor screen.
Note –
Only the latest known (stable) state of the farm is displayed in the Control Center Monitor screen.
Figure 2–14 Monitor Screen
Monitor Option Buttons
The Monitor option buttons located at the left side of the Editor area enable you to perform various operations in the Monitor. The User Groups and Contact Methods buttons are displayed only if you have account manager or administrator privileges. The Monitor buttons include the following options:
|
Option |
Description |
|---|---|
|
User Groups |
Enables you to group users for automatic notification of monitoring alarms. This button links to an option in the Accounts area and launches a separate window. |
|
Contact Methods |
Enables you to set up lists of groups and preferred methods of contact for monitoring alarm notification. This button links to an option in the Accounts area and launches in a separate window. |
|
Commit Changes |
Saves any monitor or alarm changes, causing them to be uploaded and deployed for monitoring. This action commits the changes made since the last commit and generates a farm update request. |
Clicking Commit Changes can cause a disruption in monitoring while the changes are applied, because the update can take a while to be applied. Do not click Commit Changes twice because this action sends another update. Entries made in the various monitor and alarm windows and dialog boxes are recorded as you make them, but they are not saved until you click the Commit Changes button on the Monitor screen.
- © 2010, Oracle Corporation and/or its affiliates
