MySQL Enterprise subscription, MySQL Enterprise Monitor, MySQL Replication Monitor, and MySQL Query Analyzer are only available to commercial customers. To learn more, see: http://www.mysql.com/products/enterprise/features.html.
The purpose of the MySQL Enterprise Dashboard is to provide you with
information about your MySQL servers. It provides a list of the
latest MySQL Enterprise Advisor reports, server status information,
MySQL Enterprise alerts, and updated views of monitored MySQL
servers. The Monitor screen gives a quick
overview of the status of your MySQL servers.
The MySQL Enterprise Dashboard interface is provided through a standard web browser. For more details on the supported browsers, see Section F.2, “Supported Browsers”.
You can open the Dashboard and connect to the MySQL Enterprise Dashboard either
using the standard HTTP protocol, or using an SSL connection
(HTTPS). By default, you can connect to MySQL Enterprise Dashboard using
http://,
where host:18080host is the hostname or IP address of the
MySQL Enterprise Service Manager. The default SSL URL is
http://.
These values can be overridden during installation. You can check
the configured values by looking at the
host:18443configuration_report.txt file within your
installation directory.
If you are connecting using SSL, the built-in certificate has been self-signed and may be highlighted as 'unsafe' within the browser on initial connection. You should add an exception for the certificate on this server to prevent problems accessing the site.
The Monitoring page provides an instant health check for all of the MySQL servers across the enterprise.
From this page users can:
View monitoring data and all critical MySQL Advisor Rule violations for all or selected servers.
Close and annotate MySQL Advisor Rule violations.
Quickly determine if there is a Monitor Agent that is not communicating with the Service Manager.
Quickly determine if there is a server that is in trouble or completely down.
View indicator value graphs for key MySQL and operating system (OS) level metrics. Graph presentation will default to a thumbnail view but will open into a larger image upon being clicked.
The monitored server or servers are displayed in a tab on the left
known as the Server Tree. You can navigate to a
number pages that provide more detailed information. These pages
include:
Monitor: The overview page providing you with a quick summary of the servers, their status, events, availability and load. The remainder of this chapter details the contents of this page.Advisors: Shows the various advisors configured in your installation and allows you to schedule their execution on different servers, apply and manage rules and manage the advisor installation itself. For more information, see Chapter 6, The Advisors Page.Events: Provides an interface into the event system that highlights specific issues and problems on your monitored servers. For more information on using Events, see Chapter 7, The Events Page.
Query Analyzer: Interfaces to the query monitoring system that can be used to monitor and track the individual queries that are being executed on a system and help to highlight problem queries that may need optimization or that may be affecting server load. For more information, see Chapter 9, The Query Analyzer Page.Graphs: Enables you to view and configure a number of individual graphcs covering a range of different statistics. For more details on how to view and use these graphs, see Chapter 8, The Graphs Page.Replication: Provides information on the status and structure of your servers that are using replication. This page is only available if you have a suitable subscription level. For more information, see Chapter 10, The Replication Page.Settings: Controls the settings for the server, including email configuration, passwords, and server and user management. For more information, see Chapter 5, The Settings Page.
Graphs are shown in the center of the page beneath the tabs. If applicable, you'll also find a list of critical events.
On the right is the color-coded Heat Chart,
showing the advisors that are installed by default. The
Heat Chart shows the most important advisors,
allowing a quick overview of the state of your servers. You may open
the Heat Chart in its own window by clicking the
Standalone Heat Chart link. If applicable, you'll
also find a list of critical events.
The Show/Hide Legend link toggles display of the
key to the icons used in the Heat Chart.
Find colorblind-accessible icons in the
alternate directory. On Linux this directory
is immediately below the
/monitor/apache-tomcat/webapps/ROOT/web/resources/images/
directory. These images are stored in the same directory on
Windows. To use them, backup the originals and then copy and paste
the alternate set into the images directory.
If a specific server is selected in the Server
Tree details about this server are shown beneath the
legend in the Meta Info area. The information
shown in this area is the host name, the MySQL version number, the
number of scheduled rules, the operating system, and the CPU.
The Meta Info section also shows how long the
agent has been running, when it last contacted the MySQL server it
is monitoring, and the last time the agent contacted the dashboard.
Mouse over the date shown beside Up Since and a
pop-up box displays the time that has elapsed since the server
instance was last started. You can also mouse over the
Last MySQL Contact and the Last Agent
Contact dates.
In the case of remote monitoring, the agent runs on a different
machine than the MySQL server that it is monitoring. The
Hostname, MySQL, and
Rules information applies to the system being
monitored. The OS and CPU
information applies to the machine on which the agent is running.
For more information about remote monitoring see,
Section 2.3.6.4, “Configuring an Agent to Monitor a Remote MySQL Server”.
The top of the screen shows the refresh cycle and
Help and Log Out links. Click
the Help link to open the documentation in a
separate browser window. Choose Log Out if you
wish to leave the Dashboard or to log in as a different user.
Different refresh rates are available from the drop-down listbox.
In the footer are external links to MySQL Enterprise and information about the current user. Users can remain connected to the Dashboard and update their subscription, use the Enterprise Knowledge Base, and contact technical support. Your subscription information is also displayed here, showing the number of days remaining and the number of licenses. The number of licenses indicates to the number of machines that may be monitored; any number of MySQL servers may be running on a specific machine.
The footer also contains a link to the Settings
page. If your subscription is current it reads
Subscription is up-to-date. More info..... For
more information about the Settings page see
Section 5.7, “The Product Information Screen”.
The tab on the left displays the Server tree. By default the first
group of servers is selected. This selection determines the
information shown on the Monitor page.
If a server group is selected, the information presented on the
Monitor page is aggregate information for this
group; if only one server is selected the information applies to
that server only.
Change your server selection and the information shown in the
graphs and in the Heat Chart changes.
For more information about server groups see, Section 5.3.2, “Grouping Servers”.
The individual server, or server group, selected in the Server
Tree also determines what information appears when the
Advisors tab or the Events
tab is selected.
The Server Tree presents an easy way to navigate to different groups or to specific servers.
The center of the Monitor page gives a visual
representation of the state of your servers.
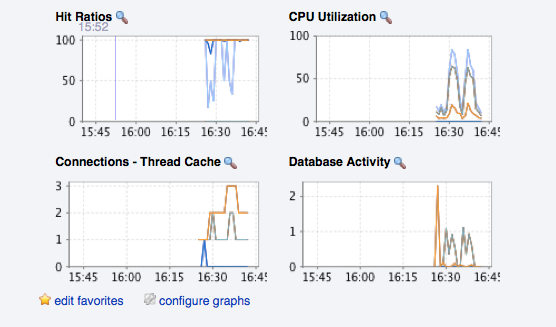
The graphs present information about the currently selected server or server group. The default graphs show the hit ratios, CPU utilization, connections, and database activity for a specific interval.
Graphs also provide an entry point for examining the operations on a server in relation to the queries that were being on the server at the time. The plots of the graph are correlated with the queries that are being executed at that time, enabling you to monitor your server usage more effectively. By clicking and dragging on a graph you can zoom in on the graph content and then view the queries that were being executed during the specified period to gain a better insight into the operation of your servers. This information is only available if you have configured query analysis, and have enabled query analysis for the servers you are monitoring. For more information, see Chapter 9, The Query Analyzer Page.
To set the interval click the configure graphs
link immediately below the graphs. This opens a dialog box where
you can choose the default interval for the x-axis of the graphs.
Defining a shorter or longer interval gives you a shorter or
longer term view of server activity. The thumbnail and full-size
graph dimensions can also be adjusted from this dialog box. Save
any changes that you have made and the values chosen will be the
defaults whenever you log in.
You can also choose the default graphs shown on the
Monitor page. To do this click the
edit favorites link and choose the graphs you
want from the drop-down list box. To choose contiguous graphs,
hold down the Shift key and click the desired
graphs. For a noncontiguous selection, click the desired graphs
while holding down the Ctrl key. The maximum
number of graphs that can be displayed on the
Monitor page is six. Save your changes and
these will be the default graphs whenever you log in.
Color coding helps distinguish different aspects of each graph.
With Database Activity for example, you can
readily distinguish SELECT statements from
database insertions.
Clicking a graph opens a detailed view with Graph
Display and Configure tabs. Choose
the Configure tab to temporarily change the way
that a graph displays. Changes made from this tab only apply to
the standalone graph while it is open. Persistent changes are made
as described above.
Dismiss the enlarged graph by clicking the button.
Alerts from the event system will be displayed immediately below the charts. For more information on the events display, see Chapter 7, The Events Page.
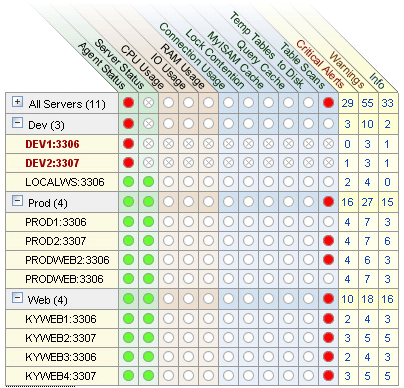
The Heat Chart is found on the right side of
the Monitor page and shows the status of
critical rules. Monitored servers are organized by groups. To view
the status of a specific server, click the
button next to the appropriate server
group.
Whenever a new agent contacts the Service Manager for the first time, all the rules in the Heat Chart Advisor are automatically activated. These Advisors monitor the status of the server and agent, critical operating system indicators, and important events related to your MySQL servers. An example follows.
To interpret the Heat Chart see the following legend.
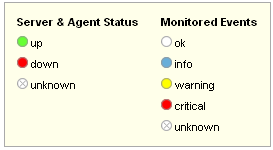
The status unknown will typically apply when an
agent is down and can no longer report the status of the server
that it is monitoring. The status unknown may
also apply if the data collection that should be collected is not
available on the server being monitored.
You may open the Heat Chart in its own browser window by clicking
the Standalone Heat Chart link immediately
below the Heat Chart on the left. If you like,
the refresh rate can be set to a different rate than the setting
on the Monitor page.
In addition to showing the most important advisors, the
Heat Chart also has columns that display the
number of critical, warning, and informational alarms. Clicking
the hyperlink in any one of these columns takes you to the
Event screen, which gives more detailed
information. For more information about events see,
Chapter 7, The Events Page.
When the Dashboard is first installed no notification groups are associated with the Advisors shown in the Heat Chart. For more information on this topic see, Section 2.2.7.3, “Installing Advisors After Initial Log-in” and, Section 5.5, “Manage Notification Groups”.