 Understanding Compensation Strategy
This chapter provides an overview of Compensation Strategy and discusses how to:
Set up a workforce simulation rule
Set up a compensation planning scenario
Review and analyze a compensation planning scenario
Alter compensation planning scenario results with Analytic Calculation Engine
Approve compensation planning scenario output
Understanding Compensation Strategy
This section provides an overview of the Workforce Rewards Compensation Strategy and discusses:
Compensation strategy definition
Compensation Strategy business process
Market compensation rates
 Overview
The Compensation Strategy module provides tools to review and analyze the total compensation costs and strategies for your workforce. With Compensation Strategy you can automate and streamline the performance of these compensation strategy tasks:
Use data extracted from multiple sources.
Define compensation rules for any type of compensation, such as base pay, variable compensation, or benefits compensation.
Create scenarios of your organization's job growth and reduction, or headcount plans.
Create and analyze multiple compensation scenarios involving combinations of compensation types, such as base pay, variable compensation, and benefits compensation.
Evaluate the impacts of these scenarios on compensation distribution, costs, and value.
Once you've identified the scenarios with the desired results, approve the results of your efforts.
You also utilize a wealth of data in the process. Compensation Strategy integrates data from a variety of sources, such as:
Workforce compensation data from internal transactional database systems, such as HRMS.
Market rates developed with the Market Compensation module.
Base pay structures developed with the Base Pay Structure module.
Employee retention and reduction data from the Retention Strategy module.
Key performance indicators (KPIs) from Scorecard and Workforce Scorecard.
You use the Compensation Strategy module to generate differing scenarios of base and variable compensation plans, as well as any other cost-related plans (such as benefits). We designed the module around two main Application Engine processes, Workforce Simulation (WA_WFS) and Compensation Planning & Simulation (WA_CPS).
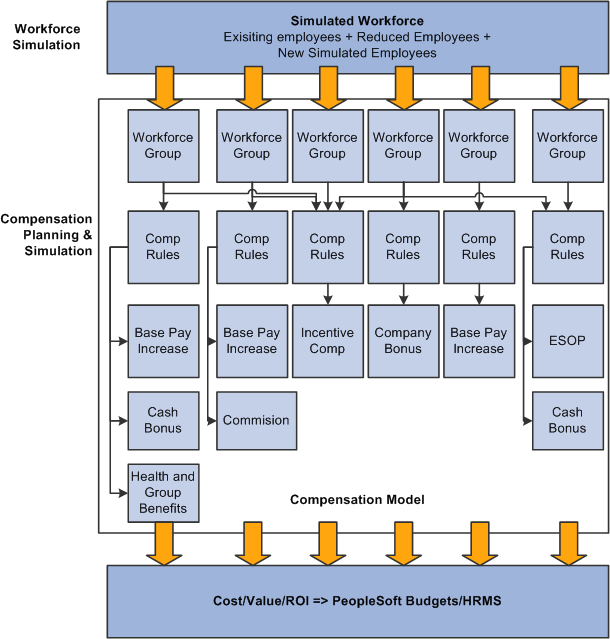
Conceptual relationship between Workforce Simulation and Compensation Planning and Simulation
Compensation Strategy Definition
Before you begin using the Compensation Strategy module, take some time to formulate the questions that you want to answer. The types of questions to consider fall into two broad categories:
What is your organization's overall compensation strategy? What changes in the existing compensation system would you like to model, to assess their effects?
How can you best use Compensation Strategy to generate scenarios to evaluate and answer these questions?
One part of understanding your organization's compensation strategy involves knowing what pay components, target pay rates, and pay ranges to apply to various jobs. It also involves understanding your organization's ongoing efforts to attract and retain the right people with the necessary skill levels. Once you have this background you are ready to use Compensation Strategy to perform tasks such as:
Model the changes from a proposed salary or compensation reorganization, based on market values, to evaluate the cost of moving your workforce up to market levels.
Create new types of variable compensation to help motivate your workforce, and evaluate the cost impact.
Target special compensation plans for specific groups of employees, such as executives, salespeople, or workers with mission-critical job skills.
A second part of understanding your organization's compensation strategy involves knowing how the overall compensation strategy cycle is executed, and knowing at what point in the cycle your organization is at a any given time. Equipped with this knowledge, you can use Compensation Strategy to perform these types of tasks:
Model compensation cost changes based on forecasted workforce growth and reduction.
Establish a merit matrix or other rules for pay out of annual base pay increases.
Determine what types of performance goals or related pay out rules you need for any base compensation or variable compensation types in the compensation plan.
Examine the compensation cost effects based on organizational performance indicators, for periodic bonuses and so on.
Set proposed compensation budgets for departments or business units.
Allocate compensation pools across organizations, special classifications, groups, and individuals.
Another part of your strategy involves understanding how to best use Compensation Strategy. You have these options:
Set up and run Compensation Planning and Simulation (CPS) as a Historical process, using your existing workforce. This means having no inputs from Workforce Simulation.
Set up and run CPS as a Forecast process, using input from Workforce Simulation, or Retention Strategy, or both, to include simulated changes to your workforce in the scenarios. Follow the retention or workforce simulation results through the completion of the CPS process, and evaluate the cost impacts of your retention, growth, and reduction decisions.
Set up and run CPS with or without including existing base salary in the compensation rules. This means you can either evaluate the total compensation impact of a scenario, or focus only on the change introduced by new rules.
Compensation Strategy Business Process
The following diagram outlines the main steps in the Compensation Strategy business process.
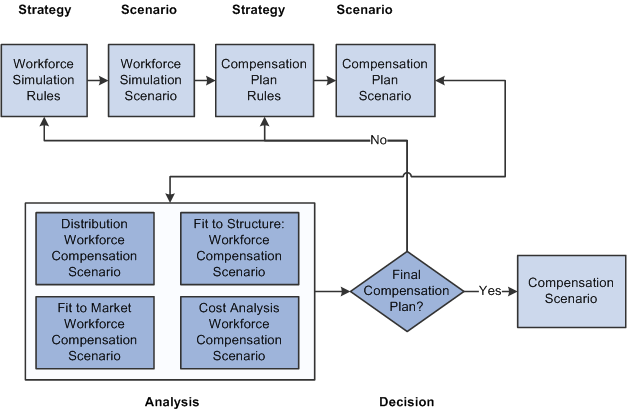
Compensation Strategy business process
Market Compensation Rates
If you plan to use market rates to help you develop and evaluate compensation scenarios for your workforce, make sure you have completed the steps needed to import compensation survey data, and define market compensation rates.
If you plan to use new base pay structures to help you develop and evaluate compensation scenarios for your workforce, make sure you have completed the steps needed to develop new base pay structures.
See Also
Setting Up Workforce Simulation
To set up workforce simulation, use the WA_CP_WFSIM_DFN.GBL and WA_WFS_MODL_TBL.GBL components.
This section provides an overview of workforce simulation and discusses how to:
Set up workforce groups.
Enter workforce simulation growth and reduction rules.
Set up model IDs for workforce simulation.
Define a workforce simulation model.
Set up a workforce simulation scenario definition.
Set up the process run control for the Workforce Simulation process.
Run the Workforce Simulation process.
Review your workforce simulation scenario setup.
Understanding Workforce Simulation SetupThe Workforce Simulation process serves as a basis for input to the Compensation Planning and Simulation process. The inputs for the Workforce Simulation process are workforce growth and reduction rules, which define your workforce strategy. Run the Workforce Simulation process to generate a simulated workforce, consisting of your existing employees plus any new simulated employees and reduced employees (employees to be removed from your workforce). In the end, the result is a simulated workforce based on assumptions for growth and reductions for a given time period. The output is stored in the WA_JOB_S00 table. WA_JOB_S00 is identical to the JOB_F00 table, with SCENARIO_ID added as a key field. Use this simulated workforce in forecast scenarios in Compensation Strategy.
Before you begin working with Workforce Simulation, think about the questions that you want to answer. The questions you ask dictate your strategy for the workforce simulation and compensation rules you create. They also dictate your strategy for which modules and processes to run, and in what sequence to run them. For example, do you want to run the Retention Strategy module first, to generate lists of employees to reduce and retain, and use them in the Workforce Simulation? If you do, then you can follow the retention results right on through to the completion of the Compensation Planning and Simulation process, and evaluate the cost impacts of your retention decisions.
To set up your workforce simulation strategy complete the following steps:
Set up workforce groups.
Enter growth and reduction rules.
Set up a Model ID.
Use the rules to define a workforce simulation model.
Set up a scenario ID.
Run the Workforce Simulation process.
Review the workforce simulation scenario
Pages Used to Set Up and Run Workforce Simulation|
Page Name |
Definition Name |
Navigation |
Usage |
|
Workforce Simulation Rule |
WA_CP_WFSIM_DFN |
Workforce Analytics, Compensation Strategy, Workforce Simulation, Setup Simulation Rules, Workforce Simulation Rule |
Enter growth and reduction assumptions for your workforce, which you can use to run a workforce simulation scenario. |
|
Workforce Simulation Model |
WA_WFS_MODL_TBL |
Workforce Analytics, Compensation Strategy, Workforce Simulation, Setup Simulation Model, Workforce Simulation Model |
Define a workforce simulation model by associating a set of simulation rules with a model ID. |
|
Run Workforce Simulation - Run Jobstream |
RUN_PF_JOBSTREAM |
Workforce Analytics, Compensation Strategy, Workforce Simulation, Run Workforce Simulation, Run Workforce Simulation - Run Jobstream |
Generate a workforce simulation scenario. |
|
Workforce Simulation Rules report |
RUN_RWA_0019 |
Workforce Analytics, Workforce Reports, Compensation Strategy Reports, Workforce Simulation Rules, Workforce Simulation Rules |
Run the Workforce Simulation Rules Crystal report (WAC0019), summarizing the simulation rules for a given setID and model ID. |
Setting Up Workforce Groups for Workforce Simulation
You use workforce groups to set up workforce reduction rules. You set up workforce groups using the Workforce Group component by selecting Workforce Analytics, Workforce Analytics Setup, Setup Groups. This component is documented in the PeopleSoft Workforce Analytic Applications 9.1 PeopleBook.
See Also
Setting Up Workforce Groups and Group Sets
Entering Workforce Simulation Growth and Reduction RulesAccess the Workforce Simulation Rule page (Workforce Analytics, Compensation Strategy, Workforce Simulation, Setup Simulation Rules, Workforce Simulation Rule).
|
Compile |
Click this button to have the system build, or compile, the underlying SQL. |
Selecting a Simulation Type
|
Simulation Type |
Enter a simulation type from the list of translate table values. Valid values are Workforce Growth, Requisition Growth and Workforce Reduction. A separate group box appears for each simulation type you select. |
You enter your requisition growth, workforce growth, and workforce reduction assumptions in the corresponding group boxes below. Later, when you run the workforce simulation process, the system uses these rules to create a simulated workforce output. The system uses your existing workforce as a starting point. The processing is as follows:
New Simulated Workforce = Existing Employees + Employees Reduced + New Simulated⇒
 Employees.
Note. Set up one Simulation Type per rule. When you save the page or change the field for the rule type, the system hides the fields that do not apply to the Simulation Type you select.
Defining a Workforce Growth Simulation
|
Job Code |
Enter a new headcount for your organization by specifying the Job Code for the new jobs or positions. Job Codes prompt from the JOBCODE_D00 table. |
|
Department |
Specify the Department to which the jobs are to be added. Departments prompt from the DEPARTMENT_SRCH table. Always specify both a Job Code and a Department for a workforce growth rule. |
|
Number to Simulate |
Enter the number of new jobs or positions to add to your workforce. |
|
Base Compensation |
Indicate the Base Compensation type you want the system to use to simulate the compensation cost of the new workers. Valid translate table values are:
|
|
Measure ID |
Select a Measure ID. Valid values for the Measure ID prompt from the WA_MKT_PCT_VW table. You developed these measure values and their associated measure amounts using the functionality in the Market Compensation module. |
Defining a Requisition Growth Simulation
|
Constraint Code |
Select a Constraint Code to indicate the constraint to use in determining which job openings to use for simulation. Valid values for the Constraint Code prompt from the WA_WFSCONSTR_VW table. Note. DataSets for Requisition Growth simulations must be based on TableMaps having STAFFING_F00 as the primary table. |
|
Base Compensation |
Indicate the Base Compensation type you want the system to use to simulate the compensation cost of the requisitions. The valid translate table values are listed above. |
|
Measure ID |
Select a Measure ID. Valid values for the Measure ID prompt from the WA_MKT_PCT_VW table. You developed these measure values and their associated measure amounts using the functionality in the Market Compensation module. This field is only required if you pick Market Rate in the Base Compensation field. |
Defining a Workforce Reduction Simulation
|
Group ID |
To define the group of employees you want to reduce, select a Group ID from the prompt list values, which are from the WA_CP_GROUP_DFN table. For example, you may choose to reference a workforce group based upon the workforce reduction decisions you made in the Retention Strategy module. |
Setting Up Model IDs for Workforce Simulation
Before you use the Compensation Strategy Workforce Simulation Model page, you must have set up model IDs in the Operational Warehouse - Enriched (OWE). You do this using the EPM Foundation, Business Metadata, Business Framework, Models page. This page is documented in the Enterprise Performance Management Fundamentals 9.1 PeopleBook.
See Also
Defining a Workforce Simulation ModelAccess the Workforce Simulation Model page (Workforce Analytics, Compensation Strategy, Workforce Simulation, Setup Simulation Model, Workforce Simulation Model).
Listing the Rules
Use the grid at the bottom of the page to list the workforce simulation rules you want to include in this model. Add rows to list multiple rules.
|
SeqNum (sequence number) and Simulation Rule ID |
For each rule enter the SeqNum (sequence number) and Simulation Rule ID. The system displays the simulation rule description. |
Setting Up a Scenario Definition for Workforce Simulation
Before you run the Workforce Simulation process, you must set up a Scenario ID and definition using the EPM Foundation, Business Metadata, Business Framework, Scenarios page. This component is documented in the Enterprise Performance Management Fundamentals 9.1 PeopleBook.
Note. The scenario type for a Workforce Simulation must be a Forecast Scenario.
See Also
Setting Up the Process Run Control for Workforce Simulation
Access the Run Workforce Simulation page (Workforce Analytics, Compensation Strategy, Workforce Simulation, Run Workforce Simulation, Run Workforce Simulation - Run Jobstream).
The run control definition includes these basic elements:
Business unit
Scenario ID
Fiscal year and accounting period
Jobstream ID
Scenario ID
The scenario ID you select using this page must be for a Forecast scenario.
Fiscal Year and Accounting Period
Run Simulation scenarios for a fiscal year and accounting period. Do not run them based on an as of dated jobstream.
These are the basic jobstreams and engines delivered for Workforce Simulation:
|
Jobstream ID |
Job ID |
Application Engine ID |
|
WA_WFS |
WA_WFS |
WA_WFS |
See Also
Streamlining Processing with Jobstreams
Generating the Workforce Simulation Scenario
To generate a workforce simulation scenario, you run a PeopleTools Application Engine (AE) process called Workforce Simulation (WA_WFS).
Workforce Simulation Process Output Tables
The main Workforce Simulation process output table is WA_JOB_S00. It is a clone of JOB_F00 with the addition of the PF_SCENARIO_ID field. This table stores the simulated workforce, which includes the current workforce (based on the date of the simulation scenario) from JOB_F00. This table can also include new simulated employees based on the rules defined in the workforce simulation pages (growth rules), as well as simulated terminated employees (reduction rules). This table is a basis for input into the Compensation Planning and Simulation process. If a reduction rule is specified in a simulation, the WA_GROUP_F00 table is also populated with the employees that are to be reduced from the workforce.
Identifying Reduced and New Simulated Employees
The WA_WFS AE process calculations use the groups and rules that apply to the selected business unit, setID, model ID and scenario ID. The process uses the existing employees from JOB_F00 as a starting point, and puts them in the WA_JOB_S00 table, but only in the first accounting period specified in the scenario. Then the system performs actions for the reduced employees in WA_JOB_S00, if any, and then adds new simulated employees to WA_JOB_S00, if any, to create the new simulated workforce. The process flow is:
New Simulated Workforce = Existing Employees + Employees Reduced + New Simulated⇒
 Employees.
For each reduced employee, the row is assigned a personnel Action of TER, and a Reason of WFS.
For each simulated new employee, the row is assigned a personnel Action of HIR, and a Reason of WFG. The system assigns them an employee identification number based on the structure $YYPPRRR###, where:
|
$ |
Indicates this is a simulated employee. |
|
YY |
Indicates the last two digits of the fiscal year. |
|
PP |
Indicates the accounting period. |
|
RRR |
Indicates a unique number attached to a WFS rule. Values can range from 001 to 999. |
|
### |
Indicates a unique number generated for an employee within a rule. The system first uses all numeric values ranging from 001 to 999. Then the system uses a combination of both alphabetic and numeric, such as A01, A02 and so on, ultimately up through ZZZ. |
Note. Based on this formatting, for a given fiscal year, accounting period, and workforce simulation scenario, you can add a maximum of 46,656 unique, simulated employees.
When the system creates simulated employees using existing job requisition information, from STAFFING_F00, it distinguishes these simulated employees from those created by workforce growth rules. Simulated employees from job requisitions are assigned a personnel action of HIR, and a reason of WFJ.
Effective Dating of Models and Rules in Workforce Simulation
The effective date of the model and rules used in the workforce simulation must be less than or equal to the effective date of the accounting period for the process run. For example, when you run the process for the fiscal year 2000, and accounting period 1, then the system uses all rules that are valid as of the beginning of that fiscal year/accounting period. If you have a rule that has an effective date of 02/01/2000, then it won't be used until you run the process for fiscal year 2000, accounting period 2.
Currency Codes and Currency Conversion in Workforce Simulation
When you run the Workforce Simulation process the system assigns new employees (in WA_JOB_S00) a currency code that is the same as the existing employees for that same scenario.
If your implementation of Workforce Rewards includes working with multiple currencies, you must run the Currency Conversion Application Engine process (PF_MULT_CURR) to populate the annual BCE rate field for employees in the JOB_F00 table. The timing of this step is important. You run this process after you have used the delivered ETL tool to import your source data to the data warehouse tables, and before running the Workforce Simulation process. If you don't run the Currency Conversion process prior to running Workforce Simulation, certain annual BCE rates are populated as zero throughout the JOB_F00 table, and these zero rates can be carried through the Workforce Simulation and Compensation Planning and Simulation processes. Employees' annual BCE rates should always be greater that zero.
Note. Check your Application Engine process messages after running the Workforce Simulation process. The process checks for any rows in WA_JOB_S00 with an annual rate of zero. If it finds such rows an error message is generated stating: "Warning: Annual BCE Rate=0. Must run Processing Multiple Currency or CPS results will be incorrect."
Synchronizing Workforce Simulation Data with the Workforce Rewards Data Mart
When you run the Workforce Simulation process, the system also calls the Data Mart Dimension process (WA_UPG_DIM), which updates the Workforce Rewards Data Mart dimensions. Workforce Simulation does not call any fact processes, but it does call the dimension build process:
For the first period the scenario is run for, all Workforce Rewards dimensions are populated.
If the scenario is run for additional periods, then only the employee specific dimensions such as WFI_PERSON_DIM and WFI_JOB_DIM are populated. The system does this because Workforce Simulation is creating new employee records in WA_JOB_S00, so the dimensions need to contain a complete list of all employees. Other dimensions do not need to be repopulated as they've already been populated for the first period.
See Also
Reviewing Your Workforce Simulation Scenario Setup
Review your workforce simulation rules setup using the following Crystal reports:
Workforce Simulation Rules report (WAC0019), summarizing the simulation rules for a given setID and model ID.
Workforce Groups report (WAC0018), summarizing the workforce group setup.
Note. Samples of these reports are provided with your documentation.
See Also
Setting Up a Compensation Scenario
To set up a compensation scenario, use the WA_CP_ELEM_DFN.GBL, WA_CP_GOALMTRX_DFN.GBL, WA_CP_MERIT_DFN.GBL, WA_CP_PYOUT_DFN.GBL, WA_CP_BASE_PAY.GBL, WA_CP_RULE_DFN.GBL, WA_CP_OTHER_DFN.GBL, and WA_CP_MODEL_DFN.GBL components.
This section discusses how to:
Link employee information to a compensation scenario.
Define performance-based calculation rules with a goals matrix.
Define base compensation increase rules with a merit matrix.
Control compensation distribution payout rules.
Define base pay rules.
Define variable pay rules.
Specify other pay rules.
Define frequency details for compensation models.
Set up workforce groups for compensation models.
Set up model IDs for compensation models.
Define a compensation planning and simulation model.
Set up compensation scenario IDs.
Set up the Compensation Planning and Simulation process run control.
Run the Compensation Planning and Simulation process.
Review and alter compensation planning scenario data using the Analytic Calculation Engine (ACE).
Pages Used to Set Up and Run a Compensation Scenario|
Page Name |
Definition Name |
Navigation |
Usage |
|
Data Element |
WA_CP_ELEM_DFN |
Workforce Analytics, Compensation Strategy, Setup Compensation Scenario, Setup Data Elements, Data Element |
Create data elements that link employee-based information in the system to compensation planning rules. |
|
Goals Matrix |
WA_CP_GOALMTRX_DFN |
Workforce Analytics, Compensation Strategy, Setup Compensation Scenario, Setup Goals Matrix, Goals Matrix |
Define performance-based calculation rules for group or employee performance based on a goals matrix. |
|
Merit Matrix |
WA_CP_MERIT_DFN |
Workforce Analytics, Compensation Strategy, Setup Compensation Scenario, Setup Merit Matrix, Merit Matrix |
Create a merit matrix which defines the amount rules for base compensation increases for your workers. |
|
Payout Rule |
WA_CP_PYOUT_DFN |
Workforce Analytics, Compensation Strategy, Setup Compensation Scenario, Setup Payout Rules, Payout Rule |
Establish the amount rules for how to pay out compensation based on a flat amount, percentage of base pay, or criteria in a data element. |
|
Base Pay Compensation Rule |
WA_CP_BASE_PAY |
Workforce Analytics, Compensation Strategy, Setup Compensation Scenario, Setup Base Pay Rules, Base Pay Compensation Rule |
Create a base pay compensation rule. |
|
Variable Pay Rule |
WA_CP_VC_PAY |
Workforce Analytics, Compensation Strategy, Setup Compensation Scenario, Setup Variable Pay Rules, Variable Pay Rule |
Create a variable pay compensation rule, for bonuses for example. |
|
Other Pay Rule |
WA_CP_OTHER_PAY |
Workforce Analytics, Compensation Strategy, Setup Compensation Scenario, Setup Other Pay Rules, Other Pay Rule |
Create other pay rules, for benefits for example. |
|
Compensation Model |
WA_CP_MODEL_DFN |
Workforce Analytics, Compensation Strategy, Setup Compensation Scenario, Setup Compensation Model, Compensation Model |
Set up a model to bring together the workforce groups and compensation rules needed to run a scenario. |
|
Workforce Group Description |
WA_CP_MODEL_SEC1 |
Click the Workforce Group Info (information) button alongside the group ID field on the Compensation Model page. |
View a description of the workforce group. |
|
Compensation Rule Description |
WA_CP_MODEL_SEC2 |
Select the Compensation Rule Info (information) button alongside the rule ID field on the Compensation Model page. |
View a description of the compensation rule. |
|
Run Compensation Scenario - Run Jobstream |
RUN_PF_JOBSTREAM |
Workforce Analytics, Compensation Strategy, Setup Compensation Scenario, Run Compensation Scenario, Run Compensation Scenario - Run Jobstream |
Run the compensation planning and simulation process. |
Linking Employee Information to a Compensation ScenarioAccess the Data Element page (Workforce Analytics, Compensation Strategy, Setup Compensation Scenario, Setup Data Elements, Data Element).
Data elements, at their most simple level, define information that you link to an employee. At a more complex level, you use data elements when you build compensation rules, to tell the system what data to retrieve about your workforce groups, and what performance measures to apply to your compensation scenario.
Selecting a Data Element Type
Select a Data Element Type from the list of translate table values:
|
DataSet |
A calculation amount resolved for each employee subject to this rule. DataSets are data pointers from DataMaps. They point to measurable data about an employee, in the data warehouse tables. DataSets provide you a means of defining a set of information to use in Application Engine processes. When you select the DataSet option the Constraint Code field and Compile button display. Once you select the Constraint Code, the Dimension and Measure ID fields also display. The DataSet definition you specify with these fields determines the type of measure used in the Compensation Planning and Simulation process (WA_CPS). |
|
Goals Matrix Score |
When you select this option, the Goals Matrix ID field appears. Prompt values for this field are from the WA_CP_GOAL_DFN table. You create goals matrices using the Goals Matrix page. |
|
KPI Assessment Value |
The KPI Assessment Value is a numeric value for the assessment, or scoring, of a KPI (Key Performance Indicator). You create KPIs in Scorecard. The KPI is scored when the KPI Resolved Value is compared to a target value. When you select KPI Assessment Value the KPI ID field displays. Prompt values for this field are from the WA_KPI_DFN_VW table. |
|
KPI Resolved Value |
The KPI Resolved Value is the calculated value of the KPI. You define them using the KPI Manager, in Scorecard. When it is compared, or scored, against a target value, the result is a numeric KPI Assessment Value. When you select KPI Resolved Value, the KPI ID field displays. Prompt values for this field are from the WA_KPI_DFN_VW table. |
DataSet Data Element Type
|
Constraint Code |
For a Data Element Type of DataSet select the Constraint Code for the system to use for every compensation rule to which the data element is applied. Constraints are collections of filters you use to define business rules for processing, and return desired data from a given DataMap. This field prompts values from constraints you define with the Constraint component. The prompt values are from the PF_CONSTR_DFN table. |
|
Dimension |
Select a dimension from the prompt list values, which are from the WA_DM_DIM_VW table. The most common dimensions for Workforce Analytics that repeatedly appear in the DataMaps are business unit, employee identification, department identification, location code, and job code. |
|
Measure |
Specify the Measure ID for the Dimension. The prompt values are from the WA_DM_MEAS_VW table. |
|
Compile |
For a Data Element Type of DataSet, click the Compile button. This triggers the system to build the underlying SQL. Otherwise the system builds it automatically on saving the page. After building the SQL the system displays the SQL Object ID Prefix, a system-generated number identifying the location of the SQL in the SQL Repository. |
Goals Matrix Score Data Element Type
For a Data Element Type of Goals Matrix Score, first create the Goals Matrix on the Goals Matrix page. Then, while still on that page, choose to have the system automatically create a corresponding Data Element with the same name. If you already have a Goals Matrix built, and you want to define a Data Element with a different name, then create the Data Element using this page. In either case, each Goals Matrix ID must be linked to a corresponding Data Element ID.
Some Important Points about Creating KPIs for Use with Workforce Rewards
When you use Scorecard to create KPIs for use in Workforce Rewards, remember the following important points:
The Enterprise Scorecard pages you use to create KPIs are located by navigating to Key Performance Indicators, Define KPI's. They are as follows:
Data Element Definition (if you are using data elements in your KPI.)
Calculation Definition.
Assessment Definition (if you are using a target rule, then specify the assessment usage as Workforce Analytics to ensure required values are populated.)
KPI Definition.
KPI Calculation Rule.
KPI Object.
KPI Target Rule (if you are using assessed values then specify the target rule type as Workforce Analytics.)
Specify the model IDs for your KPIs in the KPI Model column, on the EPM Foundation, Business Metadata, Business Framework, Scenarios - Forecast Business Rules page.
Processing is done by using the Workforce Rewards jobstreams (either WA_CPS or WA_RETENT). None of the KPI jobstreams need to be run if the KPI is only used in Workforce Rewards.)
Workforce-specific KPIs are delivered with Workforce Scorecard. If your implementation includes Workforce Scorecard, you can use those KPIs on the Data Element page in Workforce Rewards.
Note. You can only use the KPI-related options if your implementation includes Scorecard or Workforce Scorecard.
Defining Performance-Based Calculation Rules with a Goals MatrixAccess the Goals Matrix page (Workforce Analytics, Compensation Strategy, Setup Compensation Scenario, Setup Goals Matrix, Goals Matrix).
Indicating the Number of Award Levels in the Scale
|
Number of Levels |
Select the number of pay out, or performance measure, levels you want to include in your Goals Matrix. Valid values from the translate table are Three Levels, Five Levels and Seven Levels. |
|
Scale and Scale Values |
Based on the number of levels you select, the corresponding number of level fields display in the Scale group box, and the same number of performance measure columns display on the Scale Values tab at the bottom of the page. |
Using the Scale Group Box
The system labels the lowest, middle, and highest levels of the scale the Threshold, Target and Stretch, respectively:
|
Threshold |
This is the performance level for minimum adequate performance, the designated level of performance below which it is inappropriate to pay incentives. |
|
Target |
This is the performance level your organization establishes as the norm for performance and pay out. |
|
Stretch |
This is the performance level for which an employee achieves maximum pay out. Performance above this level receives no greater pay out. |
Scale Group Box
|
Scale |
If you are using the Goals Matrix in a Formula Plan, you enter the exact pay out amounts you want to apply to each level in this group box. The amounts you enter in these fields are paid out based on the pay out scores calculated for the performance goals in the grid at the bottom of the page. If you use the Goals Matrix in a Target Plan, then you use this group box as a standardizing scale, to standardize data elements to a common scale of measurement. The values you enter in the levels are used by the system to standardize the pay out scores for the performance goals in the grid at the bottom of the page. There are different approaches you can take depending on how diverse your performance goals are:
|
Using the Matrix Group Box
Your goals matrix is made up of performance goals (which are the rows), and performance measures (which are the columns). Individual performance goals are defined using data elements. You create data elements using the Data Element page. On the average, a goals matrix may have from three to five goals, but some may have as many as ten. To list multiple goals in the Goals Matrix, place the cursor in the Data Element ID field and insert additional data rows.
For each individual goal follow these steps:
On the Matrix Elements tab, define the goal by selecting a Data Element ID from the prompt list values from the WA_CP_ELEM_VW table.
Enter a weight value for the goal in the Weight% (weight percentage) field. The system totals the weight percentages for all of the goals and displays the figure in the Total Weight field at the bottom of the page. You must ensure that the cumulative weights for all of your goals adds up to 100.00.
In each of the performance measure columns on the Scale Values tab, enter the Threshold, Target and Stretch values for this specific goal. For example, if the goal is Quarterly Billable Hours, and there are three levels, the performance measure values might be 200, 300, and 400 hours respectively.
Performing Goals Matrix Calculations for a Target Plan
Create a goals matrix with this page for use in conjunction with a compensation plan type called a target plan. The system uses the Goals Matrix to calculate a total score for an employee. The system compares the employee's total score to the scoring criteria defined in the target matrix in the Compensation Rules component, and determines the monetary value of the pay out the employee receives based upon their performance. Here's an example of how this calculation process works:
For this example let's take a goals matrix for employees who are off-site consultants, that calculates their quarterly bonus. We have three goals: billable hours (with values of 200, 300, and 400), customer satisfaction rating (with values of 1,2, and 3), and customer courses taught (with values of 2, 4, and 6). Because the goals are so different, we standardize them using a three level scale of 0, 50, and 100. Our Scale and goals look like this:
|
Scale or Goal |
Weight |
Threshold |
Target |
Stretch |
|
Scale |
0 |
50 |
100 |
|
|
Billable Hours |
50% |
200 |
300 |
400 |
|
Customer Satisfaction Rating |
25% |
1 |
2 |
3 |
|
Courses Taught |
25% |
2 |
4 |
6 |
An employee, William Avery, has 350 billable hours, a customer satisfaction rating of 3, and he has taught 3 customer courses. Here's what happens when the system uses this goals matrix to evaluate his performance.
The system looks at his 350 billable hours, and interpolates this against the scale. (Interpolation means using an equation to calculate the value in between two known values.) The system does the same for his customer rating of 3, and his 3 courses. The results of the interpolation are as follows:
|
Goal |
Employee's Performance |
Interpolated Scale Value |
Explanation |
|
Billable Hours |
350 |
75 |
Because 350 is midway between 300 and 400, the system interpolates that 75 is midway between the standardized scale values of 50 and 100. |
|
Customer Satisfaction Rating |
3 |
100 |
3 corresponds exactly to 100 on the scale. |
|
Courses Taught |
3 |
25 |
Because 3 is midway between 2 and 4, the system interpolates that 25 is midway between the standardized scale values of 0 and 50. |
The interpolated scale value is the employee's actual performance standardized against the scale. Then, for each goal, the system multiplies the interpolated scale value by the weighting, to create a weighted rating for the goal. Then the system adds up the weighted ratings for all of the goals to get a total score.
The calculation process looks like this:
|
Goal |
Weight |
Employee's Performance |
Interpolated Scale Value |
Weighted Rating |
|
Billable Hours |
50% |
350 |
75 |
.5 x 75 = 37.5 |
|
Customer Satisfaction Rating |
25% |
3 |
100 |
.25 x 100 = 25 |
|
Courses Taught |
25% |
3 |
25 |
.25 x 25 = 6.25 |
|
Total Score |
37.5 + 25+ 6.25 = 68.75 |
The system then compares the employee's total score against the scoring criteria defined in the target matrix in the Compensation Rules component, and determines the monetary value of the pay out the employee receives based upon their performance. For example, if the target matrix indicates that all employees with a goals matrix score between 50 and 75 should receive a bonus pay out equal to 2 percent of their base pay, then the system calculates a 2 percent bonus for William Avery.
Performing Goals Matrix Calculations for a Formula Plan
Create a goals matrix with this page for use in conjunction with a compensation plan type called a formula plan. In the formula plan, the pay out score is calculated in association with a payout rule. The payout rule must have a payout type of data element, where the data element is a goals matrix such as the one in the previous example. The pay out score is calculated from the goals matrix, as in the prior example, and interpolated against the monetary amounts in the scale to determine the actual pay out amount.
Creating a Data Element From the Goals Matrix
|
Create Data Element on Save |
You already created the individual data elements used in this goals matrix using the Data Element page. Once the goals matrix is complete, make it into a data element as well. You can do this in two ways. The system creates the data element for you. If this is a new goals matrix ID, and you want the corresponding data element ID to have the same name, select this check box and save the page. This is the default setting for the check box . If you want the data element to have a different name to the goals matrix, clear the Create Data Element on Save check box. |
Defining Base Compensation Increase Rules with a Merit MatrixAccess the Merit Matrix page (Workforce Analytics, Compensation Strategy, Setup Compensation Scenario, Setup Merit Matrix, Merit Matrix).
|
Rating Model |
Select a Rating Model from the prompt list values, which are from the WA_RTGMDL_R00 table. |
Completing and Using the Merit Matrix
|
Review Rating |
As in HRMS, a merit matrix provides the salary increase parameters for each review rating in a rating model. To complete the merit matrix, you begin with the Review Rating column. Place the cursor in the Review Rating column, and select a rating from the prompt list values, which are from the WA_REVWRTG_R00 table. |
Insert an additional row of data for each Review Rating in the Rating Model. Then, for each Review Rating, enter the recommended percentage pay increase for each of the employee pay range values as follows:
|
Default |
In the Default column, select a single review rating that you want the system to use as a default pay increase guideline, if an employee (or simulated employee) has no review rating. |
|
Below Min % (below minimum percentage) |
This is the lowest allowable increase for an employee, if the employee's current base compensation is below their salary grade minimum. |
|
Below Max % (below maximum percentage) |
This is the highest allowable increase for an employee, if the employee's current base compensation is below their salary grade minimum. Together with the Below Min % figure, this provides an allowable salary increase range for the employee. |
|
1st Qt Min % (first quartile minimum percentage) |
This is the lowest allowable increase for an employee, if the employee's current base compensation falls within the first quartile of their salary grade range. |
|
1st Qt Max % (first quartile maximum percentage) |
This is the highest allowable increase for an employee, if the employee's current base compensation falls within the first quartile of their salary grade range. Together with the 1st Qt Min % figure, this provides an allowable salary increase range for the employee. |
|
2nd Qt Min % (second quartile minimum percentage) |
This is the lowest allowable increase for an employee, if the employee's current base compensation falls within the second quartile of their salary grade range. |
|
2nd Qt Max % (second quartile maximum percentage) |
This is the highest allowable increase for an employee, if the employee's current base compensation falls within the second quartile of their salary grade range. Together with the 2nd Qt Min % figure, this provides an allowable salary increase range for the employee. |
|
3rd Qt Min % (third quartile minimum percentage) |
This is the lowest allowable increase for an employee, if the employee's current base compensation falls within the third quartile of their salary grade range. |
|
3rd Qt Max % (third quartile maximum percentage) |
This is the highest allowable increase for an employee, if the employee's current base compensation falls within the third quartile of their salary grade range. Together with the 3rd Qt Min % figure, this provides an allowable salary increase range for the employee. |
|
4th Qt Min % (fourth quartile minimum percentage) |
This is the lowest allowable increase for an employee, if the employee's current base compensation falls within the fourth quartile of their salary grade range. |
|
4th Qt Max % (fourth quartile maximum percentage) |
This is the highest allowable increase for an employee, if the employee's current base compensation falls within the fourth quartile of their salary grade range. Together with the 4th Qt Min % figure, this provides an allowable salary increase range for the employee. |
When you run the Compensation Planning and Simulation process (WA_CPS) to generate a compensation scenario, the system looks at an employees review rating, and determines where their current grade and pay fits on this matrix. The system then uses the averaged percentage increase recommendations to calculate the simulated percentage pay increase for the employee.
When you enter the recommended pay increase percentages into the merit matrix, take into account your organization's pay strategy, or the pay strategy that you want to model in a scenario. You may want to create multiple merit matrices to test the costs and benefits of changing your pay strategy. For example, you might create one merit matrix that provides higher pay increase percentages for employees who are at the low end of their salary ranges, but keeps pay increases at a minimum for employees who are currently at the top of their salary range. Or you may want to create a merit matrix that rewards high performers with higher recommended pay increases, and provides poor performers with lower recommended pay increases.
Controlling Compensation Distribution with Payout RulesAccess the Payout Rule page (Workforce Analytics, Compensation Strategy, Setup Compensation Scenario, Setup Payout Rules, Payout Rule).
|
Compensation Type |
Select a Compensation Type for the payout rule. Valid values are Currency Amount and Unit of Measure. A separate set of fields appear for each compensation type you select. |
Defining Currency Amount Compensation
|
Amount Type |
Select an amount type for the currency compensation. Valid values are Employee Expense, Employee Val and Employer Exp (employee value and employer expense), Employee Value, and Employer Expense. For example, in the case of a benefit plan such as an Employee Stock Purchase Plan (ESPP), the cost to the employer might be zero, but the value to the employee might be large. |
|
Payout Type |
Select the type of payout you want to associate with the compensation. Valid values are Data Element, Flat Amount, and Percent of Base Pay. The subsequent fields change depending on which of these values you select. This field is only available when you select the Currency Amount compensation type. |
|
Annualize? |
Select this check box to annualize the calculated payout amount This field is only available when you select the Percent of Base Pay payout type. |
|
% of Base Pay (Percent of Base Pay) |
Define the pay out rule using the % of Base Pay (percentage of base pay) field, basing the pay out rule on a percentage of an employee's base pay. This field is only available when you select the Percent of Base Pay payout type. |
|
Data Element ID |
Define the pay out rule using a data element that you have created on the Data Element page, by selecting a Data Element ID from the prompt list values, which are from the WA_CP_ELEM_VW table. You also have the option of specifying the payout be based on a percentage of the data element. This field is only available when you select the Data Element payout type. |
|
% of Data Element (Percent of Data Element) |
Define the pay out rule using the % of Data Element (percentage of data element) field, basing the pay out rule on a percentage of a specific data element you have already defined on the Data Element page. This field is only available when you select the Data Element payout type. |
|
Amount |
Enter a value for the pay out rule when you want a flat monetary amount. This field is only available when you select the Flat Amount payout type. |
Defining Unit of Measure Compensation
You can also base the payout type on a Unit of Measure. Valid values include: Days, Dollars, Each, Man Hours, Number, Percent, Seconds, Square Feet, Stock Units, Time, and Units. If this is the case, then enter the Units and Value Per Unit.
Defining Base Pay RulesAccess the Base Pay Compensation Rule page (Workforce Analytics, Compensation Strategy, Setup Compensation Scenario, Setup Base Pay Rules, Base Pay Compensation Rule).
Your next step is to use the setup data you have entered to define compensation rules. Building compensation rules is a little like creating a compensation plan. Except, rather than just specifying the compensation types that go into a compensation plan, you define rules for calculating the predicted pay out for a population of employees who participate in the compensation plan. You define rules for base pay, variable pay, and other pay (for example benefits), either individually or in any given mix that you specify.
|
Action and Reason Code |
Enter an Action and Reason Code for the base compensation rule. The purpose of this step is to make the base compensation rules actionable by associating them with personnel actions. |
Entering a Rule Type
Enter a Rule Type by selecting from the list of translate table values:
|
Amount Increase |
Select this option if your scenario involves an amount increase to an employee's base pay. Use Amount to enter the increase. |
|
Equity Increase |
Select this option if your scenario involves an equity increase to an employee's base pay. Equity increases are pay increases granted to bring an employee's pay up to some internally specified standard. Select the type of equity in the Equity group box. For example, you might want to bring the base pay of all your software developers up to at least the market rate midpoint. To do this, grant an equity increase to those developers whose current pay is below that level. |
|
Merit Matrix Increase |
Select this option if your scenario involves a merit increase to an employee's base pay. A merit increase is calculated using a merit matrix created on the Merit Matrix page. Select a Merit Matrix Code from the prompt list values, which are from the WA_CP_MERIT_DFN table. The system uses the amount rules defined in the merit matrix, and an employee's salary review ratings, to determine the level of merit increase to grant the employee. |
|
Percentage Increase |
Select this option if you want to grant a pay increase to an employee or group based upon a percentage of their current base pay. Enter the desired increase percentage in Percent of Base Pay field. |
|
Step Progression |
Select this option if you want to grant a step progression increase to an employee or group, as long as their salary plan includes steps within grades. When you select this option, the system advances each affected employee one step up their pay scale. |
Specifying the Equity Type
For a Rule Type of Equity Increase, specify the type of equity in the Equity group box from the following options:
|
Internal Pay Structure |
This option gives you the ability to define an equity increase based upon an employee's salary Range Penetration. Range Penetration is the degree to which an employee's actual pay has progressed through their salary grade, and is usually expressed as a percentage. For example, if you enter a value of 20% in the field, the system will not grant an equity increase to any employee in the affected group whose salary has already penetrated to this level. For any employee whose degree of range penetration is below this level, the system grants them an equity increase equal to the monetary amount needed to bring them up to this range penetration level. The calculation is: Range penetration = (Employee Base Pay Range Minimum/(Range Maximum Range Minimum) For example: If an employee's pay is 70,000 in a pay range with a minimum and maximum of 40,000 and 80,000, then the calculation is (70,000/ 40,000) / (80,000 / 40,000) = 30/40 = 75% range penetration. |
|
Market Rate |
Select this option if you want the equity increase to be based upon the market rate values for the employee's job code and salary grade. Select the Measure ID (the percentile of the market rate) that you want to use as the control point. In this case, for any employee whose current salary is at or above this level, the system grants them no equity increase. For any employee below this level, the system grants them an equity increase equal to the monetary amount needed to bring them up to this level. |
Defining Variable Pay RulesAccess the Variable Pay Rule page (Workforce Analytics, Compensation Strategy, Setup Compensation Scenario, Setup Variable Pay Rules, Variable Pay Rule).
Using this Page
To complete this page follow these three basic steps:
Specify the Compensation Code, Compensation Type, and VC Plan ID (variable compensation plan identification code).
Specify the compensation distribution Plan Type.
Define the compensation rules in one of the three plan type group boxes.
Identifying the Variable Compensation Code and Type
|
Compensation Code |
Select the Compensation Code for the variable compensation for which you are defining a rule. This may be any compensation code except regular base pay (600). Prompt list values are from the WA_COMP_TREE_VW table. |
|
Compensation Type. |
Select a Compensation Type. Valid values are Currency Amount and Unit of Measure. |
|
Earnings Code |
Select an earnings code (such as Holiday or Bonus) for the variable compensation for which you are defining a rule. |
|
VC Plan ID |
Associate the variable compensation rule with a VC Plan ID (variable compensation plan identification) from HRMS. |
Identifying the Compensation Distribution Plan Type
Enter a compensation distribution Plan Type by selecting from the list of Translate values.
|
This plan type provides managers ultimate discretion over a pool of money, which is either funded based on organization, group, or employee performance, or is budgeted. The discretionary award determination is sometimes guided by a predetermined percent of the participant's salary, expressed as an opportunity. This figure can then be modified based upon management's perception of actual value created by the group or employee. For example, each participant in an annual bonus plan may have the opportunity to earn 10 percent of base salary, but that amount may be changed based on manager discretion. Some employees may receive less than 10 percent, others may receive more. |
|
|
Formula Plan |
This compensation distribution plan type is based on a payout rule. The payout rule can be based on a flat amount, a percentage, or a data element. Whereas a target plan distributes payout based on a comparison of a performance measure against a target, in a formula plan the payout is based just on the payout rule. |
|
With this distribution plan type the level of award is linked directly to a predetermined level of performance. For example, a target plan for a group might be as follows: A group, increase the business units, net income by 10% and each member of the group is eligible for an award equal to 5% of base pay. |
Specifying Discretionary Plan Details
For a Plan Type of Discretionary Plan, select the Distribution Type from the list of translate table values: Business Unit, Department, Group, Job Code, and Location. You can choose to vary the distribution, or compensation pay out, to employees using any one of these dimensions. For any of these options select a Payout Rule ID from the list of prompt values, which are from the WA_CP_PYOUT_DFN table.
The discretionary plan takes the results of a payout rule, but distributes it based on the Distribution Type field. For example, if the Distribution Type is Department, the payout is distributed as a fraction of how many employees belong to a particular department. That is, if person X belongs in a department of 10 people and the payout to be distributed is 1000 units, each employee in that department receives 100 units as a pay out.
Specifying Formula Plan Details
The formula plan calculation process takes the results of a payout rule and distributes it to each employee in a workforce group who has that compensation rule assigned to it, without prorating or otherwise diluting the payout.
Select a Payout Rule ID for the formula plan from the list of prompt values, which are from the WA_CP_PYOUT_DFN table.
Specifying Target Plan Details
For a Plan Type of Target Plan, select the Data Element ID from the prompt list values, which are from the WA_CP_ELEM_VW table. The target plan applies a case or evaluation method for determining what payout is paid to an employee. The level of award for an employee is linked directly to a predetermined level of performance.
Note. Remember, if you are using a goals matrix with a target plan, you create a goals matrix on the Goals Matrix page. Then you tie the goals matrix to a data element on the Data Element page. The data element that you select using this page is the one that references the goals matrix you want to use with this target plan.
In the Compare Type field specify whether you want the first Data Element compared against a Static Value or against another Data Element. If you select Static Value, then complete the following fields:
|
Load Sequence |
Enter a number to indicate the sequence in which you want the rules processed. To enter multiple rules insert additional data rows. |
|
Operator |
Select an arithmetic operand from the list of values. Valid values include Less Than, Less Than or Equal To, Not Equal To, Equal To, Greater Than, and Greater Than or Equal To. |
|
Value |
Enter the comparison value as a numeric value. |
|
Payout ID |
Indicate the Payout Rule ID you want to associate this condition with. Prompt list values are from the WA_CP_PYOUT_DFN table. |
If you select Data Element, then complete the following fields:
|
Load Sequence |
Enter a number to indicate the sequence in which you want the rules processed. To enter multiple rules insert additional data rows. |
|
Operator |
Select an arithmetic operand from the list values. Valid values include Less Than, Less Than or Equal To, Not Equal To, Equal To, Greater Than, and Greater Than or Equal To. |
|
Data Element ID |
Select a Data Element ID from the prompt list values, which are from the WA_CP_ELEM_VW table. |
|
Payout ID |
Indicate the Payout Rule ID you want to associate this condition with. Prompt list values are from the WA_CP_PYOUT_DFN table. |
Specifying Other Pay Rules
Access the Other Pay Rule page (Workforce Analytics, Compensation Strategy, Setup Compensation Scenario, Setup Other Pay Rules, Other Pay Rule) entering a setID and compensation Rule ID.
This page is essentially the same as the Variable Pay Rule page, with the following exceptions:
It does not have the variable compensation plan ID field.
Its intended use is for benefits-related compensation, so instead of earning code field it has a benefit plan field
Setting Up Frequency Details for Compensation Models
You use Frequency ID Codes on the Compensation Model page. You set up these codes on the EPM Foundation, EPM Setup, Common Definitions, Calendars, Frequency and Frequency Details pages. You can also access the Frequency Details page directly from the Workforce Analytics, Compensation Strategy menu, enabling you to review the frequency IDs in the system. These pages are documented in the Enterprise Performance Management Fundamentals 9.1 PeopleBook.
See Also
Setting Up Workforce Groups for Compensation Models
You use workforce groups on the Compensation Model page. You set up workforce groups using the Workforce Analytics, Workforce Analytics Setup, Workforce Groups component. These pages are documented in the PeopleSoft Workforce Analytic Applications 9.1 PeopleBook.
See Also
Setting Up Workforce Groups and Group Sets
Setting Up Model IDs for Compensation Models
Before you use the Compensation Model page, you must set up a model ID on the EPM Foundation, Business Metadata, Business Framework, Models page. This page is documented in the Enterprise Performance Management Fundamentals 9.1 PeopleBook.
See Also
Defining a Compensation Planning and Simulation ModelAccess the Compensation Model page (Workforce Analytics, Compensation Strategy, Setup Compensation Scenario, Setup Compensation Model, Compensation Model).
Understanding the Purpose of this Page
The purpose of this page is to tie together the setID, model ID, workforce groups, compensation rules, and calculation frequencies needed to use the model in a scenario. The model definition tells the Compensation Planning and Simulation process (WA_CPS) what compensation data to calculate for what group of employees, and on what frequency.
Two Methods for Beginning the Model Definition
You have option of cloning your model and rules from an existing one. To do this select a model ID in the Clone Model ID field. Prompt values are from the WA_CP_MODL_TBL table. If you choose to do this, edit the model setup and rules to create your new model.
You also have the option of creating your new model manually. To do this bypass the Clone Model ID field and proceed to complete the fields on the remainder of the page.
In the Group ID field, select the overall workforce group which encompasses all of the workers you want to include in the model. Prompt values are from the WA_CP_GROUP_DFN table.
Select the Include Current Pay check box if you want the system to automatically include employees' current base salary in their compensation calculations. This is useful when you want to model the total compensation impact of compensation changes. Leave it cleared if you want the system to omit current pay from the compensation calculations. This is useful when you want to model only the change in compensation.
Note. Always select the Include Current Pay option if you plan to use the data from a compensation analytic model in the Planning and Budgeting Position Budgeting feature.
Defining the Rule Sequence
Use the Rule Sequence group box to specify the sequence of groups and compensation rules you want to include in the model.
|
Sequence |
When you specify multiple compensation rules for your compensation model, you must specify the sequence in which you want them processed. The system inserts default sequence numbers, but the field is editable, so you can change the sequence. |
|
Group ID |
Select a workforce group ID from the prompt list values, which are from the WA_CP_GROUP_DFN table. The workers in this group must be a subset of the overall group specified above, in the model definition. |
|
Rule ID |
Select a compensation rule ID from the prompt list values, which are from the WA_CP_RULE_VW3 table. |
|
Frequency ID |
Select a calculation frequency ID from the prompt list values, which are from the PF_FREQ_DTL table. |
|
Workforce Group Info and Compensation Rule Info |
Click the Workforce Group Info or Compensation Rule Info button to the right of the Group ID and Rule ID fields to access the Workforce Group Description and Compensation Rule Description pages, and view the descriptions of the groups or rules. |
Setting Up Compensation Scenario IDs
Before you run the Compensation Planning and Simulation process in Compensation Strategy, you must have set up a scenario ID using the EPM Foundation, Business Metadata, Business Framework, Scenarios page. These pages are documented in the Enterprise Performance Management Fundamentals 9.1 PeopleBook.
See Also
Generating the Compensation Planning Scenario
Access the Run Compensation Scenario - Run Jobstream page (Workforce Analytics, Compensation Strategy, Setup Compensation Scenario, Run Compensation Scenario, Run Compensation Scenario - Run Jobstream).
To generate a Compensation Planning scenario, you run a PeopleTools Application Engine (AE) process called Compensation Planning and Simulation (WA_CPS). The run control definition includes these basic elements:
Business unit
Scenario ID
Fiscal year and accounting period
Jobstream ID
Scenario ID: Running CPS as a Forecast versus Historical Process
The scenario ID you select using this page can be for either a Forecast or a Historical scenario.
The Retention Assignment and Workforce Simulation processes can serve as a basis for input to the CPS process, when it is run for Forecast scenarios. You can use constraints to integrate the results of the Retention Assignment engine into your compensation rules, or use the reduced employees in WA_GROUP_F00 as a workforce group. You can also use the Workforce Simulation process to generate a simulated workforce in WA_JOB_S00, consisting of your existing employees in a business unit, plus any new simulated employees and reduced employees (employees to be removed from your workforce). The CPS process can take the simulated workforce generated by the Workforce Simulation process, and use it as input for calculating compensation costs and values. CPS can simulate several varieties of base compensation rules, as well as an infinite number of changes to variable and benefits compensation rules.
If you run CPS as a Historical scenario the system uses the existing workforce from JOB_F00 to populate WA_JOB_S00. In this case you do not use inputs from either retention strategy or workforce simulation.
When you use the Run Jobstream run control you can access and run other jobstreams, but these are the basic jobstreams and engines delivered for Compensation Planning and Simulation:
|
Jobstream ID |
Job ID |
Application Engine ID |
|
WA_CPS |
WA_CPS, WA_CPS_MRG |
WA_CPS |
CPS Process
The CPS process performs calculations using the groups and rules that apply to the business unit, setID, model ID and scenario ID defined on the run control, if the process is not already approved. The process performs calculations using the annual rate and annual amount base currency equivalent fields in the tables. The process does not convert rates and amounts back to hourly or monthly. For each job with changed compensation data, new rows of data are added to the WA_JOB_S00 table. Each row of data is associated with a personnel action of PAY and a reason of CPS.
The high-level sequence of tasks performed by the CPS process is as follows:
Resolves the model rules.
Prepares input from the WA_JOB_S00 table.
Flattens trees (for Job Code, Organization, and Compensation Code).
Calls the subprograms stored in the application libraries in the following order:
|
Group Builder (WA_GRPBUILD) |
Resolves the constraints associated to the workforce group definition. After resolving the constraints, the data from the constraints (primarily employees) is copied over to the WA_GROUP_F00 temporary table so the CPS process can utilize it to process affected employees. |
|
Base Pay Calculator (WA_BP_CALC) |
Calculates the base pay for employees in a scenario based on the compensation rules specified in the model. |
|
Data Element Resolver (WA_DATA_ELEM) |
Resolves the data elements used in the scenario and resolves the accompanying data in the WA_DATAEE_F00 temporary table. The data elements resolved by this process can be used in the Variable Pay Calculator or the Payout Resolver processes. |
|
Payout Resolver (WA_PAYOUT) |
Determines all of the pay out possibilities for a given scenario. After the payouts are determined, the results of a payout are then accessed by the Variable Pay Calculation program to determine which pay out to use for the final results in the CPS process. |
|
Variable Pay Calculator (WA_VP_CALC) |
Is similar to the Base Pay Calculator, however, it differs in that it uses the results from the last three sub-programs to calculate the variable compensation to pay out to the employee. |
CPS Process Output Tables
When you run CPS, the process populates these final output tables:
|
Table |
Purpose |
|
WA_CALC_F00 |
Stores all final calculation results of the CPS process. This includes the appropriate costs or value per employee based on the rules specified in the scenario. The system only performs calculations for, and updates, the annual rate and annual amount base currency equivalent fields in the table. The system does not convert rates and amounts back to hourly or monthly. If part of the scenario process run includes a workforce simulation where simulated employees are added to the workforce, the new employees are assigned a currency code (in WA_JOB_S00) that is the same as the existing employees for that same scenario. |
|
WA_JOB_S00 |
A clone of JOB_F00 with the addition of PF_SCENARIO_ID in it. For each job with changed base compensation data, new rows of data are added to the table. Each row of data is associated with a personnel action of PAY and a reason of CPS. |
|
WA_GROUP_F00 |
Contains the list of employees in a workforce group specified in the scenario. WA_GROUP_F00 is populated by both WFS and CPS. If a reduction rule is specified in the scenario, the WA_GROUP_F00 table is populated with the employees that are to be reduced from the workforce during the WFS run. A reduction rule points to a workforce group to be reduced, this forces the WFS process to call the Group Builder process to run and create the group in WA_GROUP_F00. |
|
WA_DATAEE_F00 |
Contains the resolved values for all data elements specified in the scenario. The table is populated by the WA_DATA_ELEM AE library that is called by CPS. |
|
WA_JOBPAY_F00 |
Contains base pay compensation data for employees in the scenario calculations. Provides you the ability to direct the CPS process to either include or exclude current base pay from the process calculations. |
Loading the Analytic Model
After the CPS Process generates your scenario, it automatically calls the Load Analytic Model (WA_CP_BAM_LD) application engine to generate an analytic model instance with the same ID as the scenario ID. Hence, you need not run the process from the Load Compensation ACE Model page. You can still manually load an analytic model using the page, should you wish to reload the model or to load the scenario results into multiple analytic models.
Immediately after the Load Analytic Model application engine process completes, you can review the scenario results in the ACE model.
Reviewing and Analyzing a Compensation Scenario
This section provides an overview of compensation scenario review and analysis and discusses how to:
Run Crystal reports to review your scenario.
Review results of data elements applied to a scenario.
Review merit matrix table setup.
Review pay rules setup.
Review compensation scenario.
Understanding Compensation Scenario Review and AnalysisBy generating a Compensation Planning and Simulation (CPS) scenario and running the Compensation Planning and Simulation Application Engine process (WA_CPS), you produce results that define a compensation strategy and budget. The next step is to review your work and analyze the results of your scenario. To assist you we provide the following analysis tools:
Six Crystal reports to review the setup for your calculation, payout rules, and compensation rules, and compensation models.
The Compensation Scenario Analysis component to review and analyze compensation scenario output.
Note. Using this component you can also make changes to the compensation scenario output. However, if you save changes to an approved scenario the status is reset to awaiting approval.
Analyzing and reviewing your compensation scenario is an iterative process. If you don not think the data output from your scenario is satisfactory, then go back to the various setup steps outlined in this chapter and change the groups and rules as needed. Then run the Compensation Scenario process over again, and analyze and review the results. Keep doing this until you are satisfied you have identified the scenario with the desired results.
Understanding the Compensation Scenario Analysis ComponentThe Compensation Scenario Analysis component provides functionality to enable a compensation analyst to review and alter the results of a CPS scenario online using ACE (Analytic Calculation Engine). ACE is a decision support tool that provides real-time, multidimensional modeling. With ACE the compensation analyst can review, analyze and alter CPS scenario results to ensure they meet the overall compensation strategy and budget of your organization. The analyst can analyze and alter scenario results without having to change the model and rules, and rerun the process.
There are nine pages in the Compensation Scenario Analysis component, each designed to analyze a specific aspect of the compensation scenario output. The Compensation Scenario Summary page is designed to view and analyze the compensation allocation in the scenario across any combination of dimensions. The remaining pages provide a preset combination of dimensions that enable you to alter the data at the plan, rule, group, department and employee level, and by amount or percent.
Pages in the Compensation Scenario Analysis component display one of two views:
Budget plan: For base pay rules a budget plan is the roll up of values for action reasons. For variable pay rules a budget plan is the roll up of the values for variable compensation plan IDs. In this view the budget plan roll-ups are displayed, but not the breakdown of data for individual compensation rules.
Compensation rule: In this view the breakdown of data for individual compensation rules is displayed.
For more information regarding the Analytic Calculation Engine, see the PeopleTools PeopleBook: PeopleSoft Analytic Calculation Engine.
Using the Compensation Scenario Analysis Component
Each page in the Compensation Scenario Analysis component has an analytic grid for multidimensional analysis. The grid contains data cubes (categories of data) and dimensions. You can use the analytic grid to edit your data, pivot data cubes and dimensions (move them between the row and column axis of the grid) to gain a different view of your data, and view selected "slices" of your data. Within an analytic grid, you can expand and collapse those dimensions that have a hierarchical structure; you can also drill down into such dimensions.
You can alter the results of the scenario in the grid. For example, you can alter the Employee Value, Employer Expense or the Allocated Stock Units by entering an amount or percentage in the Alter Method and Amount columns. The Current Altered Amount and Altered Stock Units automatically reflect the result of this change. The system also prorates this change across all rows that roll up to this level. Any changes to the Stock Units are reflected in the Employee Value column. The Total Altered Expense and Total Altered Value reflect the aggregated results of all the changes you make in other pages when altering the data by different dimensions. The Average Value reflect the average amount per employee for each dimension members combination (excluding zero amounts). You can also modify preferences within the grid—saving a particular layout that you have created or returning to the default grid layout.
Note. The system does not allow you to alter a value of 0. For
example, if a row in the Stock Units column displays "0", you cannot adjust
it in the Alter Method and Amount columns.
All prorated amounts are rounded to the nearest cent and stock units
are rounded to whole number. This may result in some discrepancy between target
amounts and total altered amounts, which is expected due to rounding and aggregation.
If multiple users are altering the same model simultaneously, they
may override each other yielding unpredictable results and error messages.
It is thus not recommended that multiple users access the same model simultaneously.
Each grid contains a slice bar, which enables you to view a subset of your data. You can slice your data by choosing from any list—representing data cubes or dimensions—that appears on the slice bar by default. In addition, you can add data cubes or dimensions to the slice bar and use them to view alternate slices of your data.
Each page in the component also contains a graphic chart to represent your data. The bar charts compare the total altered Employer Expense to the total altered Employee Value for the scenario, and a specific dimension (such as budget plan or employee). The x axis displays the first dimension in the grid. When you hold the cursor over the charts, they also display the exact monetary amounts for Total Employer Expense and Total Employee Value for the scenario.
Note. Charts can respond to changes you make in the grid, but this requires that you click the Refresh Chart button.
Although the intersections of data, or dimensions, presented on each page of the Compensation Scenario Analysis component are different, the basic page function and grids are the same. With the Compensation Scenario Analysis component you can:
Review the compensation allocations in the scenario across a given set of dimensions.
Determine if the allocations are in alignment with your organization's compensation strategy and budgeting constraints.
Manipulate the scenario output at the department, group, employee and compensation rule level.
Limiting Access to the Compensation Scenario Analysis Component
You can limit access to the component using PeopleTools security (permission list) so that only certain users can review or alter scenarios. In addition to PeopleTools security, you can strictly limit access to scenarios using scenario-level security. If a user does not have security access for a given scenario, they cannot access it. If you grant users access to a scenario, they have access to all scenario data within that scenario, so that they can view all the data they are approving. Therefore, for those operators you have granted such security, you may also want to grant them department level security for all department within their scenarios. This enables them to review all the employees on pages with department-level security.
Note. When working with the Department dimension in the Compensation Scenario Analysis component, you can only select, view, and drill down to departments and employees for which you are authorized. Non authorized departments and employees are not available. The totals, however, represent the overall total amounts for all employees, regardless of security access.
Pages Used to Review and Analyze Your Compensation Scenario|
Page Name |
Definition Name |
Navigation |
Usage |
|
Data Element Definition report |
RUN_RWA_0016 |
Workforce Analytics, Workforce Reports, Compensation Strategy Reports, Data Elements, Data Element Definition |
Run the Data Element Definition Crystal report (WAC0016). |
|
Goals Matrix report |
RUN_RWA_0015 |
Workforce Analytics, Workforce Reports, Compensation Strategy Reports, Goals Matrix, Goals Matrix |
Run the Goals Matrix Crystal report (WAC0015). |
|
Merit Matrix report |
RUN_RWA_0017 |
Workforce Analytics, Workforce Reports, Compensation Strategy Reports, Merit Matrix, Merit Matrix |
Run the Merit Matrix Crystal report (WAC0017). |
|
Payout Rules report |
RUN_RWA_0014 |
Workforce Analytics, Workforce Reports, Compensation Strategy Reports, Payout Rules, Payout Rules |
Run the Payout Rules Crystal report (WAC0014). |
|
Compensation Rules report |
RUN_RWA_0013 |
Workforce Analytics, Workforce Reports, Compensation Strategy Reports, Compensation Rules, Compensation Rules |
Run the Compensation Rules Crystal report (WAC0013). |
|
CPS Model Definition report |
RUN_RWA_0012 |
Workforce Analytics, Workforce Reports, Compensation Strategy Reports, Compensation Model, CPS Model Definition |
Run the CPS Model Definition Crystal report (WAC0012). |
|
Review Data Elements |
WA_ELEM_INQ |
Workforce Analytics, Compensation Strategy, Analyze and Approve, Review Data Elements, Review Data Elements |
Review the results of the data elements included in a scenario. |
|
Base Pay Rule |
WA_CP_BP_INQ |
Workforce Analytics, Compensation Strategy, Analyze and Approve, Review Rules, Base Pay Rule |
Review the compensation rules setup for base pay rules. |
|
Variable Pay Rule |
WA_CP_VC_INQ |
Workforce Analytics, Compensation Strategy, Analyze and Approve, Review Rules, Variable Pay Rule |
Review the compensation rules setup for variable pay rules. |
|
Compensation Scenario Summary |
WA_CP_ACE_BUD_TOT |
Workforce Analytics, Compensation Strategy, Analyze and Approve, Analyze and Alter Scenario, Compensation Scenario Summary |
Review a summary of the employer expenses versus employee values for a compensation planning scenario. |
|
Budget Plan |
WA_CP_ACE_BUD_ALT |
Workforce Analytics, Compensation Strategy, Analyze and Approve, Analyze and Alter Scenario, Budget Plan |
Review and alter the compensation allocations in the scenario across the budget plan dimension. |
|
Compensation Rule |
WA_CP_ACE_RULE_ALT |
Workforce Analytics, Compensation Strategy, Analyze and Approve, Analyze and Alter Scenario, Compensation Rule |
Review and alter the compensation allocations in the scenario across the budget plan and compensation rule dimensions. |
|
Group and Plan |
WA_CP_ACE_BDGR_ALT |
Workforce Analytics, Compensation Strategy, Analyze and Approve, Analyze and Alter Scenario, Group and Plan |
Review and alter the compensation allocations in the scenario across the eligibility group and budget plan dimensions. |
|
Group and Rule |
WA_CP_ACE_RUGR_ALT |
Workforce Analytics, Compensation Strategy, Analyze and Approve, Analyze and Alter Scenario, Group and Rule |
Review and alter the compensation allocations in the scenario across the eligibility group and compensation rule dimensions. |
|
Department and Plan |
WA_CP_ACE_BDDP_ALT |
Workforce Analytics, Compensation Strategy, Analyze and Approve, Analyze and Alter Scenario, Department and Plan |
Review and alter the compensation allocations in the scenario across the department and budget plan dimensions. |
|
Department and Rule |
WA_CP_ACE_RUDP_ALT |
Workforce Analytics, Compensation Strategy, Analyze and Approve, Analyze and Alter Scenario, Department and Rule |
Review and alter the compensation allocations in the scenario across the department and compensation rule dimensions. |
|
Employee and Plan |
WA_CP_ACE_BDEM_ALT |
Workforce Analytics, Compensation Strategy, Analyze and Approve, Analyze and Alter Scenario, Employee and Plan |
Review and alter the compensation allocations in the scenario across the employee and budget plan dimensions. |
|
Employee and Rule |
WA_CP_ACE_RUEM_ALT |
Workforce Analytics, Compensation Strategy, Analyze and Approve, Analyze and Alter Scenario, Employee and Rule |
Review and alter the compensation allocations in the scenario across the employee and compensation rule dimensions. |
Common Elements Used in the Compensation Scenario Analysis PagesThe following fields are common to each page in the Compensation Scenario Analysis component.
|
Recalculate and Save |
Click to recalculate any allocation values you have modified and save those changes to the database. |
|
Refresh Chart |
Click to refresh the chart and its values when you have modified the results in the grid by dragging and dropping elements |
|
Chart Type |
Select the type of chart you would like displayed for your analysis. You can select Bar or Pie. |
|
Return to Search |
Click link to return to the search page without unloading the current model from the analytic server. This speeds loading of the page next time you access it. |
|
Unload and Return to Search |
Click link to unload the model from the analytic server and return to the search screen. This action helps to free up memory, in consideration of the limited resources of the analytic server. All your saved entries will show in the grid the next time you load the model. The model will also time out and unload after approximately one hour of inactivity. |
|
EmplID |
All employee IDs in the Compensation Scenario Analysis component display a value that is comprised of the employee ID concatenated with the employee record number. Hence, if employee A had an employee ID equal to 100 and an employee record number equal to 1, the employee ID displays 1001 for employee A in the component. |
Running Crystal Reports to Review your Scenario
Use the following Crystal reports to review the data setup for your Compensation Strategy system:
Data Elements Crystal report (WAC0016) for reviewing your data elements.
Goals Matrix Crystal report (WAC0015) for reviewing your goal matrixes.
Merit Matrix Crystal report (WAC0017) for reviewing your merit matrixes.
Payout Rules Crystal report (WAC0014) for reviewing your payout rules.
Compensation Rules Crystal report (WAC0013) for reviewing your compensation rules.
Compensation Model Crystal report (WAC0012) for reviewing your compensation models.
Note. Samples of these reports are provided with your documentation.
See Also
Reviewing the Results of Data Elements Applied to a ScenarioAccess the Review Data Elements page (Workforce Analytics, Compensation Strategy, Analyze and Approve, Review Data Elements, Review Data Elements).
Entering Search Criteria
Use the active fields at the top of the screen to indicate search criteria for the rows of data you want to see displayed in the grid on the bottom of the page.
|
Business Unit and Scenario ID |
Enter a business unit and a scenario ID from the prompt list values, which are from the SP_BU_PF_NONVW and SCENARIO_SRCH tables, respectively. |
|
Fiscal Year and Accounting Period, |
Enter values for fiscal year and accounting period as search criteria. |
|
Data Element ID and Empl ID |
Enter data element ID and empl ID values as further search criteria. These values are optional and are taken from the WA_CP_ELEM_DFN and PERSONAL_SRCH tables, respectively. |
|
Search |
Once you have entered your search criteria, click the Search button. |
|
Data Elements |
After the search is performed the system retrieves the requested rows of data and displays them in the Data Elements grid on the bottom of the page. |
Reviewing the Data Elements Data
Based on your search criteria, the system displays a row of data for each employee in the scenario whose compensation calculations were based on a data element. You use the display to view the results of the data elements after the Compensation Planning and Simulation process is run. For example, if you want to view the results of an employee's goals matrix score, do that here.
Note. If no data is available for the search criteria entered , a note appears in the grid informing you that no data is available.
For each row of data displayed, the system provides the EmplID and:
|
Empl Rcd# (employment record number) |
The Employment Record Number is used for employees with multiple jobs. |
|
Data Element ID |
The Data Element ID and description that was used in a compensation rule for this employee in this scenario. |
|
Measure Amount |
The value associated with the data element. For example, if the data element you are looking at is for a goals matrix score, the measure amount is the actual score. |
Note. On inquiry pages such as this one, row-level security can go down to the employee level. This means, if your implementation has row-level security, and you don't have security to see an employee, you won't. The employees you see in the grid, on this page, can vary depending upon your level of security access.
Reviewing Base Pay Rules SetupAccess the Base Pay Rule (summary) page (Workforce Analytics, Compensation Strategy, Analyze and Approve, Review Rules, Base Pay Rule).
This page summarizes the base pay rules you defined in the Base Pay Rules and Other Pay Rules pages. This page displays the setup for the selected compensation rule from the WA_CP_RULE_DFN table, and different fields display depending upon the compensation rule selected.
Reviewing Variable Pay Rules SetupAccess the Variable Pay Rule (summary) page (Workforce Analytics, Compensation Strategy, Analyze and Approve, Review Rules, Variable Pay Rule).
This page summarizes the base pay rules you defined in the Variable Pay Rules and Other Pay Rules pages. This page displays the setup for the selected compensation rule from the WA_CP_RULE_DFN table, and different fields display depending upon the compensation rule selected.
Reviewing the Compensation Scenario SummaryAccess the Compensation Scenario Summary page (Workforce Analytics, Compensation Strategy, Analyze and Approve, Analyze and Alter Scenario, Compensation Scenario Summary).
The Compensation Scenario Summary page displays period level data about the scenario compensation costs. The compensation costs are categorized as either an Employer Expense or an Employee Value. For each accounting Period, the system displays the monetary amounts for the Average Value, total altered Employee Value, and total Altered Employer Expense.
The page also includes all the dimensions and attributes available for analysis as well as variance columns to reflect the results of your changes in the other pages. These variance columns are: Expense Variance, Value Variance, Stock Units Variance. The variances indicate the difference between the original scenario budgeted amounts and your alterations.
Note. You cannot make alterations in this page.
Reviewing the Budget PlanAccess the Budget Plan page (Workforce Analytics, Compensation Strategy, Analyze and Approve, Analyze and Alter Scenario, Budget Plan).
The Budget Plan page displays budget plan rule level data about the scenario compensation costs. The compensation costs are categorized as either an Employer Expense or an Employee Value. For each budget plan the system also displays the monetary amounts for the Average Value, Current Altered Amount, Altered Employee Value, Total Altered Employer Expense, and Average Altered Value.
You can use this page to alter the amounts using the Alter Method and Amount cells, when available.
Reviewing the Compensation RuleAccess the Compensation Rule page (Workforce Analytics, Compensation Strategy, Analyze and Approve, Analyze and Alter Scenario, Compensation Rule).
The Compensation Rule page displays budget plan rule level data about the scenario compensation costs. The compensation costs are categorized as either an Employer Expense or an Employee Value. For each budget plan the system also displays the monetary amounts for the Average Value, Current Altered Amount, Altered Employee Value, Total Altered Employer Expense, and Average Altered Value.
You can also alter the amounts on this page using the Alter Method and Amount cells, when available.
Reviewing the Workforce Group and Budget PlanAccess the Group and Plan page (Workforce Analytics, Compensation Strategy, Analyze and Approve, Analyze and Alter Scenario, Group and Plan).
The Group and Plan page displays budget plan rule level data about the scenario compensation costs. The compensation costs are categorized as either an Employer Expense or an Employee Value. For each budget plan the system also displays the monetary amounts for the Average Value, Current Altered Amount, Altered Employee Value, Total Altered Employer Expense, and Average Altered Value.
You can also alter the amounts on this page using the Alter Method and Amount cells, when available.
Reviewing the Workforce Group and Compensation RuleAccess the Group and Rule page (Workforce Analytics, Compensation Strategy, Analyze and Approve, Analyze and Alter Scenario, Group and Rule).
The Group and Rule page displays budget plan rule level data about the scenario compensation costs. The compensation costs are categorized as either an Employer Expense or an Employee Value. For each budget plan the system also displays the monetary amounts for the Average Value, Current Altered Amount, Altered Employee Value, Total Altered Employer Expense, and Average Altered Value.
You can also alter the amounts on this page using the Alter Method and Amount cells, when available.
Reviewing the Department and Budget PlanAccess the Department and Plan page (Workforce Analytics, Compensation Strategy, Analyze and Approve, Analyze and Alter Scenario, Department and Plan).
The Department and Plan page displays budget plan rule level data about the scenario compensation costs. The compensation costs are categorized as either an Employer Expense or an Employee Value. For each budget plan the system also displays the monetary amounts for the Average Value, Current Altered Amount, Altered Employee Value, Total Altered Employer Expense, and Average Altered Value.
This page enables you to view the department data by departmental roll-up totals or for one department only. You can also alter the amounts on this page using the Alter Method and Amount cells, when available.
Reviewing the Department and Compensation RuleAccess the Department and Rule page (Workforce Analytics, Compensation Strategy, Analyze and Approve, Analyze and Alter Scenario, Department and Rule).
The Department and Rule page displays budget plan rule level data about the scenario compensation costs. The compensation costs are categorized as either an Employer Expense or an Employee Value. For each budget plan the system also displays the monetary amounts for the Average Value, Current Altered Amount, Altered Employee Value, Total Altered Employer Expense, and Average Altered Value.
You can also alter the amounts on this page using the Alter Method and Amount cells, when available.
Reviewing the Employee and Budget PlanAccess the Employee and Plan page (Workforce Analytics, Compensation Strategy, Analyze and Approve, Analyze and Alter Scenario, Employee and Plan).
The Employee and Plan page displays budget plan rule level data about the scenario compensation costs. The compensation costs are categorized as either an Employer Expense or an Employee Value. For each budget plan the system also displays the monetary amounts for the Average Value, Current Altered Amount, Altered Employee Value, Total Altered Employer Expense, and Average Altered Value.
This page enables you to view the department data by departmental roll-up totals or for one department only. You can also see simulated employees belonging to a selected department. To select an individual employee you can drag the employee dimension to the slicer You can also alter the amounts on this page using the Alter Method and Amount cells, when available.
Reviewing the Employee and Compensation RuleAccess the Employee and Rule page (Workforce Analytics, Compensation Strategy, Analyze and Approve, Analyze and Alter Scenario, Employee and Rule).
The Employee and Rule page displays budget plan rule level data about the scenario compensation costs. The compensation costs are categorized as either an Employer Expense or an Employee Value. For each budget plan the system also displays the monetary amounts for the Average Value, Current Altered Amount, Altered Employee Value, Total Altered Employer Expense, and Average Altered Value.
You can also alter the amounts on this page using the Alter Method and Amount cells, when available.
Manually Loading the Analytic Model
When you run the Compensation Planning and Simulation (WA_CPS) process, it automatically calls the Load Analytic Model (WA_CP_BAM_LD) application engine to generate an analytic model instance with the same ID as the scenario ID. Therefore, you can use the Load Compensation Planning Analytic Model run control page to manually load or reload the analytic model. You can also use it to load the scenario results into multiple analytic models to test (and save) different assumptions.
However you cannot load multiple scenarios into a single model—loading a scenario into a model overwrites any preexisting scenario. Also reloading the same scenario into the same analytic model will reset any adjustments made to this scenario. You should create multiple analytic models for different users or different sets of assumptions.
Note. There is no need to load multiple models for analysis
only, the default model should be sufficient.
Due to the limited resource of ACE, you should try to reuse the same
model ID whenever possible.
Both approved and pending scenarios can be reloaded. If the scenario/model
was already approved, the status is reset to awaiting approval.
See Generating the Compensation Planning Scenario.
Page Used to Manually Load the Analytic Model|
Page Name |
Definition Name |
Navigation |
Usage |
|
Load Compensation Planning Analytic Model |
RUN_WA_CP_BAM_LOAD |
Workforce Analytics, Compensation Strategy, Setup Compensation Scenario, Load Analytic Model, Load Compensation Planning Analytic Model |
Manually load the results of a compensation scenario into an analytic model. |
Running the Load Analytic Model ProcessAccess the Load Compensation Planning Analytic Model (run control) page (Workforce Analytics, Compensation Strategy, Setup Compensation Scenario, Load Analytic Model, Load Compensation Planning Analytic Model).
|
Business Unit |
Select a business unit from the prompt list values. |
|
Scenario ID |
Select a Scenario ID from the prompt list values. |
|
Analytic Model ID |
Enter a new or existing ace model ID. |
Approving a Compensation Planning Scenario and Passing the Data to
the Planning and Budgeting Application
Once you have analyzed your scenario output and made a decision that the scenario has the desired results, your next step is to approve the results. A compensation planning scenario can be approved using the Compensation Scenario Approval (WA_CPS_APPRV) application engine process, accessed via the Compensation Scenario Approval page. Due to the large number of rows of data that need to be moved to the target tables, it is more efficient to use an application engine batch process.
Note. When you run the Compensation Scenario Approval application engine process, the system updates the scenario status to Approved. You can reapprove an approved scenario (destructive load for the selected business unit/scenario), but the system warns you that the scenario was already approved for the specified business unit.
Bringing Altered Scenario Data Back from ACE
When you have worked with an ACE model and run the scenario approval process, the system loads the CPS final output table WA_CALC_TGT, with the new information from the ACE Model.
Loading Compensation Planning Scenario Data Into Planning and Budgeting Tables
The WA_CPS_APPRV application engine process also enables you to load your compensation planning forecast scenario data into Position Budgeting tables in the Planning and Budgeting application. Some of the compensation planning information loaded into the position budgeting tables include:
Employee information: such as existing and simulated employee IDs, employee status, business unit, position, job code, department, and location.
Salary information: such as annual salary and annualized earning amounts.
Benefits information: such as benefits plan type and annualized employer expense.
The compensation planning scenario data that is provided to Position Budgeting originates from the following Workforce tables:
WA_JOB_S00
WA_CALC_F00
WA_CALC_TGT
WA_CP_RULE_TBL
POSITION_DATA
The aforementioned Workforce tables load the following Position Budgeting tables:
BP_JOB_F00: loaded by the WA_JOB_S00,
BP_COMP_F00: loaded by the WA_CALC_F00, WA_CALC_TGT, WA_JOB_S00, WA_CP_RULE_TBL tables.
Note. BP_POSITION_D00 is loaded from POSITION_DATA
Once you have specified Workforce tables as a data source in the Position Budgeting feature, simply run this application engine process and the compensation planning scenario data is transferred to the applicable tables.
See Integrating with Other Applications.
The additional compensation planning data provides the Position Budgeting feature with more granular compensation, employee, and salary information, and more flexibility when planning resource changes, such as headcount and salary.
Warning! When loading compensation planning scenario data into Position Budgeting, do not approve analytic models if they do not include current pay; this may skew the salary amounts.
Page Used to Run the Compensation Scenario Approval Process |
Page Name |
Definition Name |
Navigation |
Usage |
|
Compensation Scenario Approval |
RUN_WA_CPS_APPROVE |
Workforce Analytics, Compensation Strategy, Analyze and Approve, Approve Scenario, Compensation Scenario Approval |
Run the Compensation Scenario Approval (WA_CPS_APPRV) application engine process. |
Running the Compensation Scenario Approval ProcessAccess the Compensation Scenario Approval page (Workforce Analytics, Compensation Strategy, Analyze and Approve, Approve Scenario, Compensation Scenario Approval).
Specify the parameters for running the Compensation Scenario Approval (WA_CPS_APPRV) Application Engine process.
|
Business Unit and Scenario ID |
Approval for CPS scenarios is done by Business Unit and Scenario ID, and the prompt list values are from the WA_CP_APPROV_TBL table. you can only run the scenario approval process from this page. You cannot run the scenario approval process from the Run Jobstreams page. Note. In addition to PeopleTools page security, you can strictly limit access to scenarios for approval using scenario-level security. This means, if a user doesn't have security access for a given scenario, they cannot approve it. If you grant a user access to a scenario approval page and a scenario, they have access to all scenario data within that scenario approval page, to enable them to view all the data they are approving. Therefore, for those operators you have granted such security, you may also want to grant them department and employee-level security for all departments and employees within their scenarios. This enables them to review all the employees on other pages with department or employee-level security, such as the analysis pages. |
|
Analytic Model ID |
Select from the list which displays all the analytic models with altered scenario data for this scenario. Leave blank if you didn't use ACE to alter a scenario, or if you wish to approve the original non altered scenario results. |