dbx in the IDE
You can use dbx in Oracle Solaris Studio IDE by opening your project, creating breakpoints in the source, and clicking the Debug button. The IDE enables you to use menu options and buttons to step through your program, and provides a complete set of debugging windows.
As with building your application, the IDE debugs your application as a project. You can also use the IDE to debug executables that are not associated with an IDE project.
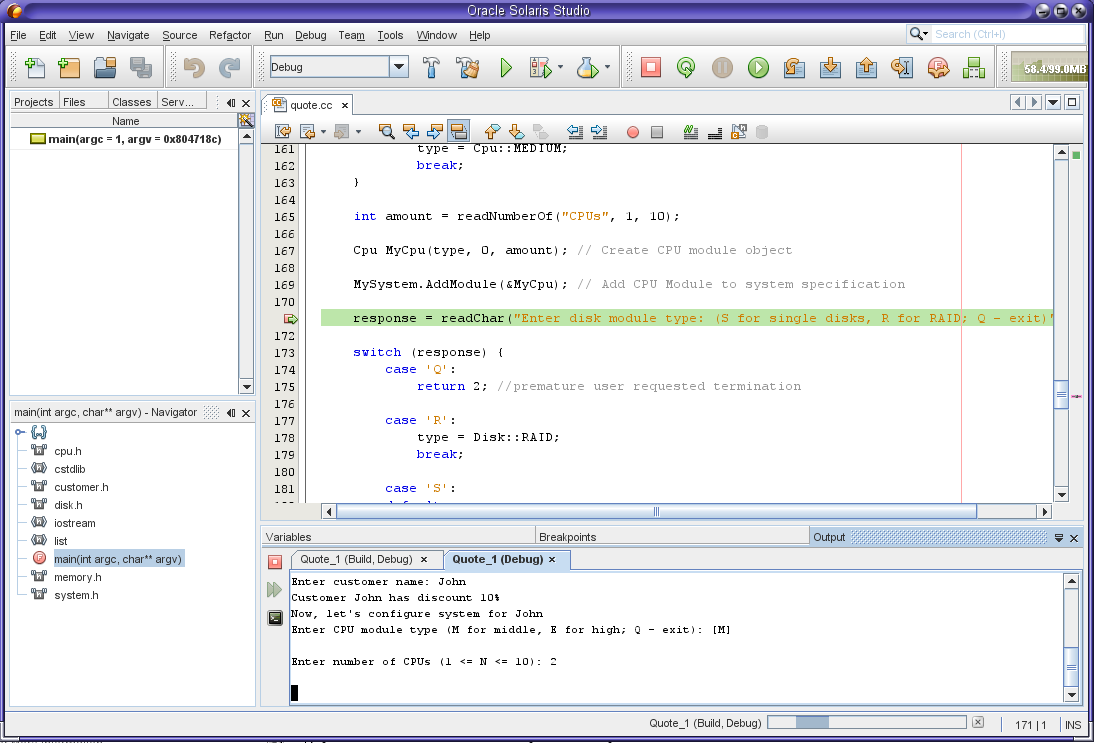
In the following screen capture, one of the IDE sample projects is running in dbx. You can use commands in the Debug menu or the buttons at the top right in the IDE window to control the debugger. As you use the Debug commands and buttons, the IDE issues commands to dbx and displays output in the various debugging windows.

In the figure , the debugger is stopped at a breakpoint and the Output window shows the program interaction. Some debugger windows such as Variables and Breakpoints are also shown but not selected. You can open more debugging windows by selecting from the Window → Debugging menu. One of the debugging windows is the Debugger Console window, which displays the interaction with dbx. You can also type commands at the (dbx) prompt in the Debugger Console window.
For more information about using dbx in the IDE, see the integrated help in the IDE and Oracle Solaris Studio 12.4: IDE Quick Start Tutorial .