Data Races in prime_omp.c
To examine data races in prime_omp.c, you can use one of the experiments you created in Create a Data-Race-Detection Experiment.
To show the data race information in the prime_omp_instr.er experiment with er_print, type the following command.
% er_print prime_omp_inst.er
At the (er_print) prompt, type races to see output similar to the following:
(er_print) races

Total Races:  3 Experiment:  prime_omp_inst.er

Race #1, Vaddr: 0x219c8
      Access 1: Write, line 25 in "prime_omp.c",
                       is_prime
      Access 2: Read,  line 22 in "prime_omp.c",
                       is_prime
  Total Callstack Traces: 1

Race #2, Vaddr: (Multiple Addresses)
      Access 1: Write, line 49 in "prime_omp.c",
                       main
      Access 2: Write, line 49 in "prime_omp.c",
                       main
  Total Callstack Traces: 1

Race #3, Vaddr: 0xffbff604
      Access 1: Write, line 50 in "prime_omp.c",
                       main
      Access 2: Write, line 50 in "prime_omp.c",
                       main
  Total Callstack Traces: 1
Three data races occurred during this particular run of the program.
To open the prime_omp_inst.er experiment in Thread Analyzer, type the following command:
% tha prime_omp_inst.er
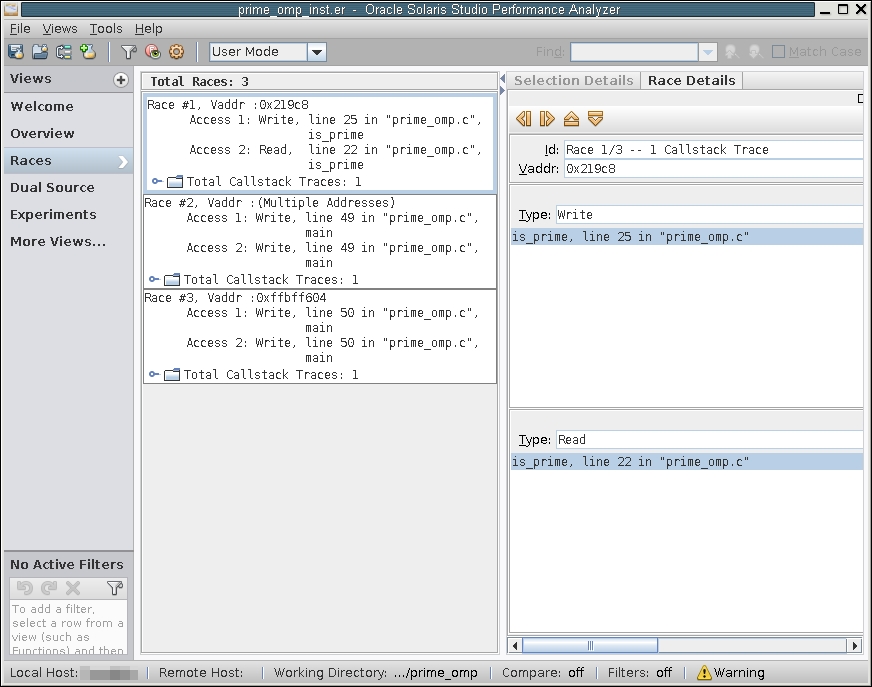
The following screen shot shows the races that were detected in prime_omp.c as displayed by Thread Analyzer.
Figure 2-1 Data Races Detected in prime_omp.c

-
Race #1 shows a race between a write in the function is_prime on line 25 and a read in the same function on line 22. If you look at the source code you can see that on these lines, the pflag[ ] array is being accessed. In Thread Analyzer, you can click the Dual Source view to easily see the source code at both line numbers along with metrics showing the number of race accesses on the affected lines of code.
-
Race #2 shows a race between two writes to line 49 of the main function. Click the Dual Source view to see that there are multiple attempts to access the value of the primes [ ] array in line 49.
-
Race #3 shows a race between two writes to line 50 of the main function. Click the Dual Source view to see that there are multiple attempts to access the value of the primes [ ] array in line 50.
Race #3 represents a group of data races that occur in different elements of the array primes[ ]. This is indicated by the Vaddr specified as Multiple Addresses.
Three data races are shown in prime_omp.c:
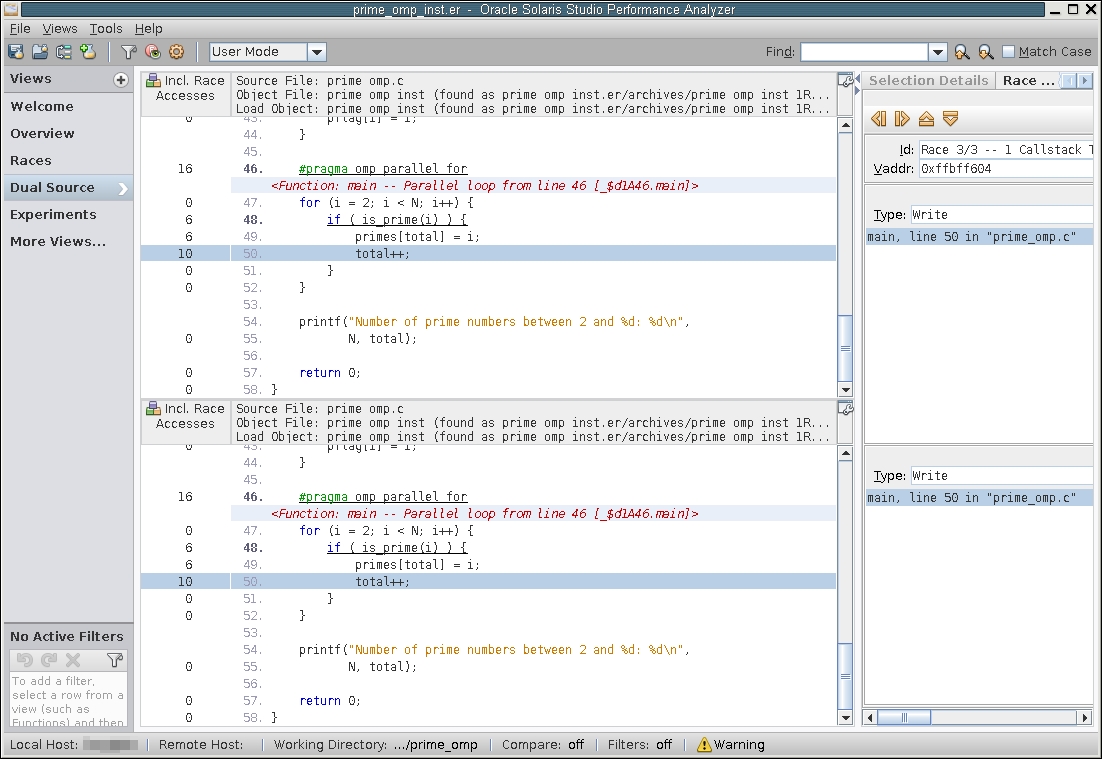
The Dual Source view in Thread Analyzer enables you to see the two source locations associated with a data race at the same time. For example, select Race #3 for prime_pthr.c in the Races view and then click on the Dual Source view. You will see something similar to the following.
Figure 2-2 Source Code of Data Races Detected in prime_omp.c

Tip - You might need to drag the mouse on the header of each source panel to see the Race Accesses metrics in the left margin of the Dual Source view.