Call Stack Traces of Data Races
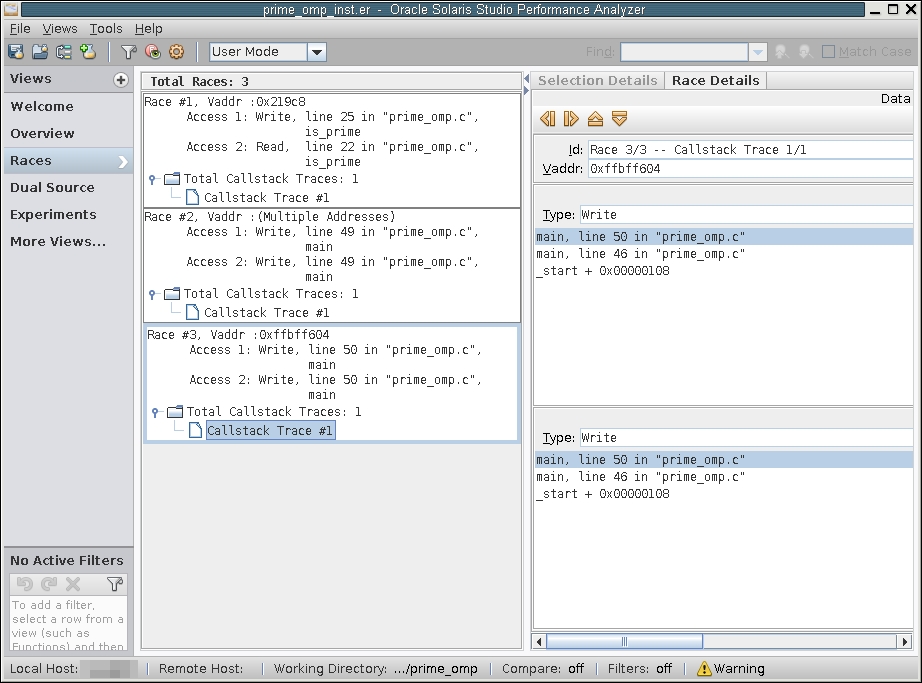
Each data race listed in the Races view of Thread Analyzer also has one or more associated Call Stack Traces. The call stacks show the execution paths through the code that lead to a data race. When you click a Call Stack Trace, the Race Details window in the right panel shows the function calls that lead to the data race.
Figure 2-5 Races View with Call Stack Traces for prime_omp.c
