Data Races in prime_pthr.c
To examine data races in prime_pthr.c, you can use one of the experiments you created in Create a Data-Race-Detection Experiment.
To show the data race information in the prime_pthr_instr.er experiment with er_print, type the following command:
% er_print prime_pthr_inst.er
At the (er_print) prompt, type races to see output similar to the following:
(er_print) races


Total Races:  5 Experiment:  prime_pthr_inst.er

Race #1, Vaddr: 0x28c28
      Access 1: Write, line 26 in "prime_pthr.c",
                       is_prime + 0x0000022C
      Access 2: Write, line 26 in "prime_pthr.c",
                       is_prime + 0x0000022C
  Total Callstack Traces: 2

Race #2, Vaddr: (Multiple Addresses)
      Access 1: Read,  line 23 in "prime_pthr.c",
                       is_prime + 0x000000E4
      Access 2: Write, line 26 in "prime_pthr.c",
                       is_prime + 0x0000022C
  Total Callstack Traces: 2

Race #3, Vaddr: 0xffbff5bc
      Access 1: Write, line 59 in "prime_pthr.c",
                       main + 0x000001F4
      Access 2: Read,  line 39 in "prime_pthr.c",
                       work + 0x0000006C
  Total Callstack Traces: 1

Race #4, Vaddr: 0x216f0
      Access 1: Write, line 44 in "prime_pthr.c",
                       work + 0x00000174
      Access 2: Write, line 44 in "prime_pthr.c",
                       work + 0x00000174
  Total Callstack Traces: 2

Race #5, Vaddr: (Multiple Addresses)
      Access 1: Write, line 43 in "prime_pthr.c",
                       work + 0x0000012C
      Access 2: Write, line 43 in "prime_pthr.c",
                       work + 0x0000012C
  Total Callstack Traces: 1
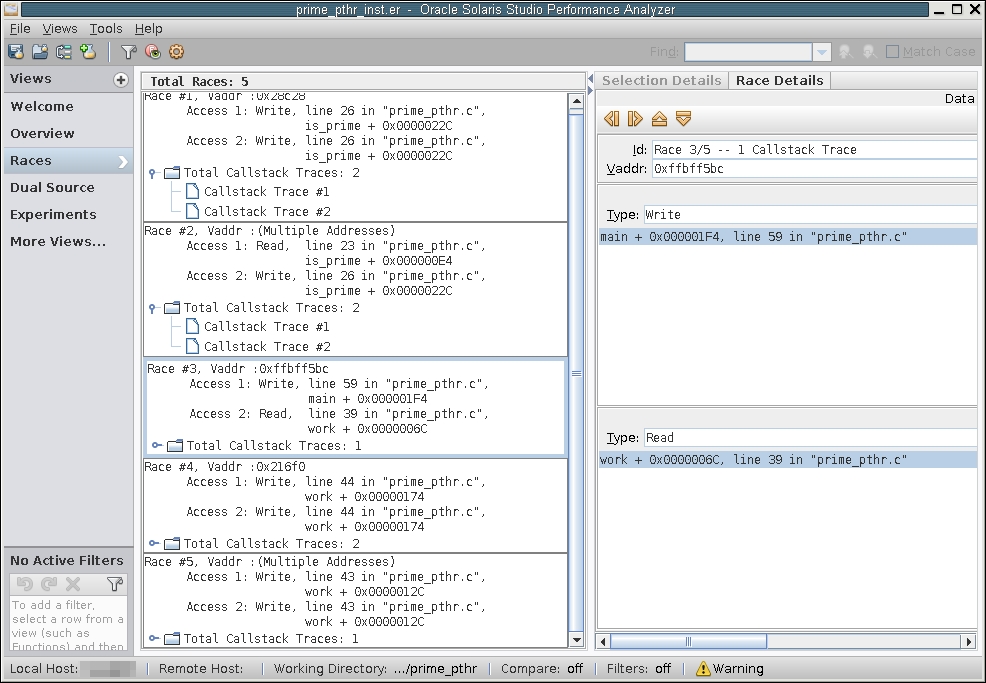
Five data races occurred during this particular run of the program.
To open the prime_pthr_inst.er experiment in Thread Analyzer, type the following command:
% tha prime_pthr_inst.er
The following screen shot shows the races detected in prime_pthr.c as displayed by Thread Analyzer. Notice that they are the same as the races shown by er_print.
Figure 2-3 Data Races Detected in prime_pthr.c

-
Race #1 is a data race between a write to the pflag[ ] array in function is_prime on line 26 and another write to pflag[ ] on the same line.
-
Race #2 is a data race between a read on line 23 for pflag[ ]and a write on to pflag[ ] array in function is_prime on line 26.
-
Race #3 is a data race between a write on line 59 to the memory location named i in main() and a read on line 39 from the same memory location (named *arg in work()).
-
Race #4 is a data race between a write to primes[total] on line 44 and another write to primes[total] the same line.
-
Race #5 is a data race between a write to total on line 46 and another write to total on the same line.
Five data races are shown in prime_pthr.c:
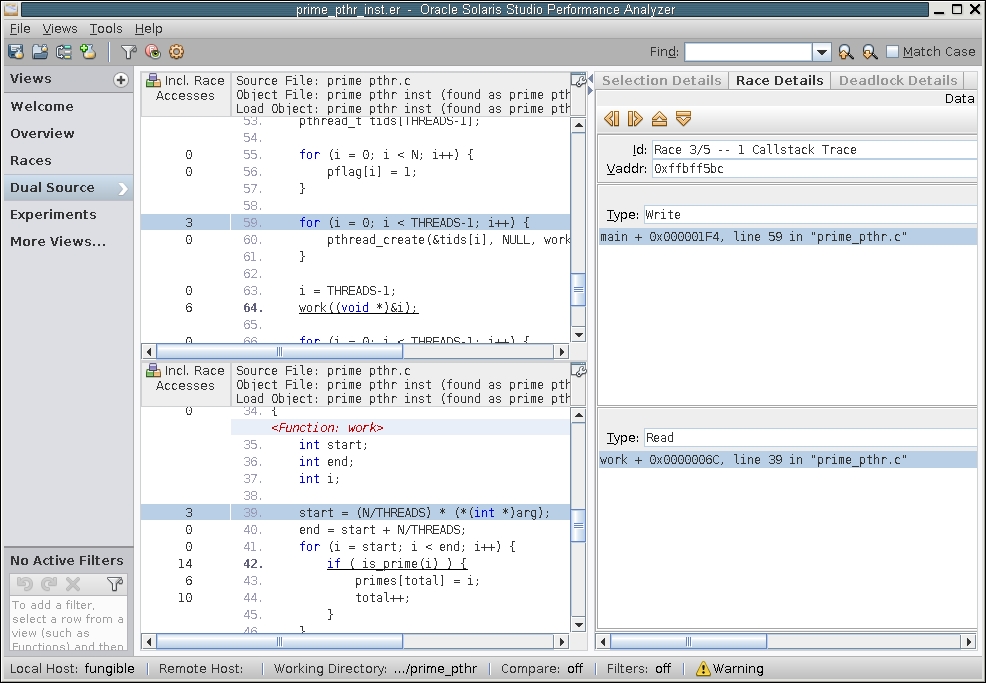
If you select Race #3 and then click the Dual Source view, you see the two source locations, similar to the following screen shot.
Figure 2-4 Source Code Details of a Data Race

The first access for Race #3 is at line 59 and is shown in the top panel. The second access is at line 40 and is shown in the bottom panel. The Race Accesses metric is highlighted at the left of the source code. This metric gives a count of the number of times a data race access was reported on that line.