For correlation overviews, see About Correlating Assumptions and Guidelines for Correlating Assumptions.
In Matrix view, the Define Correlations dialog shows correlated assumptions in a matrix (Figure 101, Define Correlations Dialog in Matrix View, Unlinked). You can use the menus and buttons to add and remove assumptions and perform other actions (About the Define Correlations Dialog). Click the listed links for additional information.
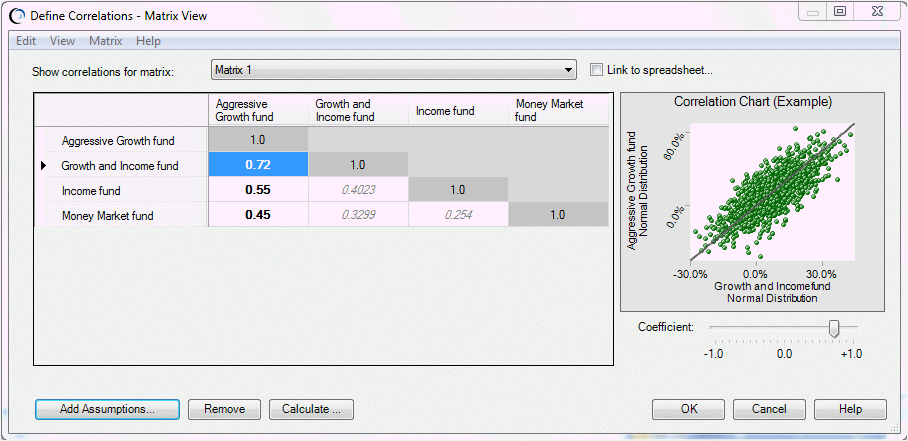
The correlation matrix is either an upper or lower triangular matrix with 1s along the diagonal. If you follow one assumption along its horizontal row and the second along its vertical column, the value in the cell where they meet is their Spearman rank order correlation coefficient. By default, the matrix contains the correlation coefficients that you enter directly and indirect correlations calculated from those (shown in italics). You can use the View menu to switch between List view and Matrix view, and you can create matrixes that are linked to a range of correlation values in the worksheet.
If several matrixes are already defined, the Show correlations for matrix list enables you to select one.
You can define matrixes in the dialog box (Correlating a Group of Assumptions with Each Other) or you can create them from a matrix of values in a worksheet (Defining Correlations with a Linked Matrix). Once you define a matrix, you can open it for reviewing and editing (Viewing and Editing Linked Matrixes).