A filter panel is a type of panel stack that contains only selectors, which users interact with to filter the data displayed in a dashboard. For example, a dashboard displays sales data by product category for the years 2007 to 2010. A user can filter the data to display sales data for only the books and movies categories, and only for 2010.
Panel stacks allow a designer to create several different views (panels) of data, with each view (panel) containing a logical grouping of controls that display data that is related in a meaningful way. Panels are essential building blocks for interactive dashboards, which summarize key business indicators in easy-to-read interfaces. For an introduction to panel stacks, see About layering data in dashboards: Panels and panel stacks.
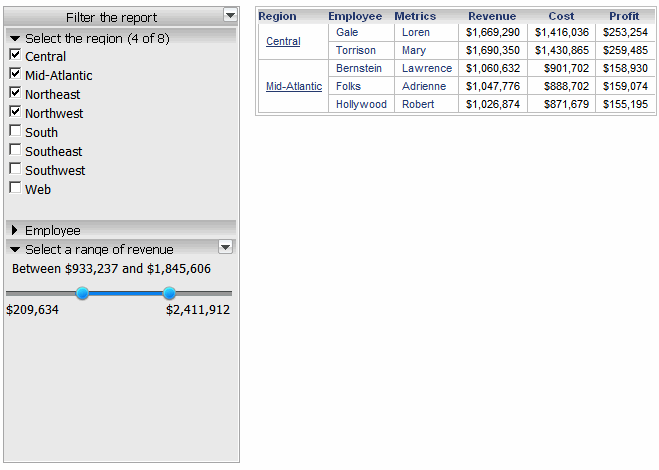
An analyst can use the selectors to filter the data on the grid report, as shown below.
The analyst has selected Central, Mid-Atlantic, Northeast, and Northwest in the region selector. Notice that the title of the region selector indicates that four of the eight elements are selected.
The analyst collapsed the employee selector, to focus on the selectors that she is using.
The analyst has selected a revenue range of $933,237 to $1,845,606, which explains why only two regions of the selected four are displayed. (The other two regions do not have employee revenue that falls within the selected range.)

In Flash Mode in XBRi, and on an iPad with the XBR Ingenium mobile app, an analyst can:
Filter the target by using the various selectors on the filter panel
Expand
and collapse each selector on the filter panel, using the  and
and  icons on each selector
Expand
and collapse all the selectors on the filter panel, using the ![]() menu on the filter panel
menu on the filter panel
Clear
a selector, using the  icon on each selector
Clear
all the filters on the filter panel, using the  icon
icon
By default, changes made to the selectors on the filter panel are automatically applied to the targets. You can change the automatic apply property so that an Apply button is displayed on the filter panel. When a change is made to a selector on the filter panel, the Apply button is enabled. For a more detailed description, including examples, and instructions, see Controlling how data updates in a filter panel: Automatic apply.
Related topics
Inserting a filter panel into a dashboard
Using a title bar in a panel stack
Renaming a panel or changing display order in a panel stack
Deleting a panel from a panel stack
Accessing the Panel Stack floating toolbar
Hiding title bars of a panel stack
About formatting panels and panel stacks
Enabling panel selector arrows on a panel stack
_____________________________
Copyright © 2019, Oracle and/or its affiliates. All rights reserved.
Legal Notices