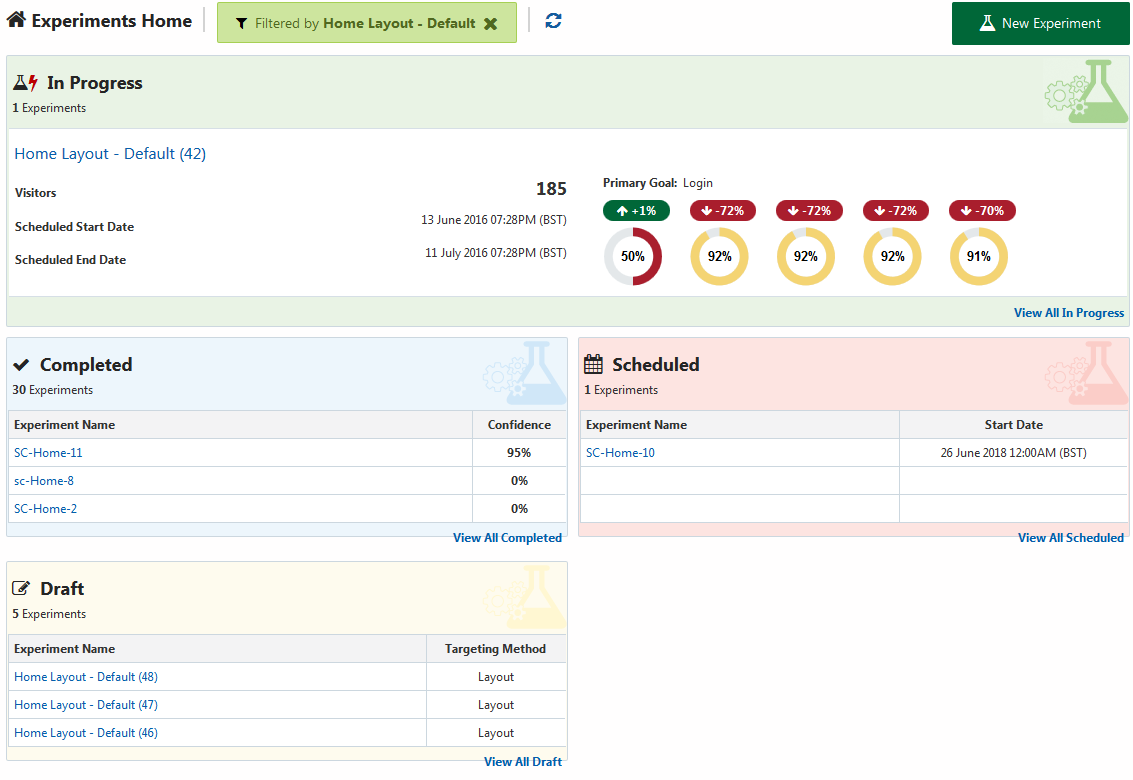
When you open Oracle Experiments you are presented with the Experiments Home page.

Experiments Home page
You can return to the Experiments Home page at any time by clicking on Oracle Experiments in the header bar.
There are four panels displayed on the Experiments Home page. These are:
In Progress: This displays a summary of the most recently started experiment with In Progress status.
This displays the number of In Progress experiments as well as the following information about the most recently started In Progress experiment:
Experiment Name: This is a link which brings you to the Configuration screen for the experiment.
Visitors: This is a count of the number of visitors who have participated in the experiment.
Scheduled Start Date: This is the date and time, including time zone, when the experiment started.
Scheduled End Date: This is the date and time, including time zone, when the experiment is scheduled to end.
Primary Goal: This is the name of the primary goal for the experiment.
Percentage Improvement for Primary Goal: This figure compares how often the primary goal occurs in each variant for the experiment against how often the primary goal compares in the control for the experiment. If the primary goal occurred more often in a variant than in the control, this figure is green. If the primary goal occurred the same number of times in a variant as in the control, the figure is black. If the primary goal occurred less often in a variant than in the control, the figure is red.
Confidence Level for Primary Goal: This figure shows the statistical significance level for the primary goal in each variant for the experiment. A traffic-light system is in place to indicate how close to statistical significance the result is for this goal. A value of 84% or lower is displayed in red, 85%-94% is displayed in yellow, and 95% or above is displayed in green.
You can view all the experiments with In Progress status by clicking on the View All In Progress link in this panel.
Completed: This displays a summary of the most recently completed experiments.
This panel displays how many completed experiments there are and also displays a table with the following fields:
Experiment Name: This is the name of the experiment. Clicking on the name brings you to the Configuration screen for that experiment.
Confidence: This is the statistical significance level for the primary goal on the variant for this experiment. A traffic-light system is in place to indicate how close to statistical significance the result is for this goal. A value of 84% or lower is displayed in red, 85%-94% is displayed in yellow, and 95% or above is displayed in green.
You can view all the completed experiments by clicking on the View All Completed link in this panel.
Scheduled: This displays a summary of the next experiments scheduled to start.
This panel displays how many scheduled experiments there are and also displays a table with the following fields:
Experiment Name: The name of the experiment. Clicking on the name brings you to the Configuration screen for that experiment.
Start Date: The date and time, including time zone, at which the experiment is scheduled to start.
You can view all the scheduled experiments by clicking on the View All Scheduled link in this panel.
Draft: This displays a summary of the most recently modified experiments with Draft status which are currently unscheduled.
This panel displays how many experiments with draft status there are and then displays a table with the following fields:
Experiment Name: The name of the experiment. Clicking on the name brings you to the Configuration screen for that experiment.
Targeting Method: This indicates whether layout targeting or URL targeting was used to create the experiment.
You can view all the draft experiments by clicking on the View All Draft link in this panel.
You can refresh the information displayed on the Experiments Home page by clicking on the Refresh icon at the top of the page.
If a filter is in place, you can remove the filter by clicking on the X in the filter box.

