You can view the results of an experiment by clicking on the experiment name either in the Completed Experiments or In Progress Experiments pages, or by clicking on the Results button on the Experiment Configuration page.
This opens the Experiment Configuration screen with the Results panel on display.
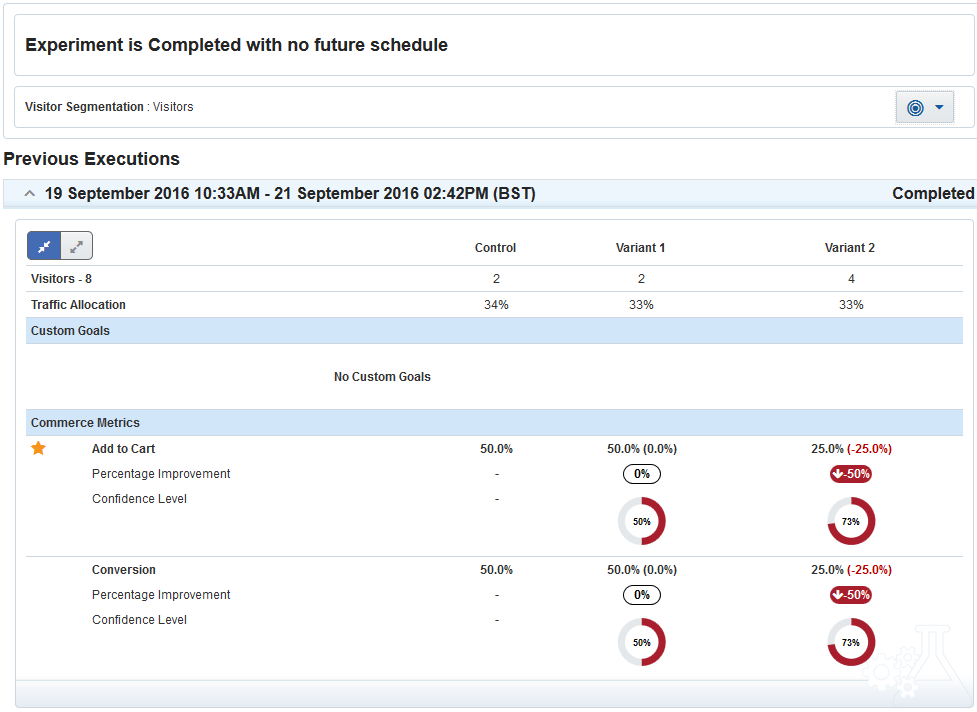
Results panel
The top panel on the results panel displays the current status of the experiment. It informs you whether the experiment is currently in progress and, if not, whether a future schedule is in place to re-run the experiment.
If the experiment is currently in progress it also displays the Start Date and scheduled End Date for the experiment.
If the experiment has been re-scheduled it also displays the re-scheduled Start Date and End Date for the experiment.
The second panel allows you to customize which commerce metrics are included in the results displayed. Click on the button in this panel to display a dropdown box that shows which custom goals and commerce metrics are displayed in the results panel. You can add or remove any of the commerce metrics by clicking on the tick box for that metric. All commerce metrics with a tick in the box are displayed in the results panel. Once you have selected which commerce metrics to display, click on the Save button to save your selection. This refreshes the result panel to include or exclude commerce metrics based on your selection.
This panel also allows you to decide whether to display results in terms of visitors or visits by clicking on the Visitor Segmentation dropdown and making your choice.
The third panel displays the data gathered by the experiment. The data in this panel is separated into the control and variant paths. It shows the total number of visitors who participated in the experiment, which is then broken down into how many participated on the control path and how many participated on the variant path. It also displays the traffic allocation settings for the control and for each variant in the experiment.
The following data is displayed for any custom goals defined for the experiment, and for the Add to Cart and Conversion commerce metrics:
Goal Name: This is the name of the goal.
Engagement: This is the number of visitors who met this goal.
Note: Engagement is only visible if you expand the result set by clicking on the Expand button at the top of the result set and is hidden if you click on the Collapse button.

Collapse and Expand buttons
Percentage Improvement: This figure compares how often the primary goal occurs in the variant against how often the primary goal compares in the control for the experiment. If the primary goal occurred more often in the variant than in the control, this figure is green. If the primary goal occurred the same number of times in the variant as in the control, the figure is black. If the primary goal occurred less often in the variant than in the control, the figure is red.
Confidence Level: This is a rounded percentage figure which shows the statistical significance level for each goal. It is measured against a set statistical significance level of 95%. A traffic-light system is in place to indicate how close to statistical significance the result is for the relevant goal. A value of 84% or lower is displayed in red, 85%-94% is displayed in yellow, and 95% or above is displayed in green. Confidence level is not displayed for the Average Order Value, Revenue Per Visitor, or Revenue Per Visit commerce metrics.
The results for the Average Order Value and Revenue per Visitor commerce metric are segmented by the currency in which the transaction occurred to ensure consistency in the comparisons. There is a separate entry for these metrics for each currency that was used when placing an order during the experiment.
The results for the Average Order Value commerce metric contains the following data:
Average Order Value: This is the total revenue of all orders placed by visitors during their participation in the experiment divided by the number of orders placed by visitors who participated on the relevant path in the experiment.
Number of Orders: This is the total number of orders placed by visitors during their participation in the experiment.
Total Revenue: This is the combined value of all the orders placed by visitors during their participation in the experiment.
Percentage Improvement: This compares the Average Order Value on the control path to the average order value on the variant path and displays the difference as a percentage. If the Average Order Value on the variant is greater on the variant path, this figure is displayed in green. If the Average Order Value is equal on both paths the figure is black. If the Average Order Value is greater on the control path, the figure is displayed in red.
If you have chosen Visitor from the Visitor Segmentation dropdown, the results for the Revenue per Visitor commerce metric contains the following data:
Revenue per Visitor: This is the total revenue of all orders placed by visitors during their participation in the experiment divided by the number of visitors who participated on the relevant path in the experiment.
Total Revenue: This is the total value of all the orders placed by visitors during their participation in the experiment.
Percentage Improvement: This compares the Revenue per Visitor on the control path to the Revenue per Visitor on the variant path and displays the difference as a percentage. If the Revenue per Visitor on the variant is greater on the variant path, this figure is displayed in green. If the Revenue per Visitor is equal on both paths the figure is black. If the Revenue per Visitor is greater on the control path, the figure is displayed in red.
If you have chosen Visit from the Visitor Segmentation dropdown, the results for the Revenue per Visit commerce metric contains the following data:
Revenue per Visit: This is the total revenue of all orders placed by visitors during their participation in the experiment divided by the number of visits made to the website by participants in the experiment.
Total Revenue: This is the total value of all the orders placed by visitors during their participation in the experiment.
Percentage Improvement: This compares the Revenue per Visit on the control path to the Revenue per Visit on the variant path and displays the difference as a percentage. If the Revenue per Visit on the variant is greater on the variant path, this figure is displayed in green. If the Revenue per Visit is equal on both paths the figure is black. If the Revenue per Visit is greater on the control path, the figure is displayed in red.
If the experiment is currently in progress you can refresh the result set by clicking on the Refresh icon in the Results panel.
The results sets for any previous executions of the experiment are displayed as an accordion view ordered by End Date with the most recent result set at the top of the list. You can expand or collapse these result sets by clicking on the chevron beside the start and end dates for the result set. Expanding a result set will display the result data for that execution of the experiment.
