Customize the Dashboard
The dashboard is fully customizable. There are over 50 different panes to display, each one showing a different set of analytic and summary data collected by STA. You can include a maximum of 30 panes at one time.
See Also: Dashboard Pane Types for descriptions of the available panes.
Change the Size of Dashboard Panes
Change the size of the individual dashboard panes by modifying the column count and row height. Resize panes to help clarify the data.
-
In the left navigation bar, select Home, then select Dashboard.
-
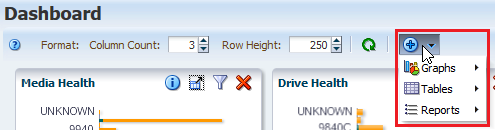
In the dashboard toolbar, adjust the Column Count (1 to 5) and Row Height (100 to 600).
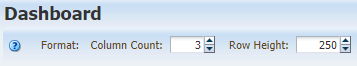
Changes take effect as soon as you press Enter or move the cursor.
-
Having numerous columns may truncate the pane toolbar. Click the drop-down in the top-right of the pane to view the hidden icons.
Add a Dashboard Pane
Add a maximum of 30 panes to the dashboard. Newly added panes appear at the bottom of the dashboard.
You can add more than one instance of the same type of pane, and you can filter each instance differently so you can focus on different data. For example, you may want to add two separate Media Health panes: one for big libraries (SL3000 and SL8500) and one for small (SL150 and SL500).
Note:
Adding a large number of dashboard panes may result in the pane legends being truncated or not displayed at all. If this occurs, you may want to remove some panes to restore the legends.-
In the left navigation bar, select Home, then select Dashboard.
-
In the dashboard toolbar, click Add a Dashboard Portlet
 .
.
-
From the one of the submenus (Graphs, Tables, or Reports), select the specific pane to add.
-
The pane appears at the end of the dashboard display. To reorder the panes, see Move a Dashboard Pane.
-
To retain the newly added pane for future logins, save the dashboard as a template (see Create a Template).
Move a Dashboard Pane
Drag and drop panes within the dashboard to reorder them.
-
In the left navigation bar, select Home, then select Dashboard.
-
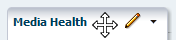
Hover over the top of the pane (near the title). Until you see the move icon.
-
Drag and drop the pane to a new location.
-
To retain the order for future logins, save the dashboard as a template (see Create a Template).
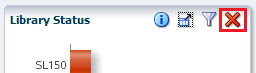
Remove a Dashboard Pane
Remove a pane to no longer have it display in the dashboard.
-
In the left navigation bar, select Home, then select Dashboard.
-
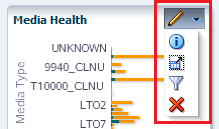
On the pane's toolbar, click Remove Pane
 .
.
-
To retain the current dashboard view for future logins, save the dashboard as a template (see Create a Template).
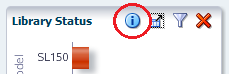
Annotate a Dashboard Pane
Add or modify the text annotation for the current pane. The annotation appears on executive reports and can clarify the information displayed or draw attention to specific data.
Annotation text is specific to the current dashboard template and your username. For example, if the Drive Health pane appears in several dashboard templates, each instance of the Drive Health pane can have a different annotation associated with it. Annotations entered by one user on the Drive Health pane do not appear to a user logged in with a different username.
-
In the left navigation bar, select Home, then select Dashboard.
-
Click Panel Information in the pane's toolbar.
-
Enter the annotation text (up to 1000 characters) for this instance of the pane, and then click Save Annotation.
-
For the updated annotation to appear on an executive report, you must save the current dashboard template. See Create a Template and Modify a Template. If you log out of this session without saving the template, the annotation will be lost for future login sessions and executive report runs.
Filter a Dashboard Pane
Apply a filter to a pane to alter the data displayed.
If a pane already has a filter, it will have the Applied Filter ![]() icon. Hover over the icon to display a description of the filter.
icon. Hover over the icon to display a description of the filter.
-
In the left navigation bar, select Home, then select Dashboard.
-
On the pane's toolbar, click Filter Data
 or the Applied Filter
  icon.
icon.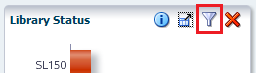
-
For details on how to filter data, see Filter Using the Dialog Box.
-
To clear all filter criteria, click Reset within the Filter Data dialog.
Save the Dashboard Layout
If you have Operator or Administrator privileges, once you arrange the dashboard the way you like, you can save it as a custom template. The order and size of the panes and any applied filters are saved as part of the template.
See Create a Template.