7Using Siebel Script Editors
Using Siebel Script Editors
This chapter describes how to use the Siebel Script Editors. It includes the following topics:
Using the Siebel Script Editor
This topic describes how to use the Siebel Script Editor. It includes the following information:
Overview of Using Siebel Script Editor
The Siebel Script Editor is an editor that allows you to create and maintain scripts that use Siebel VB, Siebel eScript, or Browser Script. If you cannot use a declarative configuration to implement the functionality you require, then you can use the following editors to add a script to a Siebel object:
Server Script Editor. Allows you to create and modify Siebel eScript or Siebel VB.
Browser Script Editor. Allows you to create and modify Browser Script that runs in the Siebel client.
For more information, including a description of scriptable events and callable methods on browser objects, see Siebel Object Interfaces Reference, Siebel eScript Language Reference and Siebel VB Language Reference.
About the Siebel Script Editor
You can use the Siebel Script Editor to edit Siebel VB script or Siebel eScript script. It allows you to do the following:
Cut, copy, and paste the text from one location to another location in the Siebel Script Editor. You can also cut and paste text into the Siebel Script Editor.
Import or export a Siebel script.
Associate a given Siebel script with a predefined object event, such as a PreSetFieldValue event for a business component. For more information, see About Predefined Objects.
Debug custom script. For more information, see Using the Siebel Debugger.
Compile custom script. For more information on how to deliver workspaces, see Delivering Workspaces.
The Siebel Script Editor uses a window that is similar to the Windows Notepad editor. It includes the following elements:
Title bar
Drop-down list that you can use to specify an object
Drop-down list that you can use to specify an event
Text entry window
Vertical and horizontal scroll bars that you can use to navigate.
Object Types You Can Script
You can use the Siebel Script Editor to add a script to the following object types:
Application
Applet
Business Component
An object definition for each of these object types includes a Scripted property. If this property includes a check mark, then this object includes a script.
Menus in the Siebel Script Editor
The following items are available from the File menu:
Import. Imports a Siebel script.
Export. Exports a Siebel script.
Save. Saves a Siebel script. Make sure you save your script before you exit the editor.
Exit. Closes the Siebel Script Editor window.
The following items are available from the Edit menu:
Cut. Deletes the selection and saves it to the clipboard.
Copy. Copies the selection to the clipboard.
Paste. Copies the contents of the clipboard to the chosen area.
Delete. Deletes the selection.
Select All. Selects the entire script.
Find. Displays the Find in Script dialog box. You can search for text or spaces.
Replace. Displays the Replace in Script dialog box. You can search and replace text or spaces.
Guidelines for Using Siebel Script Editor
If you use the Siebel script editor, then it is recommended that you use the following guidelines:
Check out or lock the project that the object definition that you modify references. If the project is not locked, then you cannot add text in the Editor window.
To verify the format of your Siebel VB or Siebel eScript script, click the Debug menu, and then click Check Syntax. The Siebel Compiler displays any format errors it finds and indicates the lines where these errors occur.
Save your work frequently and before you close the Siebel Script Editor. Click the File menu, and then click Save to save your work. If you close the Siebel Script Editor without saving your work, then Siebel Tools discards any modifications you make since the last save.
You must deliver the objects that you modify in the workspace before you run a Siebel application. For more information on how to deliver a workspace, see Delivering Workspaces.
When pasting text into the Siebel Script Editor, avoid using two code blocks that use the same name. To do this, do the following depending on the type of script you use:
Siebel eScript. Place the code between
functionName{ and }.You must enclose all function code with curly braces.- Siebel VB. Place the code between
SubName andEnd Sub.
Guidelines for Testing a Script
If you test a script, then it is recommended that you use the following guidelines:
To test a script, you can click the Debug menu, and then click Start. Siebel CRM runs with the new modifications incorporated. You can also click the Start button in the Debug toolbar.
To display an error when you test your script, you can start Siebel CRM in debug mode. To use debug mode, use the
/Hoption on the start-up command line. If it encounters an error in your script, then it displays a dialog box that describes the error. To troubleshoot the error, you can open the Script Editor, click the Debug menu, and then click Check Syntax. For more information, see Validating Script Syntax.If a run-time error occurs in the Siebel client, or if Siebel CRM does not run in Debug mode, then it displays an error message that includes an error code. It returns control to the location in the predefined Siebel code just before the error occurred.
Setting Options for the Siebel Script Editor
You can set options for working in the Siebel Script Editor, including setting a default scripting language, specifying a location for compiling browser scripts, and defining options for debugging. Script Assist options are available only if the ST eScript Engine is enabled. For more information, see Overview of Using the ST eScript Engine.
To set options for the Siebel Script Editor
In Siebel Tools, click the View menu, and then click Options.
In the Development Tools Options dialog box, click the Scripting tab.
Set the options.
For more information, see Development Options for Scripting.
Suppressing Error Messages
This topic describes how to configure Siebel Tools to not display the SBL-EXL-00151 error code and error text in the pop-up error message that the RaiseErrorText method creates.
To suppress error messages
Open Siebel Tools.
Click the Screens menu, System Administration, and then click System Preferences.
Note: In Web Tools, click the Tools menu and then click the System Preferences menu item.In the System Preferences list, set the Suppress Scripting Error Code system preference using values in the following table.
System Preference Name System Preference Value Suppress Scripting Error Code
TRUE
Opening the Siebel Script Editor
This topic describes how to open the Siebel Script Editor.
To open the Siebel Script Editor
In the Object Explorer, click one of the following object types:
Application
Applet
Business Component
In the Object List Editor, locate the object you want to modify.
For more information, see Locating and Modifying Object Definitions in the Object List Editor.
Do one of the following:
Right-click the object you located in Step 2, and then click Edit Server Script or Edit Browser script.
Click the View menu, Editors, and then click Server Script Editor or Browser Script Editor.
Using the ST eScript Engine
This topic describes how to use the ST eScript Engine. It includes the following information:
Overview of Using the ST eScript Engine
The following versions of the Siebel eScript Engine are available:
ST eScript Engine. Available with Siebel CRM version 7.8 and higher. The ST eScript Engine is the default Siebel eScript Engine in version 8.0.
T eScript Engine. Available before Siebel CRM version 7.8.
It is recommended that you use the ST eScript Engine. Starting with Siebel CRM version 8.0, you can use only the ST eScript Engine.
Except for a few differences, the ST eScript Engine is compatible with script that you create with the T eScript Engine. This document refers to each engine by name only if it describes a difference in functionality between the ST eScript Engine and the T eScript Engine.
The ST eScript Engine is compliant with the ECMAScript Edition 4 standard. ECMAScript is the implementation of JavaScript as defined by the ECMA -262 standard. The ST eScript Engine includes the following capabilities:
Performance. Provides higher throughput with a lower CPU and memory footprint in situations where you use a significant amount of script. The result is improved performance and lower maintenance on heavily scripted events.
Scalability. If many users concurrently run scripts, then the performance of the ST eScript Engine is superior to the performance of the T eScript Engine.
Strong typing. Supports strong typing that is compliant with the ECMAScript Edition 4 standard. Strongly typed objects result in scripts that are more functional and improved performance. The T eScript Engine does not support strong typing.
Functionality. Adds new functionality, such as Script Assist, script libraries, favorites, and Fix and Go. For more information, see About Script Assist and Using Fix and Go.
For more information, see Siebel eScript Language Reference.
About ST eScript Engine Warnings
The ST eScript Engine can display warnings that notify you of the following potential problems that might occur if you deliver your custom script:
Referencing a method or property that is not predefined
Referencing an undeclared identifier
Using a variable before it initializes this variable
Using a redundant declaration of an untyped variable
Calling a function that includes an insufficient number of arguments
These errors might cause a run-time failure. You can use these warnings to help fix errors before you deliver your script. To enable or disable the Enable Warnings option, see Setting Options for the ST eScript Engine.
Example of a Warning Message
The following code is an example of a compile warning message that Siebel Tools creates after a run-time failure:
function foo(a)

  {

  var oApp: Application;

     oApp.myMethod ();

  return;

  }

foo ();

Semantic Warning around line 5:Variable oApp might not be initialized.

Semantic Warning around line 5:No such method myMethod

Semantic Warning around line 10:Calling function foo with insufficient number of
arguments.

Unhandled Exception: Function expected
How the ST eScript Engine Determines the Type of Variables That a Script Uses
Type deduction is a feature of the ST eScript Engine that determines the type of local variables that a script uses. It scans the assignments that the script makes to each local variable. If the ST eScript Engine can successfully determine the type for all local variables, then the compiler performs strict type checks and creates statically bound code that runs faster and uses less memory. This configuration might introduce more compile warnings as a result of performing these type checks. It cannot determine the type in all situations. It is recommended that you type your script. To enable or disable type deduction, see Setting Options for the ST eScript Engine.
Example of a Script That Deduces the Local Variable Type
The following script deduces the type of the oDate local variable to the Date. It then creates a warning about the MyMethod method. This method is not defined. This script fails at run time:
function goo()

  {

  var oDate;

     oDate = new Date ()

     oDate.myMethod ();

  return;

  }

goo ()

Semantic Warning around line 19:No such method myMethod

Unhandled Exception: 'myMethod' is not defined
About Script Assist
Script Assist is part of the ST eScript Engine. To help you develop a script, it inspects object definitions, and then makes information about these object definitions available to you. It includes the following functionality:
Syntax highlight. Uses color to highlight reserved words, data types, operators, and other syntax in Siebel VB and Siebel eScript script. You cannot modify these colors. The following table lists the colors that it uses:
Item In the Code Color Reserved word or Siebel VB statement.
Blue
Data type.
OrangeRed
Operator.
Navy
String literal.
SteelBlue
Delimiter. For Siebel eScript only.
Brown
Function. For Siebel VB only.
Magenta
Method list. Displays a list of methods and properties that are available for an object. For more information, see the table that follows on Icons That the Script Assist Window Contains.
Repository inspection. Inspects objects and object types in the repository without requiring you to type a string literal. This functionality results in fewer mistakes in your script. It also understands predefined constants for a business component method.
Favorites. Uses italics to indicate the most frequently used object, method, or property name in the Script Assist window. Favorites exist for only a single Siebel Tools session. When you log out of Siebel Tools, it clears these favorites. If you create a new function, then you must add it to the declarations, and then save the script modifications. If you do not do this, then Siebel Tools does not display the function as a favorite.
Script libraries. Allows you to call a business service function after you declare the business service. You do not declare property sets or make an InvokeMethod call. A script library helps you develop code that is reusable and modular. For more information, see Using Script Libraries with the ST eScript Engine.
Auto complete. Automatically completes an entry after you enter a minimum number of unique characters in the Script Assist window. For example, if you enter
Bus, then Siebel Tools automatically enters the wordBusComp.Auto indent. Maintains a running indent. If you press the Return key or the Enter key, then it inserts spaces and tabs that left-justifies the code.
Tool tips. Allows you to view descriptions of the method arguments that you use.
Includes child scripts. Script Assist can parse a script that you write on a business component, applet, or business service. You can use the Application drop-down list to choose the Siebel application that includes the child script. Script Assist displays the scripts that are written on this application object in the Script Assist window.
Includes scripts you write in the general section. A script that you write in the general section of the script explorer window is available in the Script Assist window. For example, if you write a helper function named Helper in the general section of the current script, and if you start Script Assist, then it includes Helper in a pop-up window.
Using Script Assist with a Custom Siebel eScript Method
If a script references a custom Siebel eScript method on a business component, and if this script does not reside on the same business component that includes this custom method, then Script Assist does not recognize the custom method and cannot display data from it. For example, you create a business component method named MyMethod on the Account business component. You then create a script on the Contact business component that references the MyMethod method. In this example, Script Assist does not include any information about your custom My Method method.
Icons That the Script Assist Window Contains
The following table describes the methods and properties that the Script Assist window shows when you choose an object. For more information, see Opening the Script Assist Window.
Table Icons That the Script Assist Window Contains
| Icon | Description |
|---|---|
Read-only property |
|
Modifiable property |
|
Method |
|
Class object |
|
Primitive |
Enabling the ST eScript Engine
If you want to use the T eScript Engine, then you can disable the ST eScript Engine in Siebel Tools. If you disable the ST eScript Engine, you can enable it later.
To enable the ST eScript Engine
Open Siebel Tools.
Click the Screens menu, System Administration, and then click System Preferences.
Note: In Web Tools, click the Tools menu and then click the System Preferences menu item.In the System Preferences list, set the Enable ST Script Engine system preference to one of the following values:
TRUE. Enables the ST eScript Engine.
FALSE. Disables the ST eScript Engine.
Caution: Disabling the ST eScript Engine is not recommended. For help with disabling this engine, create a service request (SR) on My Oracle Support. Alternatively, you can phone Global Customer Support directly to create a service request or get a status update on your current SR.If you want to revert to the T eScript Engine after you use the ST eScript Engine, and if you use strongly typed code while you use the ST eScript Engine, then you must undo this strongly typed code before you revert to the T eScript Engine. For more information about setting system preferences, see Siebel Applications Administration Guide.
Deliver your scripted objects.
For more information on how to deliver your workspaces, see Delivering Workspaces.
To use the Siebel eScript Engine, exit Siebel Tools, and then reopen it.
Enabling the ST eScript Engine in the Siebel Application
If you enable the ST eScript Engine in the development environment, then make sure you also enable it in the Siebel application. You must use the same Siebel eScript Engine setting when you compile code in these environments, and you must use the same engine setting for these environments that you use to compile the code.
Setting Options for the ST eScript Engine
This topic describes how to set options for the ST eScript Engine.
To set options for the ST eScript Engine
Make sure the ST eScript Engine is enabled.
For more information, see Enabling the ST eScript Engine.
In Siebel Tools, click the View menu, and then click Options.
In the Development Tools Options dialog box, click the Scripting tab.
To define the options in the Engine Settings section, use the information in the following table. It is recommended that you enable all of these options.
Option Description Enable Warnings
If this check box includes a check mark, then Siebel Tools displays script compile warning messages. For information, see About ST eScript Engine Warnings.
Deduce Types
If this check box includes a check mark, then Siebel Tools deduces the type of local variables. For more information, see How the ST eScript Engine Determines the Type of Variables That a Script Uses.
Fix and Go
If this check box includes a check mark, then Siebel Tools allows you to test and debug your script without compiling. For more information, see Using Fix and Go.
Opening the Script Assist Window
You can open the Script Assist window.
To open the Script Assist window
In the Script Editor Explorer window, choose the object you want to modify.
Press CTRL+SPACE.
Siebel Tools displays the Script Assist window. This window lists all methods and properties that are available for the object you choose.
Using Fix and Go
If you enable Fix and Go, then you can edit a script in a Siebel Tools session, and then test your modifications in the Siebel client without closing this client or recompiling the script. This feature allows you to save time in script development, testing, and debugging. You can use Fix and Go only with a server script and the ST eScript Engine.
To use Fix and Go
Enable Fix and Go in the Development Tools Options window.
For more information, see Setting Options for the ST eScript Engine.
Create a server script in the Siebel Script Editor, save it, and then deliver the repository.
If you attempt to save a script that includes a format error, then Siebel Tools displays a script error message that prompts you to fix the line or the lines that cause the error. For more information on how to deliver your workspaces, see Delivering Workspaces.
Use the Siebel Debugger to run the script.
If an error occurs, then stop the script.
Make modifications, save your script, and then run it again.
You must save and deliver all script modifications before you exit Siebel Tools. If you do not save your modifications, then they are lost.
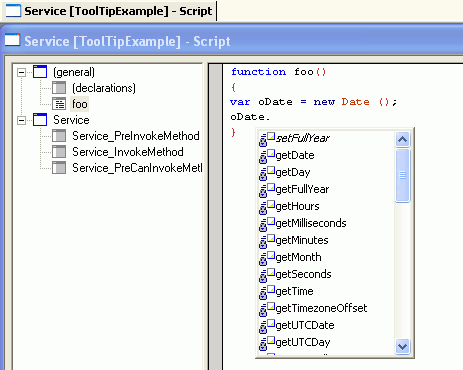
Using Running Tool Tip
Running Tool Tip is a help feature in the Siebel Script Editor that you can use to write a script. If you enter a method name in the Running Tool Tip window, then it displays the method arguments that you can use with this method. If you enable Script Assist, then Siebel Tools enables Running Tool Tip, by default. For more information, see About Script Assist.
To use Running Tool Tip
Open the Siebel Script Editor.
For more information, see Opening the Siebel Script Editor.
In the Script Editor window, enter a method name followed by an open parenthesis.
Siebel Tools displays the Running Tool Tip window. This window displays the method name and the method arguments. It uses italicized text to suggest an argument. Siebel Tools hides this window after you enter all the required method arguments.
The following image includes the Running Tool Tip window.
How Running Tool Tip Differs from Tool Tips in Script Assist
If you enter a function name followed by a left parenthesis in the Script Editor, then Script Assist or Running Tool Tip shows depending on the type of function you enter.
Running Tool Tip Window
If you enter a simple call expression, then Siebel Tools displays the Running Tool Tip window. A call expression allows you to send anything to the function according to the type of argument. For example, if you use the following code to enter a data object function, then Siebel CRM can send a value that you choose to this function:
Date.SetFullYear
For example, you enter the following code:
var oDate = new Date();

oDate.SetFullYear(
In this example, Siebel Tools displays the following code in the Running Tool Tip window:
oDate.SetFullYear(year, month, date)
If you enter a collection function, then Siebel Tools displays the Script Assist window. This window includes a list of methods and properties that you can choose for an object. A collection function is a type of function that includes a finite set of values. You can send values to a collection function. For example, if you enter the following code, then Siebel Tools displays fields that are defined only for this business component:
BusComp.GetFieldValue
The following code is an example:
var bo = TheApplication().GetBusObject(
For more information about using functions and expressions in Siebel eScript, see Siebel eScript Language Reference.
Using Script Libraries with the ST eScript Engine
A script library is a part of the ST eScript Engine that allows you to call a business service method from a script. This topic describes how to make a custom business service method available to a business service script library and how to call this method in the script library. Using a script library is optional. Siebel CRM supports code you write before Siebel CRM version 8.0. For more information about script libraries, see Siebel eScript Language Reference.
Making a Custom Business Service Method Available in a Script Library
This topic describes how to make a custom business service method available in a script library.
To make a custom business service method available in a script library
Create a script for a business service method.
Validate the script.
For more information, see Validating Script Syntax.
Save the script.
Make sure the External Use property of the business service contains a check mark.
Siebel Tools adds the custom business service method to the script library.
Using a Script Library to Call a Custom Business Service Method
After you make a business service available for use in Siebel Tools, the following items apply:
You can call a business service method of this business service from another script.
The Script Assist window displays these business service methods. For more information, see About Script Assist.
To use a script library to call a custom business service method
Make sure the following options are enabled:
Enable Method Listing
Enable Auto Complete
For more information about setting these options, see Setting Options for the Siebel Script Editor.
In the Siebel Script Editor, type the name of a business service object followed by a period (.).
Siebel Tools displays the business service methods that are available for the business service.
Choose the business service method that you want to add to the script.
Validate the script.
For more information, see Validating Script Syntax.
Example of Using a Script Library
In this example, the mathService business service is enabled for use in Siebel Tools. It uses a business service method named square:
function square (x)

{

  return (x * x);

}
If you use a script library to call an argument, then the compiler examines the argument types to make sure the argument that your script calls is valid and is compatible. The following code calls a business service method named square:
var oBS: Service = TheApplication().GetService ("mathService");

var value = 10;

var square_value = oBS.square (value);
The following image displays a list of the business service methods that are available for the mathService script library. This list displays the following code:
var square_value = oBS
Using the Siebel Debugger
This topic describes how to use the Siebel Debugger. It includes the following information:
Overview of Using the Siebel Debugger
The Siebel Debugger can help you edit a script and remove an error from a script that you write in Siebel VB or Siebel eScript. It displays variables and their values in the Siebel Script Editor window and a diagnostic window. You can use it to slow down or suspend a script from running so that you can monitor the logical flow of your script and to examine the contents of variables. You can use the Siebel Debugger to do the following:
Set a breakpoint. Allows you to use the Debugger so that you can examine the state of the program at this line. For more information, see Using Breakpoints.
Step over a line of code. For example, if the current code line calls a subroutine, then the Debugger skips this line and stops at the next line. It does not call the subroutine.
Step into a subroutine. Runs one line of code according to the following:
The current line calls a subroutine or function. The Debugger stops at the first line of the subroutine or function that the current line calls.
The current line does not call a subroutine or function. The Debugger stops at the next code line.
Examine the value of a variable. The Siebel Debugger includes a Watch window that displays variables and their values. You can examine these values while a script runs.
Setting Debug Options
This topic describes how to set debug options.
To set debug options
In Siebel Tools, click the View menu, and then click Options.
In the Development Tools Options dialog box, click the Debug tab, and then set the options.
The following table includes example settings for the Debug tab. For more information, see Development Options for Debugging.
Option Value Executable
siebel.exe
CFG File
c:\siebel\bin\w32u\enu\uagent.cfg
Working Directory
c:\siebel\bin\w32u
Arguments
You can use the following arguments:
/h. Enables local debugging of server scripts.
/l. Sets the language that Siebel Tools uses for the debug session.
You can include these arguments on the same line and in any order. For example, you can use one of the following for ENU:
/h /l ENU/l ENU /h
User Name
sadmin
Password
******
Data Source
Sample
Enable Profiler
Contains a check mark.
Click the Scripting tab.
In the Debugging section, set the options, and then click OK.
For more information, see Development Options for Visualization Views.
Accessing the Siebel Debugger
You can access the Siebel Debugger.
To access the Siebel Debugger
Do one of the following:
Open the Siebel Script Editor, set a breakpoint in your script, and then click the Start button.
For more information, see Using Breakpoints.
Run a script that includes a run-time error.
If a script includes a run-time error, then Siebel Tools suspends the script, starts the Debugger, and highlights the line that includes the error. An unhandled Siebel VB or eScript error is an example of a run-time error.
Validating Script Syntax
The debugger includes a syntax checker that you can use to make sure your script compiles properly.
To validate script syntax
Open the Siebel Script Editor, click the Debug menu, and then click Check Syntax.
Siebel Tools does a test compile, and then does one of the following:
It finds no error. It displays nothing.
It finds an error. It displays a dialog box that describes the error.
If the script includes an error, then click Go to Line in the dialog box.
Siebel Tools positions the cursor on the script line that causes the error and highlights this line.
Correct the code and repeat Step 1.
If the syntax of the line that you modified is correct, then the dialog box displays the next error it finds, if any.
Repeat Step 1 and Step 2 until you correct all errors.
Click the File menu, and then click Save.
Deliver your changes to the repository.
For more information on how to deliver your workspaces, see Delivering Workspaces.
Using Breakpoints
A breakpoint is a marker in a line of code that stops code from running at this line. It allows you to use the Debugger so that you can examine the state of the program at this line.
To use breakpoints
Do one of the following:
You are editing a script. Place the cursor on the line of code where you want to set a breakpoint, and then press F9.
You are debugging script. Click a line of code.
If a breakpoint does not already exist on this line, then Siebel Tools adds a breakpoint. If a breakpoint already exists on this line, then Siebel Tools removes it.
Using the Calls Window
The Calls window includes a list of subroutine and function calls that Siebel Tools runs prior to the current code line.
To use the Calls window
Open the Siebel Script Editor.
Click the Calls button in the Debugger toolbar while you run the Debugger.
Each line in the Calls window represents a subroutine that Siebel Tools entered but did not complete. If you choose an entry in this list, then the following occurs:
The Debugger window displays the line of code that makes this call.
The Variable window displays the variables that are associated with the procedure that makes the call.
Using the Watch Window While it Monitors a Script
The Watch window displays variables and variable values. You can use it to monitor these values while a script or workflow process runs. The Watch window supports the following variable types:
Local variables
Global variables
Shared global variables
Application variables
Persistent profile properties
Dynamic profile properties
For a detailed example that uses the Watch window, see the information about defining a workflow process that closes obsolete service requests in Siebel Business Process Framework: Workflow Guide.
To use the Watch window while it monitors a script
Attach a script to an object, and then deliver object’s changes.
For more information on how to deliver your workspaces, see Delivering Workspaces.
Start the Siebel client from the Siebel Debugger.
You can press F5 or click the Start icon on the Debug menu. Make sure the /h argument is set in the Debug options. For more information, see Setting Debug Options.
Display the Watch window.
You can press SHIFT+F9 or click the Watch button (glasses icon) on the Debug toolbar.
Tracing a Script
You can run a trace on an allocation, event, or SQL command. You can start a trace for a user account, such as your development team. The Siebel Server saves the trace information to a log file. Tracing a script is not the same as tracing a file. For more information about tracing a file, see the information that describe the Trace, TraceOn, and TraceOff methods in Siebel Object Interfaces Reference.
To trace a script
Log in to the Siebel client, navigate to the Administration - Server Management screen, and then the Components view.
Choose the component that you want to trace.
Navigate to the Component Event Configuration view.
Locate the Object Manager Extension Language Log event.
If this event does not exist, then the component you chose in Step 2 does not support logging. Most components support logging, but some do not. If necessary, repeat Step 2 but choose another component.
Set the Log Level to 1.
To disable logging when you are done, you can set the Log Level to 0 (zero).
Navigate to the Component Parameters view.
(Optional) To display only the script tracing parameters, enter a query using the values from the following table.
Field Value Parameter Alias
Trace*
Subsystem
Object Manager
Set one or more tracing parameters using the values from the following table.
Object to Trace Alias Description Allocations
TraceAlloc
Enter
0(zero) to disable logging. Enter1to enable logging.Events
TraceEvents
SQL Commands
TraceSql
Users
TraceUser
Enter a comma-separated list of user names. Do not use spaces. For example, you can enter the following:
sadmin,mmasters,hkim,cconnors
To set tracing parameters, enter a value depending on when the modification must take affect:
Immediately. You modify values in the Current Value column.
After a restart. You modify values in the Value on Restart column.
Example of a Trace
The following code is an example of a trace that Siebel Tools creates after the Business Service Simulator runs:
ObjMgrExtLangLog ObjMgrExtLangLog 0 00000080475f1578:0 2007-12-12 07:33:45 [User: ] SQLBIND, 90, 1, Y.
ObjMgrExtLangLog ObjMgrExtLangLog 0 00000080475f1578:0 2007-12-12 07:33:45 [User: ] COMPILE, END, <unknown>.
ObjMgrExtLangLog ObjMgrExtLangLog 0 00000080475f1578:0 2007-12-12 07:33:45 [User: ] EVENT, BEGIN, Service
[sam], Service_PreInvokeMethod. ObjMgrExtLangLog ObjMgrExtLangLog 0 00000080475f1578:0 2007-12-12 07:33:45
                [User: ] EVENT, END, Service [sam], Service_PreInvokeMethod. ObjMgrExtLangLog ObjMgrExtLangLog 0
         00000080475f1578:0 2007-12-12 07:34:39 [User: ] SQLSTMT, 91,
Example of a Detailed Trace
The following code is an example of a trace that Siebel Tools creates if the log level is set to high. For brevity, only part of this log file is included:
2021 2007-12-12 07:46:29 2007-12-12 07:56:46 -0700 000003fd 001 003f 0001 09 SCCObjMgr_enu 11534365 5452
780 d:\21022\ses\siebsrvr\log\SCCObjMgr_enu_0011_11534365.log 8.1 [21022] ENU
ObjMgrLog Info 3 000000b9475f1578:0 2007-12-12 07:46:29 (modpref.cpp (949)) SBL-DAT-50803: SharedFileReader:
D:\fs\userpref\SADMIN&Siebel Universal Agent.spf_SDCHS21N625_5452_780: File succesfully opened.
ObjMgrLog Info 3 000000b9475f1578:0 2007-12-12 07:46:29 (modpref.cpp (949)) SBL-DAT-50804: LoadPreferences:
D:\fs\userpref\SADMIN&Siebel Universal Agent.spf: Preferences succesfully loaded.
ObjMgrExtLangLog ObjMgrExtLangLog 0 000000b9475f1578:0 2007-12-12 07:46:29 [User: ] SQLSTMT, 1, SELECT, SELECT
T1.CONFLICT_ID,

T1.DB_LAST_UPD_SRC,

CONVERT (VARCHAR (10),T1.DB_LAST_UPD, 101) + ' ' + CONVERT (VARCHAR (10),T1.DB_LAST_UPD, 8),

CONVERT (VARCHAR (10),T1.LAST_UPD, 101) + ' ' + CONVERT (VARCHAR (10),T1.LAST_UPD, 8),

CONVERT (VARCHAR (10),T1.CREATED, 101) + ' ' + CONVERT (VARCHAR (10),T1.CREATED, 8),

T1.LAST_UPD_BY,

T1.CREATED_BY,

T1.MODIFICATION_NUM,

T1.ROW_ID,

T1.BUILD_NUMBER,

T1.CURR_WEBFILE_VER,

T1.ENTERPRISE_NAME,

T1.PREV_WEBFILE_VER,

T1.RECORD_INFO_TEXT,

T1.REC_IDENTIFIER

FROM

   dbo.S_UIF_WEB_FILE T1

WHERE

   (T1.REC_IDENTIFIER = ?).
ObjMgrExtLangLog ObjMgrExtLangLog 0 000000b9475f1578:0 2007-12-12 07:46:29 [User: ] SQLBIND, 1, 1,
16:sdchs21n625:4330siebel.
Declaring Functions and Procedures in Siebel VB
The Siebel Compiler compiles Siebel VB functions and procedures in alphabetical order for each object definition. If a function or procedure calls another function or procedure that is not defined, then the compiler creates an error message that is similar to the following:
function_name Is An Unknown Function
To avoid this error, you must use the Declare statement to declare the function or procedure in the general declarations section. Siebel eScript does not require you to declare these functions. For more information, see Siebel VB Language Reference.
Using the Script Profiler
This topic describes how to use the Script Profiler. It includes the following information:
Overview of the Script Profiler
The Siebel Script Performance Profiler is a part of the ST eScript Engine that allows you to observe and monitor the performance of a script. For brevity, this guide refers to the Siebel Script Performance Profiler as the Script Profiler.
If you start Siebel CRM in debug mode from Siebel Tools, then the Script Profiler gathers and displays data for all executable scripts. It displays data in the Script Performance Profiler window in Siebel Tools and updates this data if a script runs. You can use this data to monitor script performance, identify performance bottlenecks, and compare performance with previous script runs. The Script Profiler allows you to do the following:
Use the Call Tree view. Displays profile data as a tree of function calls. For more information, see Example of the Script Performance Profiler Window.
View function profile and line profile. Line profile data includes the call count and total time spent for each line that runs in a function. Line profile information is available only for a compiled script and is not available for a line that does not run.
Save profile data to file. You can save profile data that the Script Performance Profiler window shows to a text file.
Use the Siebel Script Debugger and the Siebel Script Profiler. You can use the Script Profiler and the Script Debugger at the same time. Profile data is consistent even if the function uses Debugger functionality, such as a breakpoint.
View the script source. Siebel Tools opens the objects that a script references in the Script Editor window. You can double-click a function name or line number to view the script from the Script Performance Profiler window. The View Source option is available only for a compiled script. It is not available for a runtime script.
Example of the Script Performance Profiler Window
The following image displays an example of the Script Performance Profiler window. It allows you to examine script performance. It displays a line number for each code line, total time spent to run that line, the number of times Siebel CRM runs the line, and so on.
Description of the Columns in the Script Performance Profiler Window
The following table describes the columns that the Performance Profiler window includes. For the Source Line, Call Count, and Total Time columns, if line profiling is enabled for a function, then the line profile displays as child nodes of a function in the Call Tree view and in the Flat Profile view.
Table Description of Columns in the Script Performance Profiler Window
| Column | Description |
|---|---|
Function/Source Line |
Function name and the name of the object that contains the function. For example: Service [ATP Check]::service_preinvokeMethod and BusComp[Account]::foo |
Call Count |
The number of times Siebel CRM calls a function. You can use one of the following views:
|
Total Time |
Total milliseconds spent in this function and in nested functions. |
Max Time |
Maximum milliseconds spent in this function and in nested functions. |
Min Time |
Minimum milliseconds spent in this function and in nested functions. |
Total Self Time |
The total milliseconds spent in the current function, not including time spent in the subtree of this function. |
Max Self Time |
The maximum milliseconds spent in the current function, not including time spent in the subtree of this function. |
Min Self Time |
The minimum milliseconds spent in the current function, not including time spent in the subtree of this function. |
Enabling the Script Profiler and Line Profiler
The Script Profiler and the line profiler are not enabled after you install Siebel Tools. You must enable them.
To enable the Script Profiler
Make sure your Siebel Tools environment is currently connected to the database that a Siebel application uses, and that this application is opened in debug mode.
You can use the Script Profiler only if your Siebel Tools environment is currently connected to the database that a Siebel application uses, and if this application is opened in debug mode.
Make sure the ST eScript Engine is enabled.
You can use the Script Profiler only if the ST eScript Engine is enabled. For more information, see Enabling the ST eScript Engine.
Set the debug options on the Debug tab of the Development Tools Options dialog box.
Make sure you complete options in the Run-time Start Up Information section and the Login Information section. For more information, see Setting Debug Options.
Make sure the Enable Profiler check box on the Debug tab of the Development Tools Options dialog box contains a check mark.
The Enable Profiler option is available only if the ST eScript Engine is enabled. Siebel Tools enables the Script Profiler the next time you use the debug mode in Siebel Tools to open a Siebel application.
Enable line profiling:
Click Set Line Profile Rules.
The Set Line Profile Rules button resides in the Profiler Start Up Options section on the Debug tab of the Development Tools Options dialog box.
In the Line Profile Rules dialog box, add a rule using information from the following table, and then Click Add.
Item Description Object Type
Choose the object type. Only scriptable objects are available. For more information, see Object Types You Can Script.
Object Name
Enter the name of an object. You can include the entire object name or use wildcard operators.
Function
Enter the name of a function. You can enter the entire function name or use wildcard operators. For example, you can enter
Service_PreInvokeMethodorService*.- Repeat Step ii for each rule you want to add.
- Click Ok to exit the Line Profile Rules dialog box.
Click OK to exit the Development Tools Options dialog box.
The settings for the line profile rule remain active only for the current Siebel Tools session.
To disable line profiling, make sure the Enable Profiler check box on the Debug tab of the Development Tools Options dialog box does not contain a check mark.
Running the Script Profiler
This topic describes how to run the Script Profiler. For more information, see Overview of the Script Profiler.
To run the Script Profiler
Log in to Siebel Tools.
Make sure the Script Profiler is enabled.
For more information, see Enabling the Script Profiler and Line Profiler.
Open the Siebel Script Editor for a scriptable object, and then deliver the changes to the script to a repository.
Make sure you deliver the scripted objects or the projects that these objects reference to the repository that the Siebel client uses. If you do not deliver these objects, then the Script Profiler does not display them. For more information, see Object Types You Can Script and Delivering Workspaces.
The Script Profiler is now enabled for runtime sessions and you can open the Siebel application from Siebel Tools in debug mode.
In Siebel Tools, click the Debug menu, and then click Start.
This step opens the Siebel application in debug mode. If Siebel CRM prompts you for a login, then enter the user name and password, and then click Run. For example, to run a script for the Business Service Simulator, you query for the Service Name and Method Name, and then click Run.
In Siebel Tools, click the View menu, Profiler, and then click Call Tree.
Siebel Tools displays the functions that Siebel CRM calls when it runs a script as a hierarchy in the Script Performance Profiler window. It displays the functions that it calls from other functions as child objects. For an example, see Example of the Script Performance Profiler Window.
In the Script Performance Profiler window, you can do the following:
Navigate between nodes to view the different parameters for a function.
Right-click a node, and then choose a menu item. For more information, see Navigating in the Script Performance Profiler Window.
(Optional) To set or reset line profile rules for a function, do one of the following:
Right-click a function node, and then click Enable Line Profiling or Disable Line Profiling. If you modify a line profile rule, then this modification applies to future calls to the function that this rule references. For more information, see Enabling the Script Profiler and Line Profiler.
Use the Debug tab in the Development Tools Options dialog box. For more information, see Setting Debug Options.
Continue monitoring your script.
For example, you want to test custom script on a business service. In the Siebel client, you can navigate to the Business Service Simulator to run a business service, and then navigate back to the Profiler window to examine the profile data that Siebel CRM logs while the script runs.