Copying and Pasting a Visualization or Canvas
You can copy and paste a visualization or canvas within the same workbook, to another open workbook, or to another workbook open in a different browser tab.
When you copy a visualization or canvas from one workbook to another, CIC Analytics does the following:
- Data - The dataset for the pasted visualization or canvas is added to the target workbook. When you open or create the target workbook that you're pasting to, it doesn't need to include the dataset used by the visualization or canvas that you'll copy and paste.
- Filters - The filters in the target workbook and in the pasted visualization or canvas are maintained. You don't need to add the visualization or canvas filters to the target workbook. If there's a conflict between the target workbook and the pasted visualization or canvas filters, then the pasted filters won't overwrite the target's filters.
- Color assignments - The color scheme of the target workbook is applied to the pasted visualization or canvas.
- Calculations - If the same calculation name exists in the target workbook, then the pasted calculation is added and renamed.
Use the following steps to copy and paste a visualization or canvas:
- On the Home page, select a workbook, click the Actions menu, and then select Open.
- In the Visualize canvas, copy a visualization or canvas.
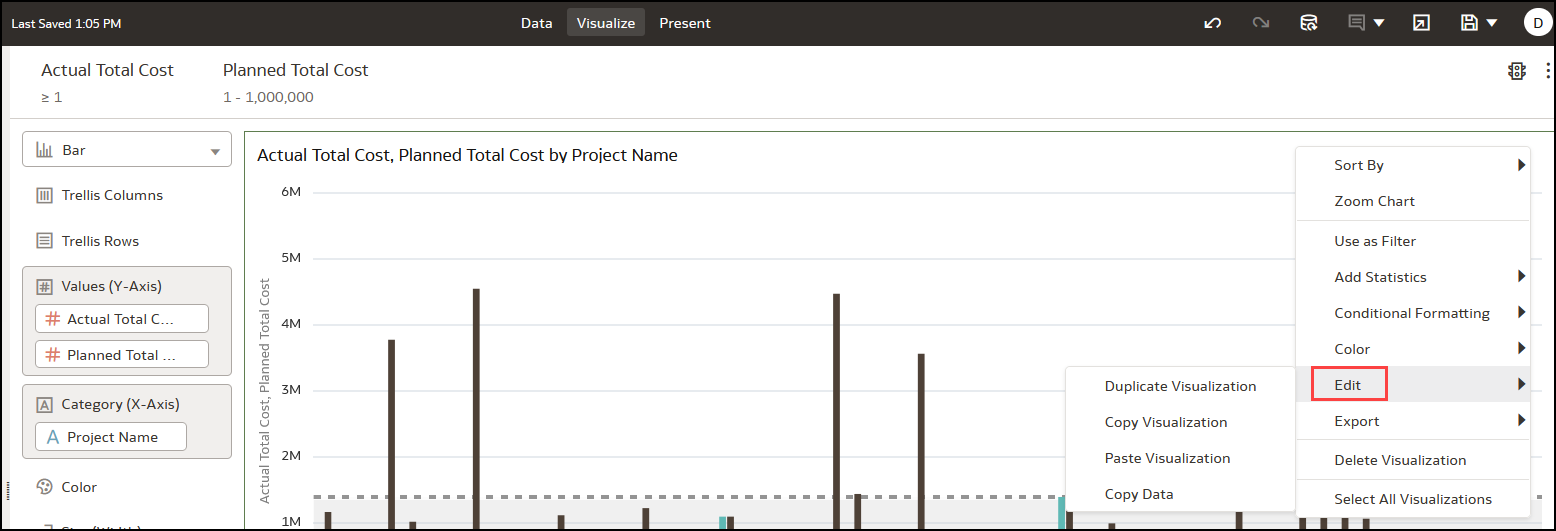
- To copy a visualization, click its Menu, hover over Edit, and then click Copy Visualization.
- To copy a canvas, right-click it and click Copy Canvas.
- Navigate to a visualization or canvas and paste the object.
- To paste a visualization into a canvas that contains visualizations, click an existing visualization's Menu, hover over Edit, and then click Paste Visualization.
- To paste a visualization into a blank canvas, right-click the canvas bar and select Add Canvas. Right-click the new canvas, hover over Edit, and then click Paste Visualization.
- To paste a canvas, right-click the canvas bar and then click Paste Canvas.
Related Topics
Last Published Friday, December 8, 2023