Creating Calculated Data Elements in a Workbook
You can create a new data element to add to your visualization. For example, you might use a BIN function to classify AGE values into four buckets: 0 to 20, 21 to 40, 41 to 60, and 60 plus.
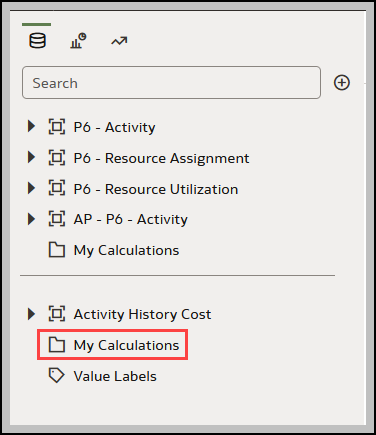
The calculated data elements are stored in the dataset’s My Calculations folder and not in the workbook. In a workbook with a single dataset only one My Calculations folder is available and the new calculated data elements are added to it. In a workbook with multiple datasets My Calculations folder is available for each set of joined and not-joined datasets. Ensure that you’re creating the calculated data elements for the required dataset or joined dataset. The new calculated data elements are added to the My Calculations folder of the datasets (joined and non-joined) that you create the calculation for.
- On the Home page, select a workbook, click the Actions menu, and then select Open.
- Select a canvas to work in.
- Navigate to the bottom of the Data Panel, right-click My Calculations, and click Add Calculation to open the New Calculation dialog.
- Enter a name.
- In the expression builder pane, compose and edit an expression.
You can drag and drop a column into the expression builder pane only if the column is joined to the dataset.
- Click Validate.
- Click Save.
Related Topics
Last Published Friday, December 8, 2023