Begin to Build a Workbook and Create Visualizations

To start a workbook, choose and add a dataset and then drag and drop its columns onto the Visualize page's canvas to create visualizations.

If you want to learn about the datasets that are available to you, then you can view a list of datasets and find out more information about each dataset. See View a List of Datasets and Information About Them.

A workbook can contain one or more datasets. When you add more than one dataset, CIC Analytics blends the data. You can check the default blending, or update or add data blending between datasets. See Blend Datasets.

  1. On the Home page, click Create and click Workbook.
  2. In the Add Dataset dialog, click a dataset and then click Add to Workbook.
  3. Optional: To add another dataset, go to the Data Panel, click Add (+).

    Adding another dataset from the Data panel

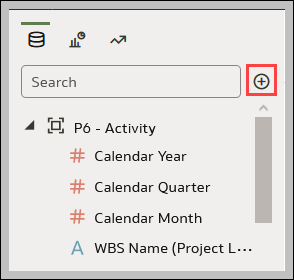
  4. Optional: Select Add Dataset, and in the Add Dataset select a dataset and click Add to Workbook.
  5. In the Data Panel, locate and drag and drop data columns onto the Visualize canvas to start building visualizations.
  6. Click Save.

Related Topics

Visualizing and Analyzing Data

Creating a Workbook Using Datasets and/or Subject Areas

Working with a Workbook's Datasets

Building a Visualization by Adding Data from Data Panel

About Visualization Types

Using Advanced Analytics Functions

Creating Calculated Data Elements in a Workbook

Sorting Data in Visualizations

Undo and Redo Edits

About Refreshing a Workbook's Data

Refreshing a Workbook's Data

Pausing Data Queries in a Workbook

Working with Canvas Properties

Copying and Pasting a Visualization or Canvas

Copy and Paste a Visualization's Data

Working with Multiple Visualizations on a Canvas

Changing Visualization Types

About Visualization Properties

Adjusting Visualization Properties

Highlighting Important Data Events with Conditional Formatting

Applying Color to Visualizations

Formatting Numeric Values of Columns

Formatting Numeric Values of Visualizations

Setting Currency Symbols for Visualizations

Adding Notes to Visualizations

Analyzing Data with Explain

Assigning Shared Folder and Workbook Permissions


Last Published Friday, December 8, 2023