Changing Visualization Types
You can change visualization types to best suit the data you’re exploring.
When you create a workbook and add data elements to the canvas, Auto Visualization mode chooses the most appropriate visualization type based on the selected data element. The Auto Visualization mode is on (selected) by default. If you add more data elements, the visualization type is automatically updated, and the best type is selected based on the data elements.
If you want to use a different visualization type, then you need to select it from the visualization type list. When you change the visualization type, Auto Visualization mode is turned off. When the Auto Visualization mode is off (deselected), adding more data elements to the canvas won’t change the visualization type automatically.
- On the Home page, select a workbook, click the Actions menu, and then select Open.
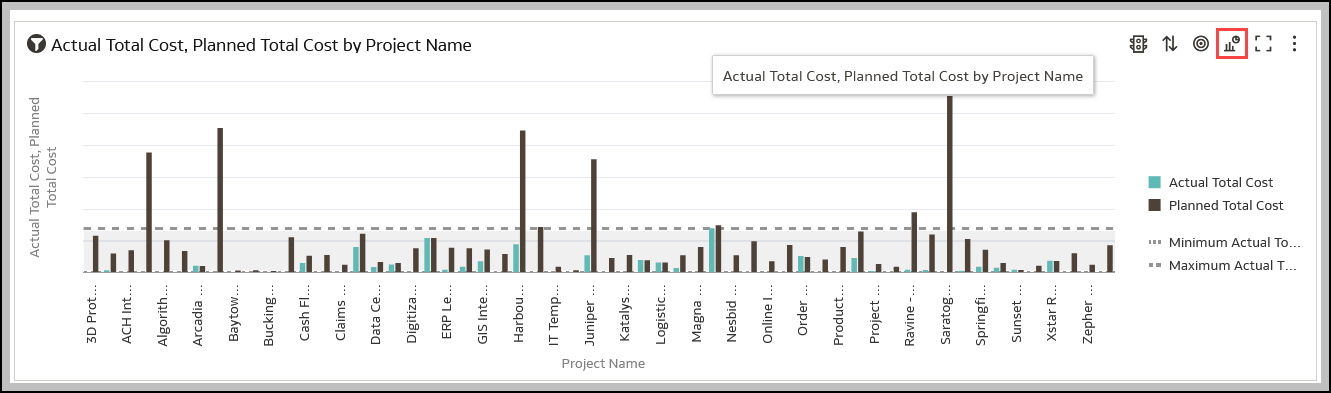
- Select a visualization on the canvas, and on the visualization toolbar, click Change Visualization Type.
- Select a visualization type. For example, select Treemap to change the visualization type from Pivot to Treemap.
- When you change the visualization type, the data elements are moved to matching drop target names. If an equivalent drop target doesn’t exist for the new visualization type, then the data elements are moved to a Grammar Panel section labeled Unused. You can then move them to the Grammar Panel section you prefer.
Related Topics
Last Published Friday, December 8, 2023