Setting Currency Symbols for Visualizations
You can set measure values in a visualization to display an appropriate currency symbol.
You can configure a measure to use a custom currency to display the symbol associated with a currency. For example, if you set a canvas filter to display a European Ledger, then the Euro symbol is displayed for each measure value that's associated with the custom currency property. The workbook data must contain a currency code column, for example, a Ledger Currency column. The currency code column enables the display of an appropriate currency symbol for the measure column, for example, a Profit column.
- On the Home page, select a workbook, click the Actions menu, and then select Open.
- In the Properties panel for a selected measure, click the Values tab, click Number Format, and select Currency.
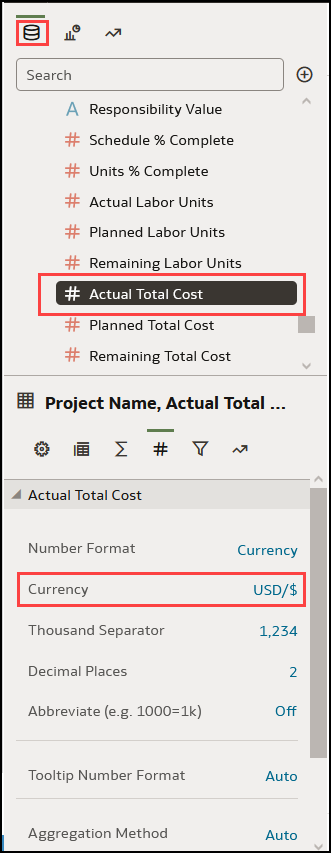
- In the Currency field, click the currently displayed value and select Custom.
- In the Custom field, add the column that determines the currency code.
- Click Save.
Related Topics
Last Published Friday, December 8, 2023