Sometimes you're working with a lot of data in visualizations. To optimize your view of that data in the project’s visualization canvas, you need to sort it.
If your workbook doesn't have a visualization, create one. See Begin to Build a Workbook and Create Visualizations.
- On the Home page, select a workbook, click the Actions menu, and then select Open.
- In the Visualize canvas, do one of the following:
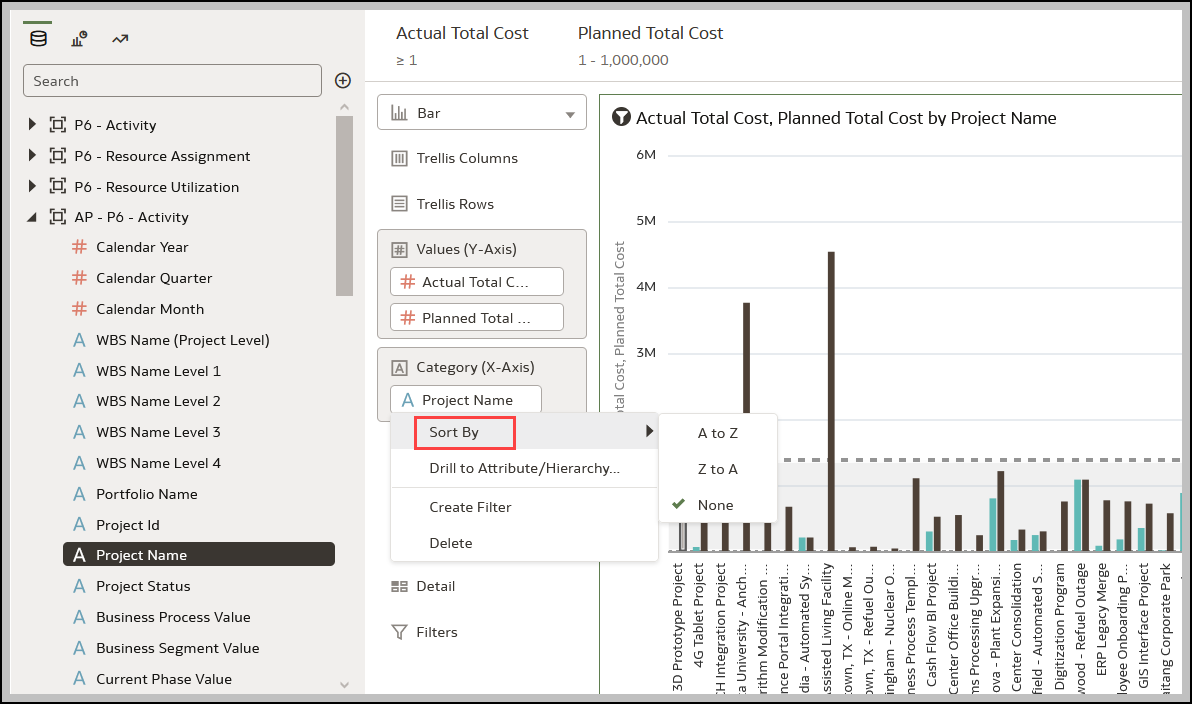
- In the main editing panel, right click the data element you want to sort, hover over Sort By next to the element label, and select a sorting option (for example, Low to High, High to Low, None).
- In the Visualization Grammar Panel, Grammar pane, right click the data element you want to sort, hover over Sort By then click a sorting option (for example, Low to High, A to Z, None).
Visualizing and Analyzing Data
Creating a Workbook Using Datasets and/or Subject Areas
Begin to Build a Workbook and Create Visualizations
Working with a Workbook's Datasets
Building a Visualization by Adding Data from Data Panel
About Visualization Types
Using Advanced Analytics Functions
Creating Calculated Data Elements in a Workbook
Undo and Redo Edits
About Refreshing a Workbook's Data
Refreshing a Workbook's Data
Pausing Data Queries in a Workbook
Working with Canvas Properties
Copying and Pasting a Visualization or Canvas
Copy and Paste a Visualization's Data
Working with Multiple Visualizations on a Canvas
Changing Visualization Types
About Visualization Properties
Adjusting Visualization Properties
Highlighting Important Data Events with Conditional Formatting
Applying Color to Visualizations
Formatting Numeric Values of Columns
Formatting Numeric Values of Visualizations
Setting Currency Symbols for Visualizations
Adding Notes to Visualizations
Analyzing Data with Explain
Assigning Shared Folder and Workbook Permissions