Managing Errors by Integration Instance

You can manage errors by the specific integration instance in which they occurred.

Management tasks consist of viewing the business identifiers defined for the integration, the instance identifier of the integration, the location of the error, the time at which the error occurred, the audit trail, and the specific error message. You can also discard failed messages.

Viewing Errors by Integration Name, Instance Identifier, Location, or Time of Occurrence Over a Specific Time Period

You can display errors by integration name, instance identifier, error location, or the time of occurrence over a specific time period. This provides you with a more granular view of integration failure details.

To display errors by integration name, instance identifier, error location, or the time of occurrence over a specific time period:
  1. On the Integration Cloud Service toolbar, click Monitoring.

  2. In the navigation pane, click Errors, then click Error Message Details.
    The Error Message Details page is displayed. Any errors that are displayed by default are those that occurred within the selected time period.
  3. From the menu, select the time period for which to display error information.
    Any errors that occurred during the specified time period are displayed immediately below the menu.
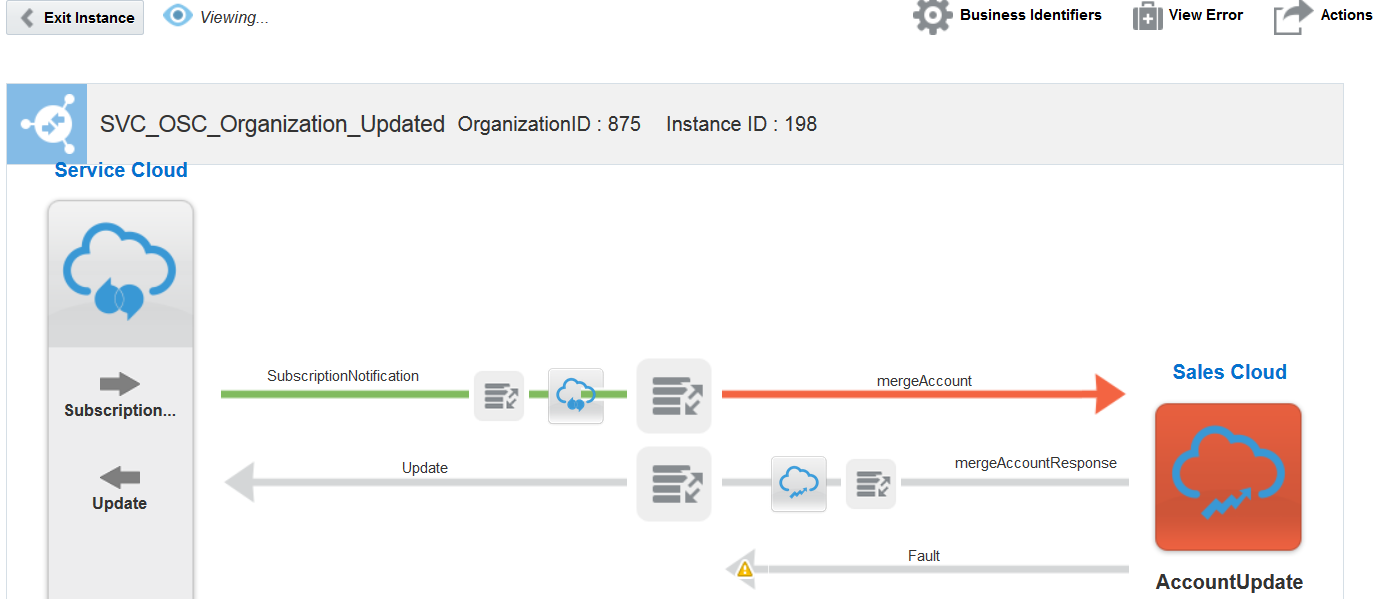
  4. Click the primary business identifier name to access a graphical view of the integration instance. This page provides information about the business identifiers defined for an instance, the instance identifier of the integration, the location of the error, the time at which the error occurred, the audit trail, a button for discarding the error, and other information.

Viewing the Integration Instance in Which Errors Occurred

You can view the integration instance in which errors occurred. From the integration instance page, you can perform multiple tasks, including viewing business identifiers in the integration, viewing the audit trail, viewing error messages, and discarding errors.

To view the integration instance in which errors occurred:
  1. On the Integration Cloud Service toolbar, click Monitoring.

  2. In the navigation pane, click Errors, then click Error Message Details.
  3. Click the business identifier included in the failed integration instance.

    The integration is displayed. The direction in which the error occurred is indicated by the color red. The primary business identifier and instance identifier of the integration are displayed above the integration.

    You can perform multiple tasks on this page, including viewing all business identifiers and values in the integration, viewing the audit trail, viewing errors, viewing the payload, and discarding errors.

Discarding Errors by Integration Instance

You can discard errors by integration instance in several locations. A discarded error message is removed from the Errors Message Details page and can be seen in a discarded state on the Tracking page. You cannot perform any further operations on a discarded message, including recovery. After a certain time period, the error message is permanently deleted from the server.

To discard errors by integration instance:
  1. On the Integration Cloud Service toolbar, click Monitoring.

  2. In the navigation pane, click Errors, then click Error Message Details.
    The Error Message Details page is displayed. Any errors that are displayed by default are those that occurred within the selected time period.
  3. Select the appropriate method for discarding errors:
    1. To discard all errors, click Select All, then click Discard.
    2. To discard selected errors, select the check boxes for the appropriate errors, then click Discard.
    3. To discard a single error, select the checkbox for the error, then click Discard or simply click Discard at the far right of the error to discard.
      You can also view and discard errors on the integration instance page.
  4. Click the business identifier included in the failed instance.

    The integration instance is displayed.
  5. To delete the error, click Actions, then click Discard.
  6. Click Yes when prompted to confirm you selection.

Viewing Specific Error Details

You can view specific error details by integration instance.

To view specific error details:
  1. On the Integration Cloud Service toolbar, click Monitoring.

  2. In the navigation pane, click Errors, then click Error Message Details.
    The Error Message Details page is displayed. Any errors that are displayed by default are those that occurred within the selected time period.
  3. To view details about a specific error, click the business identifier included in the failed instance.
  4. In the upper right corner, click View Error. This action displays the complete error message.

Viewing the Audit Trail of a Failed Integration Instance

You can view the audit trail of a failed integration instance. This enables you to see where an integration error occurred in the message flow.

To view the audit trail of a failed integration instance:
  1. On the Integration Cloud Service toolbar, click Monitoring.

  2. In the navigation pane, click Errors, then click Error Message Details.
  3. Click the business identifier included in the instance you want to view.
    The instance integration is displayed. The direction in which the error occurred is indicated by the color red.

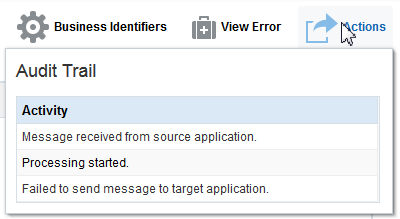
  4. In the upper right corner, click Actions, then click View Audit Trail.
    The audit trail shows details about the movement of the message through the integration, including where the failure occurred.
    Description of GUID-B83C0023-F753-40C4-BC1D-63471B4A3400-default.png follows
    Description of the illustration GUID-B83C0023-F753-40C4-BC1D-63471B4A3400-default.png

Viewing Business Identifiers in Failed Integration Instances

You can view the business identifiers included in failed integration instances.

To view business identifiers in failed integration instances:
  1. On the Integration Cloud Service toolbar, click Monitoring.

  2. In the navigation pane, click Errors, then click Error Message Details.
    The Error Message Details page is displayed. Any errors that are displayed by default are those that occurred within the selected time period.
  3. To search for a specific business identifier, enter the exact business identifier value in the search field, then click Search. For example if business identifier OrgId has a value of test2, enter test2.
    Any business identifiers with the specified value are displayed.
  4. To view details about the business identifiers included in a failed integration instance, click the business identifier.

    The integration instance is displayed.
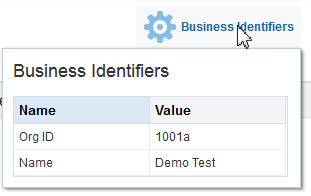
  5. Click Business Identifiers to display all the defined business identifiers and values in the integration.

Viewing the Message Payload of a Failed Integration Instance

You can view the message payload of a failed integration instance.

To view the message payload of a failed integration instance:
  1. On the Integration Cloud Service toolbar, click Monitoring.

  2. In the navigation pane, click Errors, then click Error Message Details.
  3. Click the business identifier included in the instance you want to view.
    The instance integration is displayed. The direction in which the error occurred is indicated by the color red.

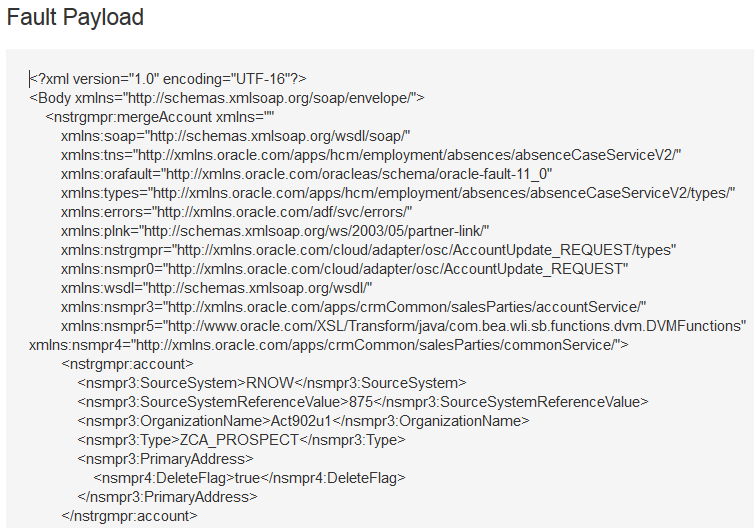
  4. In the upper right corner, click Actions, then click View Payload.
    The audit trail shows the message payload of the integration instance.